Analysis Champion Data articles

Remove this Banner Ad

I can't agree with there relative valuation of different acts since I don't have access to there very complicated formula/models. But what I do know is there ranking system can have some funny results which make me take it less seriously.

For example the 2011 grandfinal
http://www.footywire.com/afl/footy/ft_match_statistics?mid=5342

They gave Leon Davis 119 points,
even though his direct opponent scored the first two goals of the game and he was pretty meh,
His ranking is more than anyone on our team other than Selwood,

More than Hawkins (who changed the game after half time) 117
Bartel 95 (3 goals and the norm smith)

Even though we won quite comfortably in the end, 6 out of the top 8 ranked players played for Collingwood and as a team they still ranked more points then Geelong.
I agree that was a weird case, one I have raised specifically before: http://www.bigfooty.com/forum/threa...-data-ranking-points-but-win-the-game.978389/
 
Ignoring the relative action importance weighting(which is a big issue on itself when you see it in action, if a team is three goals down and goes on to win, the first goal is just as important than the goal that puts them in front), each act, handball,kick mark on the lead etc is subscribed a certain number of points (I making up the numbers but the principal is the same) why is a kick worth 3 points and a hand ball 2 or a tackle 4 (I got these values from DT, the SC valuation has a lot more categories) there is still no basis for giving these acts this relative valuation. That's what the AFL player ratings is trying to do.
There is never going to be a perfect way to achieve the outcome they're looking for. It's just too subjective- perhaps the kick is worth more than a handpass because of metres travelled- but then is a 15m kick worth less than a 45m kick?
And is a block for a teammate worth as much as corralling an opponent?
Far too many variables and all invented because people want to prove that player A is better than Player B.

It's not about being perfect, its about having a rational basis for weighting the different acts rather than the current arbitrary weightings. They should be able to explain for example why a tackle is worth 2 handballs.
 

Log in to remove this ad.

It's not about being perfect, its about having a rational basis for weighting the different acts rather than the current arbitrary weightings. They should be able to explain for example why a tackle is worth 2 handballs.
Not having access to all the data they have- things like where on the ground the actions have happened and how they've influenced the play- makes it difficult for us to assess the decisions which seem arbitrary to us. I understand that there have been studies done through universities on CD material - this is one that focuses on developing some way of assigning number values to the stats:
http://www.swinburne.edu.au/magazine/5/110/football-numbers-man-brings-players-to-account/
-and I'm sure there will be heaps of maths/Stats departments in Unis around the country that have one or two students processing CD information in some shape or form.

That sounds like what became the AFL player rankings (it's run by CD). Which is different from the SC/CD rankings.
 
That sounds like what became the AFL player rankings (it's run by CD). Which is different from the SC/CD rankings.
Yeah, but don't they all apply a variation of some magic set of formulae to the same raw stats data? I know the weightings are different and some use more complex info like field position, difference in scores at the time of the action, whether a player's shoelace was tied or untied and multiplied by the surname of his grandmother's cousin. I was sort of just saying that the whole thing is very subjective- for all of SC/AFL rankings- and it is because CD (or whoever manipulates their data) is trying to convert something we are watching into pure numbers that can be plotted on a graph.
If 10 people watch a game of footy, how likely is it that they will each pick exactly the same 5 best players on the ground? You will find that one person will notice the player with the most possessions more, another will pick the player who kicked the most goals, yet another could focus on some player who made an enormous number of defensive spoils, tackles and smothers. If it's difficult to pick a best player via this method, how much more difficult is it to choose a best player after their actions have been reduced to numbers, chewed up, factorised, integrated, matricised, permutated and differentiated- then spat out at the end?

I guess I must subscribe to the KISS method. Compare the raw data and combine that with watching the game.
Guess that puts paid to all the SC and other Fantasy comps ;)
 
Interesting thread this.

Read with interest in the 2015 edition of the AFL Prospectus that in terms of hitouts to advantage percentage, we actually have the best two ruckmen in the league in that stat - Simpson and Stanley. Admittedly, they have such a small sample size in that regard compared to the likes of Sandilands, Goldstein and co.

Stanley was also second in winning percentage in one-on-one contests as a forward, behind Hawkins. In terms of defensive one-on-one contests, Taylor, Rivers and Lonergan were 1st, 2nd and 3rd across the league for losing percentage.
 
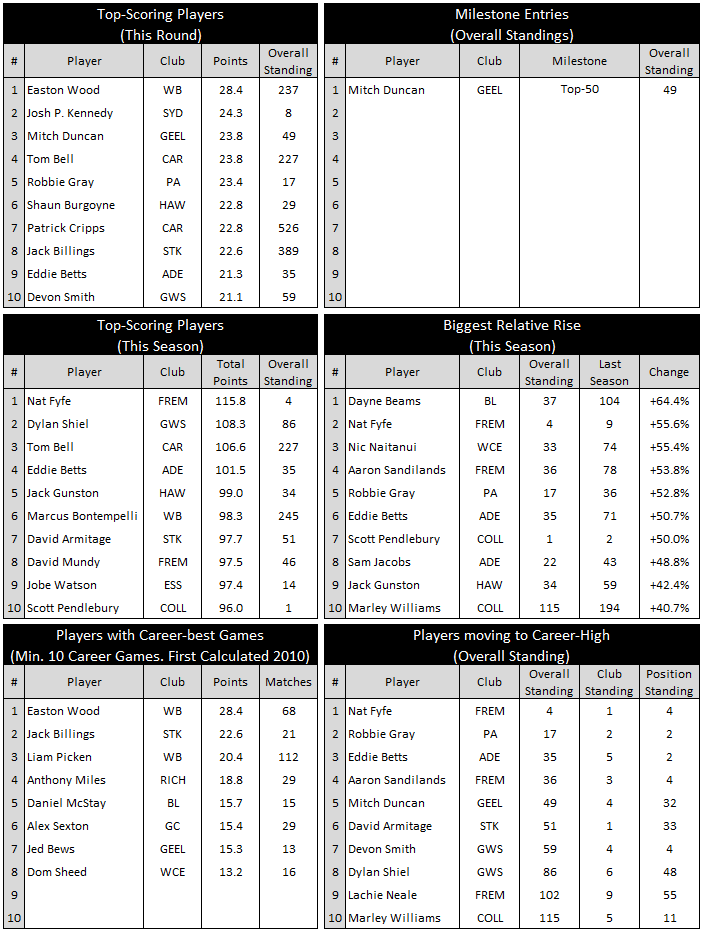
According to the AFL Player Ratings, Mitch Duncan has broken into the top 50 players for the first time in his career:

CErpUeAUMAA6MgC.png

 
Interesting thread this.

Read with interest in the 2015 edition of the AFL Prospectus that in terms of hitouts to advantage percentage, we actually have the best two ruckmen in the league in that stat - Simpson and Stanley. Admittedly, they have such a small sample size in that regard compared to the likes of Sandilands, Goldstein and co.

Stanley was also second in winning percentage in one-on-one contests as a forward, behind Hawkins. In terms of defensive one-on-one contests, Taylor, Rivers and Lonergan were 1st, 2nd and 3rd across the league for losing percentage.
There was an article written late last year, ranking all of those three players in the top 5 (EDIT- make that Top 4!) of the AFL - not sure if the article below was the one I read but it does mention all 3 players. This was written in early August, specifically on Harry:

Taylor has not lost a one-on-one contest in the past four weeks.
But not only is the blue-chip swingman giving his opponents nothing — conceding only two goals in his past four games according to Champion Data — the dual All-Australian and premiership stopper is once again hurting rivals on the rebound.
Taylor has almost doubled his average possession tally from 12 .6 (Rounds 1-15) to 23.3 (16-19). His metres gained has suddenly skyrocketed from 254m per game to 435m.
Even better, the two-time premiership cornerstone is winning his own ball.

In the past month, the 193cm defender has won the ball back off the opposition 34 times — ranked equal second in the competition.

By Taylor’s own admission, he started the year a little down.
In his defence, he was always stopping his man. Taylor is rated the best one on one defender in the AFL across the whole season. He has the lowest losing percentage (10.4 per cent) in one-on-one contests of all key defenders who have played a minimum eight games.

Three of the five players in that category are Cats — Taylor (1st), Tom Lonergan (2nd) and Jared Rivers (4th).


http://www.heraldsun.com.au/sport/a...o-join-fremantle/story-fni5f6yf-1227017037124
 
Prior to the start of this season, CD put out an interactive table with a few rankings- you just select the rankings you want to look at, at the top of the table, and the graph produces the details.

http://www.heraldsun.com.au/sport/a...e-of-2015-season/story-fni5f3kt-1227289022102

In summary:
POINTS FOR: 6TH
POINTS AGAINST: 9TH
CONTESTED POSSESSIONS: 13TH
KICKING: 4TH
PRESSURE: 1ST
% GOAL INSIDE 50: 7TH
% CONCEDING OPPOSITION GOALS ONCE INSIDE 50: 12TH

According to CD, the Cats have rated highly in the pressure category under Chris Scott's coaching. They were 5th in 2011, 1st in 2012, 2nd in 2013 and 1st in 2014.
(NB. Saints ranked 6th for pressure last year, so we know how far applying pressure got them! )
 

(Log in to remove this ad.)

Prior to the start of this season, CD put out an interactive table with a few rankings- you just select the rankings you want to look at, at the top of the table, and the graph produces the details.

http://www.heraldsun.com.au/sport/a...e-of-2015-season/story-fni5f3kt-1227289022102

In summary:
POINTS FOR: 6TH
POINTS AGAINST: 9TH
CONTESTED POSSESSIONS: 13TH
KICKING: 4TH
PRESSURE: 1ST
% GOAL INSIDE 50: 7TH
% CONCEDING OPPOSITION GOALS ONCE INSIDE 50: 12TH

According to CD, the Cats have rated highly in the pressure category under Chris Scott's coaching. They were 5th in 2011, 1st in 2012, 2nd in 2013 and 1st in 2014.
(NB. Saints ranked 6th for pressure last year, so we know how far applying pressure got them! )
Yeah but that's like saying 'a car's brakes are pretty good'. Yes they help to make a good car but doesn't mean that car can actually move.
 
Yeah but that's like saying 'a car's brakes are pretty good'. Yes they help to make a good car but doesn't mean that car can actually move.
The pressure that the Cats applied ranked them in the top few (4th? Can look for the article) for turnovers and we were one of the highest ranking teams for scoring from turnovers. You're right- it's not the size of it, it's what you do with it ;)

EDIT: It was 3rd highest turnovers as of halfway through last season.
Like last season the clearance numbers are down but they set up for the turnover. They force the third most turnovers in the competition scoring 61% of their points from this source. Coming out of defence the Cats have the third lowest kick-to-handball ratio and as per usual use the corridor more than any other team.
http://www.heraldsun.com.au/sport/a...s-your-club-fare/story-fni5ezdm-1226958698976
 
regarding turnovers- the Cats have been working hard on forcing them and defending them for years. Here's an article from early 2008, that I found very interesting:

All teams are guilty [of turning the ball over], even the super-skilled Cats. In the same game [v Melb], Gary Ablett and Cameron Ling sent the footy bouncing into the turf rather than delivering it to their team-mates.

Geelong has turned the ball over 145 times this year, behind only Collingwood with 159 turnovers and West Coast with 150.
But what divides good teams from not-so-good is what happens next. While the clanger matters, what matters more is how badly you pay for the crime.

Teams such as Geelong, Adelaide and Sydney, all with sophisticated defensive prowess, are able to stem the damage from turnovers. Geelong has allowed the opposition to score a goal just 22 times from 145 chances.

They get the ball back in their hands far more often than strugglers like Carlton, Richmond and Melbourne, whose turnovers are much more likely to result in opposition goals.

Carlton's turnovers lead to an opposition goal nearly three times out of 10. When a Sydney player gives the ball to the opposition, the team works so hard to retrieve it that only one in 10 turnovers leads to a goal.

Champion Data's mastermind Ted Hopkins delights in these statistics he dubs "crime and punishment", which show how often the opposition ends up kicking a goal from a team's turnovers, and conversely how often a team capitalises.

Champion values the statistics highly because they show both sides of a team - not only how good they are in attacking mode, but how good they are defensively.

http://www.foxsports.com.au/afl/sorry-tale-of-making-turnovers-pay/story-e6frf33l-1111116041238


NB- perhaps the high number of Geelong turnovers could be related to the amount of ball they were handling back in those days. Turnovers could possibly be better written as a percentage of disposals, which would probably bring the Cats numbers back to the field.
Yes, but you just need to think of them with even more complexity.

When the Cats were making those turnovers with a gun team, they were probably occurring moreso deep in their own forward line compared to those made by other teams.

A turnover in your own goalsquare is (probably) more preferable than a turnover in the opposition's!
lol- that makes my head spin, SJ :(
I know CD keep data on all this stuff, and the club has access to it- and it makes me grumpy to think that we don't even get a look in :(
 
lol- that makes my head spin, SJ :(
I know CD keep data on all this stuff, and the club has access to it- and it makes me grumpy to think that we don't even get a look in :(
Just think of it this way.

What turnovers have in common:
- Giving the ball to the opposition

What turnovers may not have in common:
- Where on the ground the ball is conceded
- How the opposition player receives the ball (from a mark, off the ground etc.)
- What pressure the opposition is under following gaining the intercept (uncontested, under pressure by one or more players)
- How many teammate options the opposition player has for immediate support (have nowhere to go, or have loose men everywhere)

Yeah, the big picture is very important. I can see how conceding a turnover to an opposition player might end up resulting in our own possession, if he's got a player or two right on his hammer, which makes it all the more important for our players to hunt in packs and support each other. And Geelong are quite highly ranked in tackle differential- and have been up in the top 4 for the past couple of years. Sometimes the choice for our player might be to take a contested possession but get caught with the ball or he he might choose to stand off his opponent and reverse the tables, getting a HTB decision or, at worst, maybe a stoppage.
One of the worst things would be for our opponents to receive a turnover mark from our kickout! :(
 
lol- that makes my head spin, SJ :(
I know CD keep data on all this stuff, and the club has access to it- and it makes me grumpy to think that we don't even get a look in :(
what would you like to know? I might have what you're after
Cats have always relied on turnovers as a scoring source as you don't generate them from stoppages that well and the only other way to score is via a kick in

Last year Geelong scored the 4th most points from turnovers, also had the 4th best success rate at scoring them when forcing the turnover (23.3%) Hawks #1 for this.
You were the 7th best defensively for points conceded from turnovers and 7th best success rate at stopping them.
This placed you 5th for differential, you were 10th for stoppage scoring differential.
7/8 best turnover scoring differential teams played finals (WC/Ess)

this season
Cats scored 12th most points from turnovers, 12th best success rate.
Defensively you're 9th best and 6th worst success rate
Sees you 12th for differential, you are currently 16th for stoppage scoring differential
 
Yeah, the big picture is very important. I can see how conceding a turnover to an opposition player might end up resulting in our own possession, if he's got a player or two right on his hammer, which makes it all the more important for our players to hunt in packs and support each other. And Geelong are quite highly ranked in tackle differential- and have been up in the top 4 for the past couple of years. Sometimes the choice for our player might be to take a contested possession but get caught with the ball or he he might choose to stand off his opponent and reverse the tables, getting a HTB decision or, at worst, maybe a stoppage.
One of the worst things would be for our opponents to receive a turnover mark from our kickout! :(
I believe this is the paper which was the first work in the underlying basis to AFL Player Ratings: http://www.rankingsoftware.com/research/PossessionVersusPosition.pdf

From a set shot:

upload_2015-5-13_15-3-53.png

From open play but not under immediate pressure:

upload_2015-5-13_15-4-40.png

From open play and under immediate pressure:

upload_2015-5-13_15-4-59.png

These are significantly different charts that show how many points (on average) having the ball is at a certain position on the ground, in different circumstances. As you said, turning the ball over from a kickout leading into an intercept mark is one of the worst options as practically anywhere within 25 metres of the posts is practically worth a goal to the opposition. However turning it over practically anywhere inside your own forward half with the opposition under immediate pressure is either a neutral outcome or indeed worth more to your team than the opposition.
 
Got one of those heat maps for Cloke :D
 
what would you like to know? I might have what you're after
Cats have always relied on turnovers as a scoring source as you don't generate them from stoppages that well and the only other way to score is via a kick in

Last year Geelong scored the 4th most points from turnovers, also had the 4th best success rate at scoring them when forcing the turnover (23.3%) Hawks #1 for this.
You were the 7th best defensively for points conceded from turnovers and 7th best success rate at stopping them.
This placed you 5th for differential, you were 10th for stoppage scoring differential.
7/8 best turnover scoring differential teams played finals (WC/Ess)

this season
Cats scored 12th most points from turnovers, 12th best success rate.
Defensively you're 9th best and 6th worst success rate
Sees you 12th for differential, you are currently 16th for stoppage scoring differential
Thanks twarby! I don't want NEED any stats in particular- I just love the feel of them running through my fingers, if that makes sense :) It's always good to read reports that quote Champion Data stats, which is why I started this thread, so others can share anything they find.

What you have provided is very interesting- quite disappointing to see this year's stats but then the stats will always be skewed unless we play each team once and only once. I would expect our first couple of games to have dragged our averages down.
I don't think we've been particularly good at stoppages for quite some time- we certainly are very poor at stoppage clearances, so it stands to reason that we would be poor at scoring from stoppages as well, though the last couple of weeks might have brought our average up in that area. I recall a couple of years ago how opposition teams appeared to score really easily from stoppages inside their F50- we seem to have plugged that leak slightly, with better defensive work.

It looks like our stoppages are still a major weakness- room for heaps of improvement there.

Thanks again for providing that info. Is that from the book that CD published?
 
Thanks again for providing that info. Is that from the book that CD published?
i am not sure what they publish in their book, I source a few team related stats from someone and scoring sources is one, although I am pretty sure this gets published in Mondays paper as well.
 

Remove this Banner Ad

Back
Top