


kane249
Wibble
- Oct 27, 2006
- 52,156
- 68,898
- AFL Club
- West Coast
- Other Teams
- Sth Freo, Liverpool, Chicago Bulls
Follow along with the video below to see how to install our site as a web app on your home screen.
Note: This feature may not be available in some browsers.
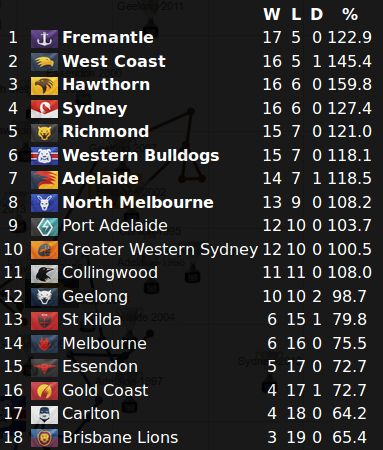
you didn't really just post that in the squiggle thread did you? Do you even have the smallest idea what this ENTIRE thread is about??Lions x 2, Blues, Dons etc - easiest draw in the comp - no wonder they are where they are.
If the squiggle is correct and Hawthorn has to come back to Perth in week 3 of the finals to play a rested Fremantle, really can't see how they would win.
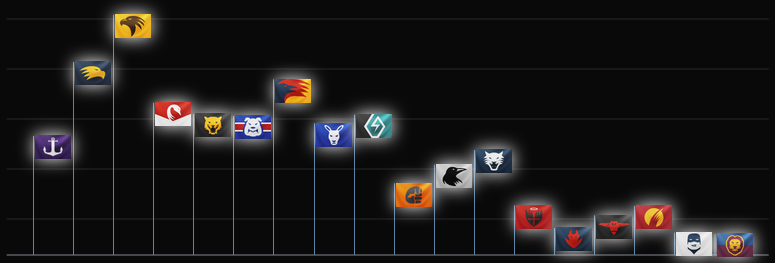
Not necessarily - as has been mentioned, if Freo win it will be a big blow to the flagpole, but if it's had success picking teams closest to a flag and Freo don't go close it looks very smart.Live flagpole needs some work. How port can be higher than fremantle at this stage is a little absurd.
Meeting down at Geelong to discuss who's going to dress up as what.The bottom six teams look like they are trying to meet up for mad Monday
Then it's useless.This has been explained before. Flagpole measures current form and doesn't really care if the team can make finals
Then it's useless.
Nonsense. This was said last year. People thought Port were a premiership favourite going into 2015 while Freo were a chance to miss finals. Instead Port missed finals.Not really. Given 'Current form' of the teams, I'd be inclined to believe that Port is closer to winning a Premiership than Freo is.
Sure Port might not actually win until 2016/17 or even later, but I personally don't see Freo winning this year (on current form).
Then with Pav/Sandi/McPharlin either gone in 2016 or at the least slowing down, Port will be a better chance to finish top 4.
Will be interesting to see the flagpole after next week (even though Ross is gonna rest up as many as he can).
Oh yeah, that number is the result of brute-force analysis of every possible combination of variables. 12 is what works best over the last 20 years.Final Siren You know how like, you automatically put +12 or whatever when a team travels. Did you do any research with this number, or did it just seem like a good easy to start with? Would be interesting to see if it should be more or less


I am thinking about having it drop down flags to zero once a team can't make the finals. That would look pretty neat. Like, TAKE THAT, PORT.Live flagpole needs some work. How port can be higher than fremantle at this stage is a little absurd.
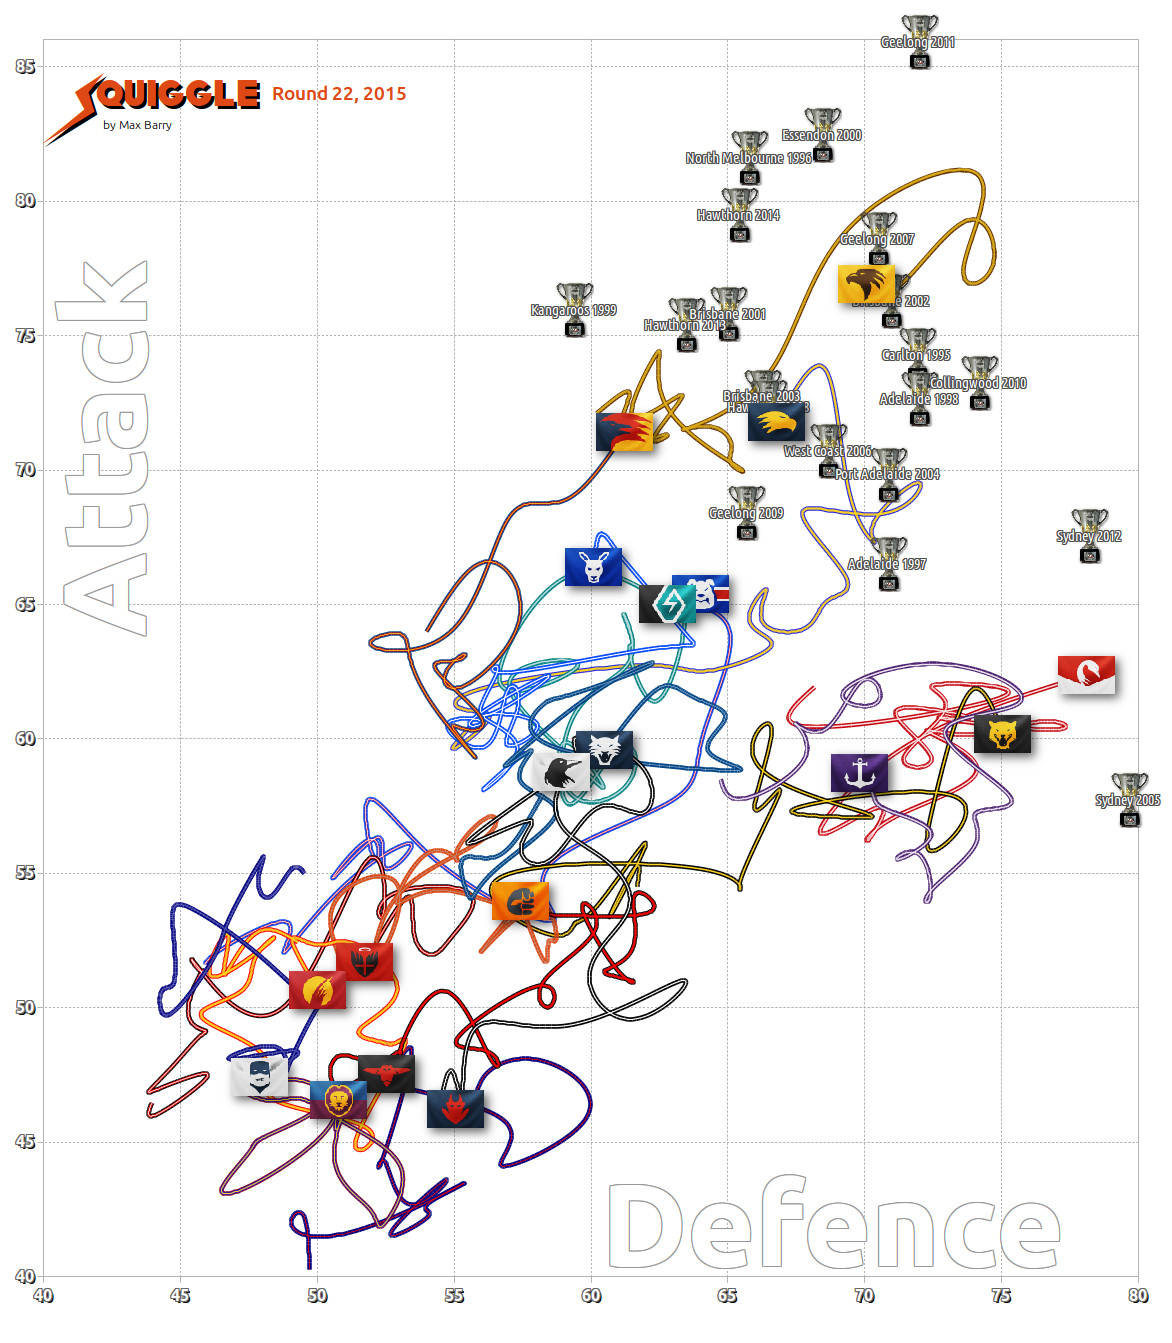
Correct! And this is highly influenced by the fact that attacking teams have won plenty of flags. If St. Kilda and Fremantle had saluted -- which you might think could easily have happened, given a little luck -- then I'd be using a different algorithm, since the current one wouldn't have done so well at predicting premiers.[...] Going from the figures, and those of the other teams, it is clear that the Flagpole depends more on attack then defence [...]
These are not statistics and probabilities. It's a number of heuristic models that change depending on their best fit for the result. Individual games are picked by standard Squiggle algorithm, the grand final is pick by its own separate algorithm than rates recent form higher, and flagpole is picked by a third unrelated one that rates scoring more favourably.Data from the Flagpole:
Attack Defence Combine
7.Fremantle 58.7 69.8 64.3
8.Port Adelaide 65.0 62.8 63.9
Going from the figures, and those of the other teams, it is clear that the Flagpole depends more on attack then defence (as shown by WC being higher than Sydney on the 'pole, despite having a lower 'combined' total).
On current form Port has a far better attack, meaning that the flagpole feels they are a better chance for a premiership.
It doesn't matter if you don't agree with statistics and probabilities, it won't change them.
These are not statistics and probabilities. It's a number of heuristic models that change depending on their best fit for the result. Individual games are picked by standard Squiggle algorithm, the grand final is pick by its own separate algorithm than rates recent form higher, and flagpole is picked by a third unrelated one that rates scoring more favourably.
The only algorithm that would make sense in terms of 'who is closest to the flag' would be one based on a Markov chain. Based on the Squiggle predictions for games, Hawthorn and West Coast are reasonable chances of not making the GF, if they didn't, would they still lead in the flag pole?
