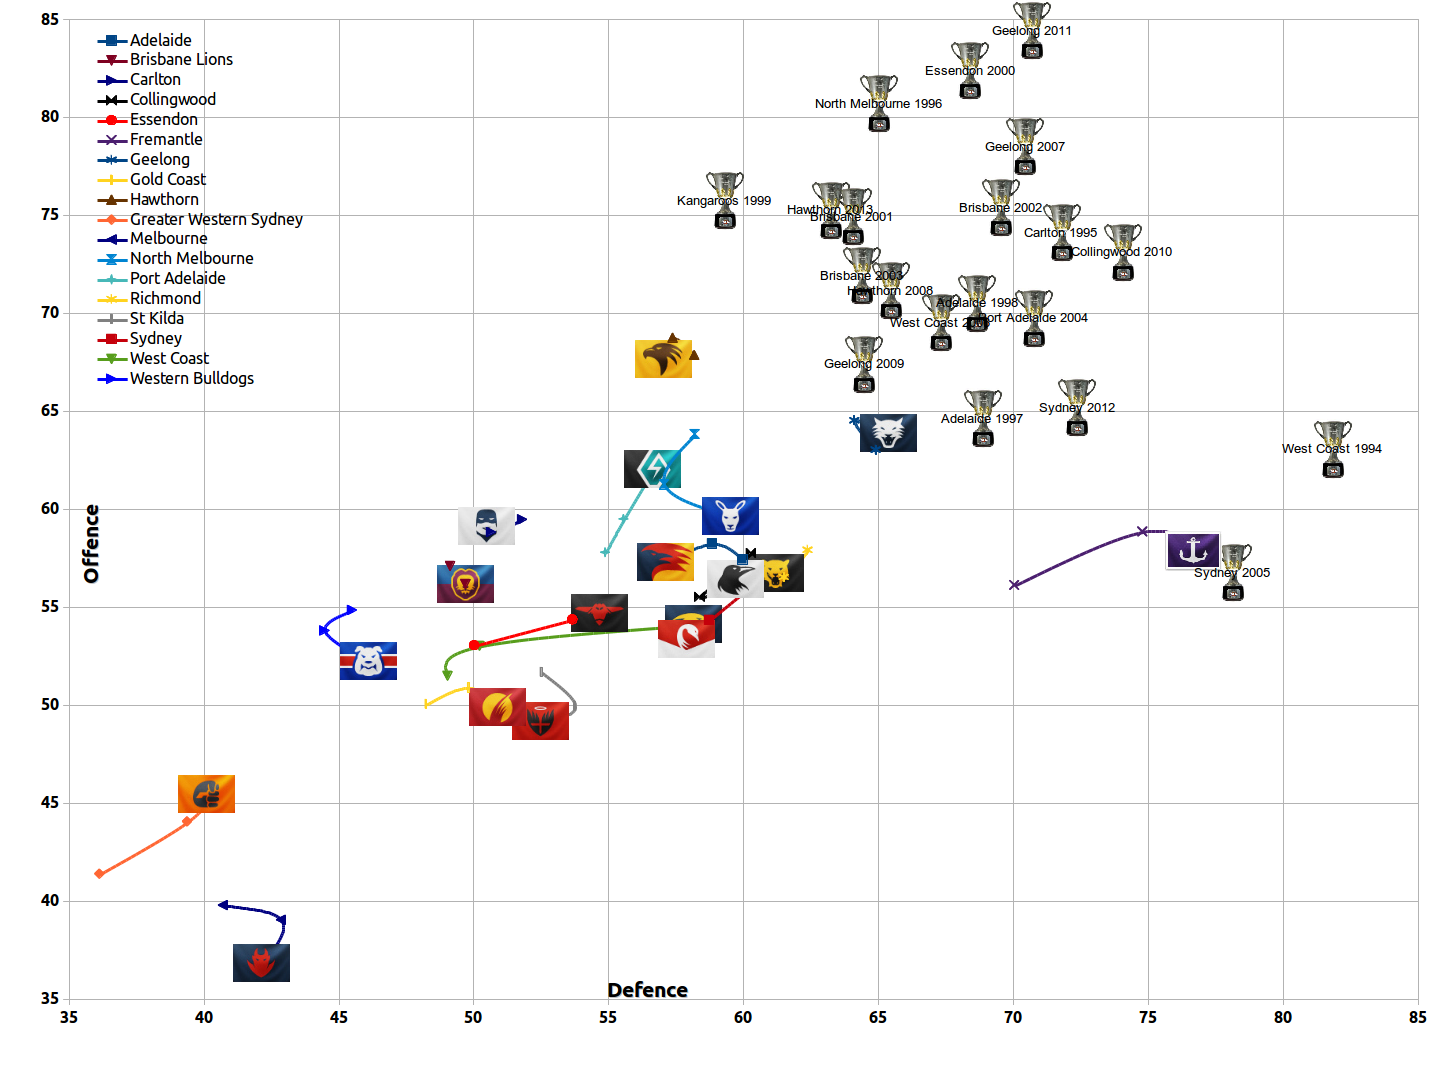
Certified Legendary Thread Race for the flag, in squiggly lines

Remove this Banner Ad

I've added a couple of features for the dynamic squiggle:
  • It gives you its tips (predicted scores) for the coming round. Note: Squiggles are visualizations, not bookie-beaters.
  • It will (should) auto-update after matches, so you don't have to wait for me to get around to it.
It's still a little buggy at the moment when you add and remove teams and jump forward and backwards in time... sometimes you need to reload it to get it working properly again. I will fix 'em up sooner or later.

GWS surging

Btw, love, love this stuff. As a statistician and economist, this was how I found my way to the BF website...
So good stuff!
Awesome, thanks! How did you find it, may I ask?

Is there anyway you can do a "from xx to yy" squiggle on your site?

Eg, run the scenario across multiple seasons for one or multiple clubs?
Hmm, not sure I follow. You mean track a club across multiple years on a single chart? If so, that is probably not possible.
 
I've added a couple of features for the dynamic squiggle:
  • It gives you its tips (predicted scores) for the coming round. Note: Squiggles are visualizations, not bookie-beaters.
  • It will (should) auto-update after matches, so you don't have to wait for me to get around to it.
It's still a little buggy at the moment when you add and remove teams and jump forward and backwards in time... sometimes you need to reload it to get it working properly again. I will fix 'em up sooner or later.

Hey mate, could you please explain how to do this in a little more detail? I quite liked looking at the projected tips last year, so it would be nice to play around with them when I'm laying my bets.

I just tried it and couldn't figure it out but I'm at work atm, running some ancient version of IE, so that may have something to do with it.
 

Log in to remove this ad.

Just a request, would it be possible to include the most recent 2014 squiggle chart in the opening post? Just for the sake of clarity and ease of use.
And yes I'm aware an external link has been provided in the opening post to the updated charts.
 
Hmm, not sure I follow. You mean track a club across multiple years on a single chart? If so, that is probably not possible.

Pretty much. Would love to see the pattern of (for example) Lions 98-04, Cats 06-** (still bloody going), Hawks 07-** etc.

Clubs start the next year where they finished the prior year, and then build from there.

You have the raw data there (end of season plot points), which could then be ranked in ascending years, showing clubs development and regression over time, with each year represented by just one point.

More than happy to play with the data if you'd consider releasing it.
 
Just a request, would it be possible to include the most recent 2014 squiggle chart in the opening post? Just for the sake of clarity and ease of use.
And yes I'm aware an external link has been provided in the opening post to the updated charts.
I edited the OP to add a link to where 2014 starts in this thread.
 
Looking at the years historically, 1989 is an insane year, geelong was all over the place.
A possible criticism of the Squiggle is they look very favourably on thrashings of weak teams, especially when kept to a tiny score. When this happens, you sometimes see a team rocket off to the right, before inevitably sliding back over the next few weeks.

I have looked at correcting for this many times, but the correction always comes out worse, from a predictive point of view. For example, right before I first posted this thread in 2013, North Melbourne had beaten Melbourne 150 to 28. As a result, they flew rightwards in the squiggle, to the point where the Squiggle expected them to beat Geelong (in Melbourne) that week. And I thought, RIGHT, that's ridiculous, I am definitely fixing that. So I put in a cap, recalculated the charts, and posted.

Well of course North then got up to beat Geelong 96-86.

So no more caps. And the dynamic squiggle has never used them, which is why you can see a small difference in the path of the Roos in 2013 around Round 18-19.

Received wisdom is that tight wins over quality opposition are more important than beating a weak team by 20 goals instead of 10, but I've never found any statistical basis for that. On the contrary, it seems that being able to deliver a monumental belting to weak opposition is a good indicator of strength.
 
[quote. Awesome, thanks! How did you find it, may I ask?
.[/quote]

Last year I was doing google searches for random stuff like afl footy data charts stats etc, and it was down the list in the results pages. I just tried to replicate it now in google and typed in 'bigfooty data chart' and it came up. I don't remember putting 'bigfooty' in, by maybe I eventually did after seeing some of the results and the site coming up...
 
Hawthorn, Geelong and Freo already on the premiership diagonal


Sent from my iPhone using Tapatalk

Makes sense. All three got pretty close to a premiership last year, and one of them got one. All three won their first round games pretty comfortably.

See how it looks in a couple of months time I reckon.
 

(Log in to remove this ad.)

Looking back at some of the graphs, and some of the has beens, the 2011 grand final was such an amazing clash of gamestyles. Collingwood 11 was one of the best ranked defensive sides, Geelong way up on top in terms of attack. Truly, that Geelong team was one of the best sides we've ever seen, though, their run home at the end of the year, including that complete belting of us last round was just incredible. There are some sides that you just can't contain with defence alone, in hindsight we probably were too focused on our press and not focused enough on the transition between defence and attack. Although obviously there were other factors at play, we did fade badly towards the end of the year while Geelong just seemed to get better and better. No shame in losing to this team, just bad luck that we seem to knock into these absolute powerhouse teams in Grand Finals.
 
Looking back at some of the graphs, and some of the has beens, the 2011 grand final was such an amazing clash of gamestyles. Collingwood 11 was one of the best ranked defensive sides, Geelong way up on top in terms of attack. Truly, that Geelong team was one of the best sides we've ever seen, though, their run home at the end of the year, including that complete belting of us last round was just incredible. There are some sides that you just can't contain with defence alone, in hindsight we probably were too focused on our press and not focused enough on the transition between defence and attack. Although obviously there were other factors at play, we did fade badly towards the end of the year while Geelong just seemed to get better and better. No shame in losing to this team, just bad luck that we seem to knock into these absolute powerhouse teams in Grand Finals.
Didn't Collingwood ONLY lose to Geelong that year? Twice in H&A and then the GF?
 
Adelaide to pip in the showdown - interesting tip. Otherwise in agreeance (though Saints margin is surprising).

Lies, damned lies and statistics...
 
Round 2
dFlC7rN.png

Play with squiggles

The auto-update thing isn't working, sorry... found a few bugs and it will be a week or two before I can fix 'em.

Adelaide to pip in the showdown - interesting tip. Otherwise in agreeance (though Saints margin is surprising).
A key question here is how quickly you accept new evidence that a team has significantly improved (or gone backwards). The Squiggle is probably more conservative than most punters, taking quite a lot to be convinced that a team is a lot better or worse than before. This has proved most accurate over the last couple of decades, but only as a blanket rule: there will be plenty of exceptions.

GWS 2013 was worse than Fitzroy 1996, at least in Squiggle terms, so it's going to take a little convincing before it starts really rating them. Similarly, the squiggle has a fairly dim view of Essendon due to their poor 2013 finish, whereas most human punters probably realize that early-season Essendon and late-season Essendon are two different teams.

The games it tips to be really close... well, what you can mostly take from that is that the Squiggle expects them to be really close. Bear in mind its only inputs are scores and venue. If you're tipping, you have access to a lot more information than that, like the record between the two teams, who's in and out, etc. So while you might find the Squiggle useful as a kind of general rule, particularly if you don't know much about the two teams, it will not out-tip an informed and observant human being.
 

Remove this Banner Ad

Back
Top