Hmm! Well one way of rating it would be to consider how much better the dynastic team was over their three seasons of dominance than their leading challengers.
This means we rate teams that spent the whole year looking like champions, rather than teams that only peaked at the end.
We probably don't want to compare them to the season average, since that gets skewed by particularly bad teams (and 2013 had two terrible ones). So let's compare the eventual premier to the other seven finalists. That's still subject to skewing by years with unusually poor/strong finalists, but not as badly, and you have to draw the line somewhere.
We'll also smoosh Geelong's three premiership years together as if they were a three-peat. This either gives the Cats too much credit, since they couldn't pull that off in reality, or undersells them, since their dynasty was actually over a longer period, whichever way you want to look at it.
This gives us:
#1 Brisbane 2002
15.3% better than opposition finalists over the course of the year, with only Port (midyear) and Collingwood (late) providing any sort of challenge.
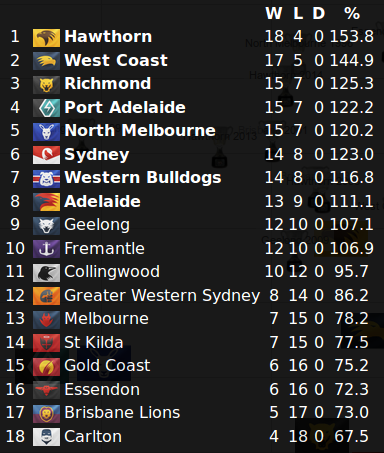
#2 Hawthorn 2015
13.3% better. Never headed but a year with a particularly strong top 8.
#3 Geelong 2011
9.7% better. Played second fiddle to Collingwood for most of the year, but still a lot better than the average finalist.
#4 Hawthorn 2014
9.3% better. Spent the whole year either at #1 or very close to it, but with credible competition from Sydney, Fremantle, and Port.
#5 Brisbane 2003
9.1% better. Always threatening, but never got too far away from Port and Collingwood.
#6 Geelong 2007
9.1% better. Started the year a long way back before going a long way ahead. A season that is done a disservice by averages.
#7 Geelong 2009
8.5% better. Consistently threatening all year, but often behind St Kilda, with late challenges from the Bulldogs and Adelaide.
#8 Hawthorn 2013
8.0% better. One of four strong challengers with Sydney, Geelong, and Fremantle.
#9 Brisbane 2001
4.2% better. Trailed Essendon for almost the whole year and really only got going mid-season.
If you average the three years:
10.2% Hawthorn
9.5% Brisbane
9.1% Geelong
This of course is just according to the particular criteria I've invented here. "Best dynasty" is subjective, so no-one will agree on what it means.
So...
Hawthorn 》 Brisbane 》 Geelong
Didnt even need to play the 2008 card
")