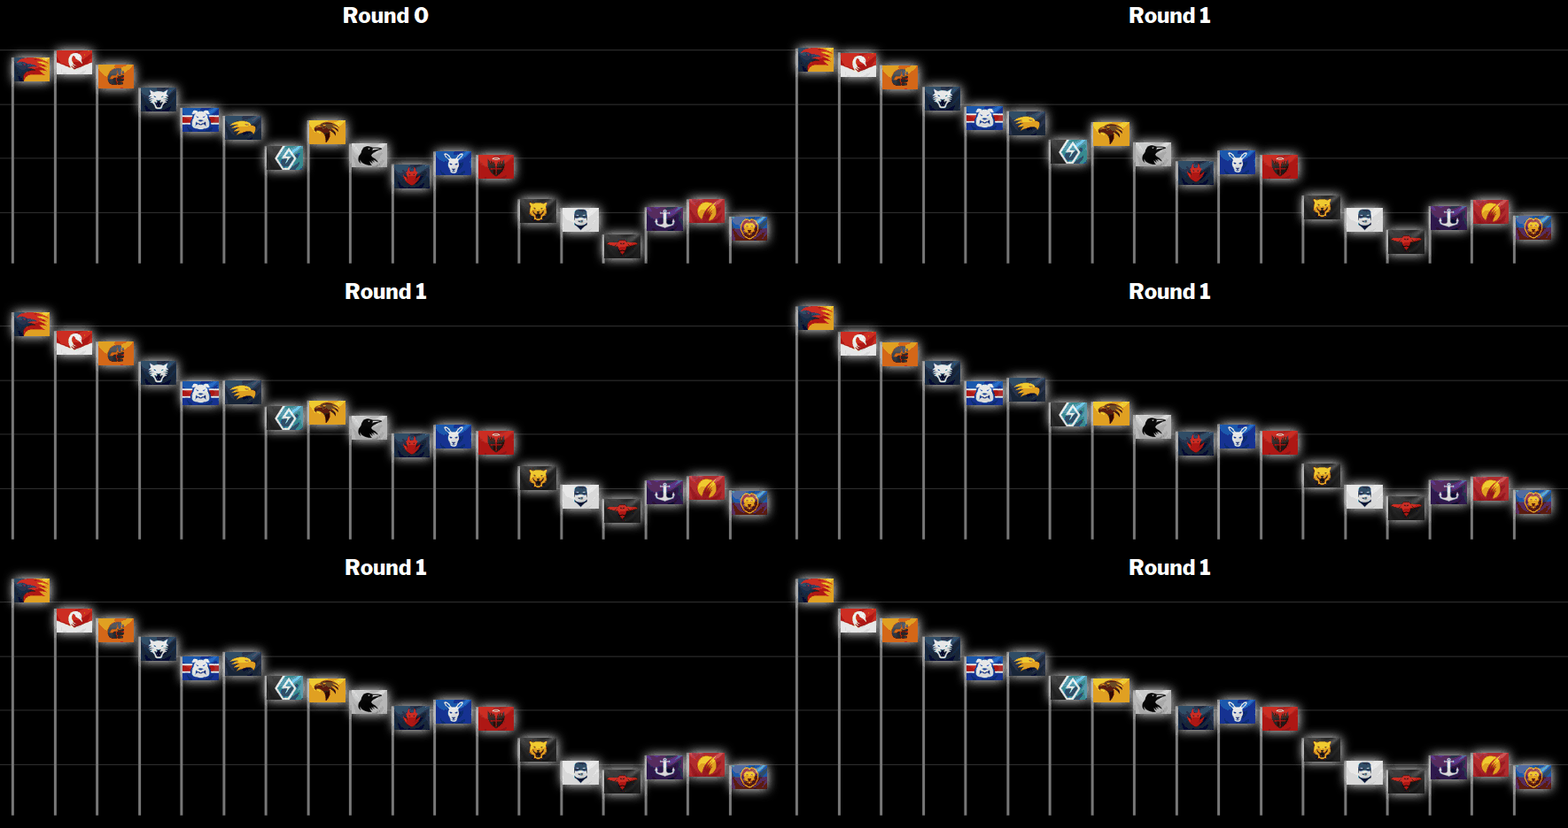
Certified Legendary Thread Squiggle 2017

Remove this Banner Ad

Freo fans were dissing the squiggle for the same reason when they were good.

I'm not actually dismissing the squiggle, in fact, I've defended the squiggle in the past against doubters. Final siren and roby insisted that sides like Hawthorn would beat sides like Fremantle, and I bought it. Turned out they were right (admittedly roby's prediction skills can get spotty at times).

The reason why Fremantle fans didn't believe is that they really hoped their gameplan would stack up despite all evidence. My criticism with final siren isn't with his model, it's with his usage of the term "gameplan" as I said before, it's not completely true that a side which scores less scores less because of a defensive mindset. Final siren acknowledged this in his response in saying that what unites Fremantle and Richmond is a lack of scoring, which means they have to attack perfectly to win, which they don't anyway. That is true but that's not a facet of gameplan.

As I remarked earlier, I completely accept Richmond's attacking woes will hurt them, it's why I agree with the squiggle that Richmond has a chance against the giants but can't beat the crows, a fear I've voiced in this thread before.

But but but we ease up when we are in front which is why we don't score as much'

I don't think I've ever said that, in fact I'd say the reason why Richmond doesn't win games by much is because it doesn't score much because it doesn't have a great forwardline. Pressure aside Richmond would score more with a decent second tall.

Squiggle will prove itself right when it matters to you most.

I've already bought into the squiggle.
 
Looking at the trajectory of the Squiggle, Richmond have the most pronounced positive movement in the run home, whereas every other club jitters around.
I guess the fact that we are coming home with a wet sail gives a lot of Richmond supporters some optimism.

Interestingly if we win by the 20 or so points Squiggle is predicting this week, we will be plotted somewhere very close to the Bulldog's cup on the Squiggle chart.
 
Yes, I do use the word "defensive" loosely, just to mean any team that tends to generate low-scoring matches.

What I think they all have in common, though, is that if the opposition manages to break through the wall, even for a short period, it can be all over. To be successful, they need to shut down every single avenue to goal, and keep that up for the entire game. Even then, they won't usually get more than a few goals in front, so they're never quite out of danger. While for a high-scoring team, there's not quite so much dependence on Plan A. If things partly go right, a defensive (low-scoring) team can be in real trouble, while an attacking team is probably fine.

Both are important, of course, and both depend on what players do in every position on the ground. But I suspect that one reason defensive teams have disproportionately failed in flag campaigns is that they need everything to go right and stay right, and sooner or later it doesn't.

Oh sure, and that makes complete sense. Premiership winning sides generally try and create as many goal-scoring opportunities as possible and then back in their defence when it comes to defending. It's a game of probabilities in some respects and Adelaide are just buying more lottery tickets than others. In a game where both teams will score, it's difficult to freeze a team out, unlike say soccer. It's certainly true that it's better to have good defensive efforts when required than a defensive gameplan. And that's true of Adelaide, who rarely cough up big scores against them, not because they shut things down, but because they attack themselves, generate scoreboard pressure, and defend well when they need to.
 

Log in to remove this ad.

When we look to explain why the squiggle shows certain things such as higher scoring teams winning flags over stingier teams, I think we also need to consider more subjective things. For example, typical Ross Lyon teams have had low risk, highly defensive game plans, whereas sides such as the Bulldogs last year and us this year have had attacking game plans (with the ball anyway) with plenty of risk taking, but lacked the forward line to score heavily. When I find some time I might try find some similar teams from history and see how they end up, as clearly a sample size of 1 isn't enough.
 
I guess the fact that we are coming home with a wet sail gives a lot of Richmond supporters some optimism.

Interestingly if we win by the 20 or so points Squiggle is predicting this week, we will be plotted somewhere very close to the Bulldog's cup on the Squiggle chart.
I wonder whether Final Siren has any data on Squiggle "velocity" in finals. Do the teams that move strongly just before and during finals carry that momentum through to ultimate victory more than those who don't?
 
I wonder whether Final Siren has any data on Squiggle "velocity" in finals. Do the teams that move strongly just before and during finals carry that momentum through to ultimate victory more than those who don't?
Might have to look at that - movement in week n vs movement in week n+1
 
I wonder whether Final Siren has any data on Squiggle "velocity" in finals. Do the teams that move strongly just before and during finals carry that momentum through to ultimate victory more than those who don't?

I suspect that it's the opposite - teams beat an also-ran in the first week by 12 goals, shoot forward on the squiggle, and get drilled by a genuine top four team. Or a losing top-four team beats a pretender in the semi-final by ten goals, gets talked up for the prelim, but over 80% of qualifying final winners go through to the grand final, no matter how good their opponent looked during their week off.
 
I suspect that it's the opposite - teams beat an also-ran in the first week by 12 goals, shoot forward on the squiggle, and get drilled by a genuine top four team. Or a losing top-four team beats a pretender in the semi-final by ten goals, gets talked up for the prelim, but over 80% of qualifying final winners go through to the grand final, no matter how good their opponent looked during their week off.
I'm talking about slightly longer term trends than week-to-week, instead trajectories over 2-4 weeks. Let's call it Hawthorn 2008 / Bulldogs 2014 momentum
 
Because Richmond is in an area of the chart where good teams go to not win premierships.

Over the last twenty years, only three teams have done it from there: Bulldogs 2016, Sydney 2012 and Sydney 2005. All were upsets. Two were huge upsets, part of a series of other upsets.

Meanwhile, it's been a graveyard for otherwise strong teams who failed to go all the way: Sydney 2016, Sydney 2015, Richmond 2015, Fremantle 2015, Sydney 2014, Fremantle 2014, Fremantle 2013, Sydney 2013, Fremantle 2012, St Kilda 2011, St Kilda 2010, Adelaide 2010, St Kilda 2009, Adelaide 2009, Sydney 2006, Adelaide 2006, Adelaide 2005, Sydney 2004, Geelong 2004, and Carlton 2001. I suppose I should add Sydney 2017 now, too.

Flagpole is different to the regular squiggle algorithm because it's slanted to favour teams that look like past premiership winners, and not like teams that win games but not flags. That basically means it prefers teams with a strong attack, and dislikes teams that look like they're being coached by Ross Lyon.

This is all done without any special reasoning; i.e. squiggle offers no theory on why, exactly, defensive specialist teams have done poorly in finals after successful regular-season campaigns. It just notes that they have, and expects the trend to continue. The landscape today may look very different if St Kilda had snagged a couple of flags in 2009 and 2010 and if Fremantle had managed it in 2013. But they didn't, so this is the historical reality, which Richmond need to overcome.

That many data points pretty much means that this isn't just a dodgy correlation. I reckon the explanation FS gave for this is solid. But to me this one of the great strengths of a data driven approach, where you don't try to fit the data to some explanation. The data say that teams that look on paper of equal strength, when they hit the GF, the attacking team wins more often.
I reckon this is partly a selection thing as well. Teams that reach the GF are very talented in all ways, and in form. So the pure attack teams have been sorted out, because really good teams restrict their attack and destroy their inability to defend. Whoever is left by the GF is damn good defensively anyway. So a defensive specialist has to totally crush it, whereas the attacking team has more space to perform.

Obviously the most effective tactic is to stop the opposition scoring, whilst scoring yourself. But by the GF it's unlikely that you can shut down a really good attacking team.

Has anyone looked at whether this attacking bias is 'real' in the regular season? I'd suspect it is much weaker, and that it is finals where the teams unable to deal with great defense are out that this bias shows up.
 

(Log in to remove this ad.)

Adelaide the only team in the zone

If a team beats Adelaide by a few goals and wins their other final by a few goals, they'll finish in the zone.

Final Siren what's the probability of the premier coming out of PF1 and thus PF2? You said Adelaide was a 0.56 shot but I was just kind of wondering who would be most likely of the other 3 that for Adelaide lost the prelim.
 
Squiggle doesn't have 'heart', 'momentum' or 'emotion' metrics. Don't underestimate those things.

One of the great findings of squiggle is that humans actually tend to OVERESTIMATE these things.
 
As I remarked earlier, I completely accept Richmond's attacking woes will hurt them, it's why I agree with the squiggle that Richmond has a chance against the giants but can't beat the crows, a fear I've voiced in this thread before.
There's plenty of room between "less likely" and "can't."

Making the finals from 3-10, now that was unlikely.
 
If a team beats Adelaide by a few goals and wins their other final by a few goals, they'll finish in the zone.

Final Siren what's the probability of the premier coming out of PF1 and thus PF2? You said Adelaide was a 0.56 shot but I was just kind of wondering who would be most likely of the other 3 that for Adelaide lost the prelim.
Whoever wins PF1 will start squiggle favourite against whoever wins PF2.

The GF likelihoods from here are:
  1. Adelaide def Richmond: 41%
  2. Adelaide def GWS: 14%
  3. Geelong def Richmond: 14%
  4. Richmond def Adelaide: 10%
  5. Richmond def Geelong: 7%
  6. GWS def Adelaide: 5%
  7. Geelong def GWS: 5%
  8. GWS def Geelong: 4%
That's a 55% chance of an Adelaide flag, 19% Geelong, 17% Richmond, 9% GWS.

Or put another way, there's a 74% chance of the premier coming from PF1, 26% from PF2.

Obviously these change hugely depending on who gets through. For example, most of the reason a GEE def GWS or GWS def GEE flag is unlikely is the relatively small chance that both teams win their prelims. And Richmond have a better chance against the Cats than the Crows, but they're more likely to face the latter.
 
Squiggle doesn't have 'heart', 'momentum' or 'emotion' metrics. Don't underestimate those things.
Im talking about Squiggle momentum.

Sometimes upsets happen. Why do they happen?

Did Hawthorn beat Geelong in 2008 because they had better finals form?

Was it the same for the Dogs, who beat two top four teams to reach the GF, against Sydney who were 1-1?
 
Where would the Squiggle finish? Now, or after the Grand Final? Because if it's a low scoring match in the Grand Final, isn't there a possibility that Crows could still get out of the Premiership zone?

but whoever wins it puts a cup on the squiggle, and therefore that cup is either in the current 'premiership zone' or it expands the 'premiership zone'.
 
Look at how far we've come together squiggle
9hexWV1.png

fPSO1Fp.gif
 

Remove this Banner Ad

Back
Top