


Which hasn’t really been replicated. Seems like an outlier to me. Don’t get me wrong, great defence, but that singular result says that they are miles in front of everyone in terms of defence, and that just isn’t the case.Holding any team to less than 3 goals will have you smash any Squiggle prediction.
Thus the huge defense gain.
Navigation
Install the app
How to install the app on iOS
Follow along with the video below to see how to install our site as a web app on your home screen.
Note: This feature may not be available in some browsers.
More options
You are using an out of date browser. It may not display this or other websites correctly.
You should upgrade or use an alternative browser.
You should upgrade or use an alternative browser.
Certified Legendary Thread The Squiggle is back in 2023 (and other analytics)
- Thread starter Final Siren
- Start date
- Tagged users None
Forward Press
Hall of Famer
Which hasn’t really been replicated. Seems like an outlier to me. Don’t get me wrong, great defence, but that singular result says that they are miles in front of everyone in terms of defence, and that just isn’t the case.
A team scoring 17 points is indeed a massive outlier but it is what it is. Squiggle can't exactly ignore it. If Final Siren started tweaking things because he thinks the results aren't right (coughrobyspowerrankingscough) then it becomes a meaningless model.
I agree, but people shoul look at it for what it was, 2 months after the event an it is giving a somewhat false indication of where they actually are imo.A team scoring 17 points is indeed a massive outlier but it is what it is. Squiggle can't exactly ignore it. If Final Siren started tweaking things because he thinks the results aren't right (coughrobyspowerrankingscough) then it becomes a meaningless model.
Forward Press
Hall of Famer
I agree, but people shoul look at it for what it was, 2 months after the event an it is giving a somewhat false indication of where they actually are imo.
I think as long as you understand that a model can only be as good as the factors it accounts for then it's fine. It's not an infallible oracle, just an interesting way of looking at things.
melbournedemons
Senior List
A team scoring 17 points is indeed a massive outlier but it is what it is. Squiggle can't exactly ignore it. If Final Siren started tweaking things because he thinks the results aren't right (coughrobyspowerrankingscough) then it becomes a meaningless model.
Fair point. Take it at face value I guess
- Jun 22, 2014
- 11,094
- 9,563
- AFL Club
- North Melbourne
Thanks for getting back to me man. Appreciate itAs of this year, it uses a "familiarity" algorithm that assigns home ground advantage based on how often the team has played at this venue and in this state in recent years.
That's a small upgrade on Squiggle v1, which used a simple 12-pt bonus for home games against interstate opposition.
It doesn't attempt to figure out which teams play which grounds better, so for example doesn't give Sydney any special bonus for playing at Kardinia, despite their positive track record there. Some models do that, but I've never found it very reliable.
This week there are five games with HGA of 10-12 points, with the Saints getting only 8 points vs Sydney due to the Swans playing at Docklands a bit, and Melbourne v Collingwood at the G is basically neutral.
There's two parts to thisWhich hasn’t really been replicated. Seems like an outlier to me. Don’t get me wrong, great defence, but that singular result says that they are miles in front of everyone in terms of defence, and that just isn’t the case.
1) How did that cause such a large movement?
For (arguably) a bottom 4 side, Brisbane are a decent offensive team. They are currently ranked 12th by the squiggle on attack, which is the same as they were before that R4 game. That's why the movement was so large.
2) How are we still there?
We do not have a defensive rating that Squiggle would predict to hold Brisbane to 17 points
Assuming the following ratings (based on the squiggle's current position)
Rich Def: 72.9
Bris Att: 51.1
Ground adjustment/HGA (a bit of a guesstimate): -5
Brisbane's predicted score against Richmond at the MCG is 56 points, which is far more believable
That's why we've been able to maintain our position, since it's not exactly that ridiculous. That's the key here. After that game happened I thought we'd slowly regress, but we seem to be maintaining it pretty well.
FWIW, by my calculations the hypothetical defence that holds an attack rated at 51.1 to 23 points (noting 2.5 is viewed by squiggle 2.0 as 23), is rated at 154.8. We've got improvement to go

Gydafud
Premium Platinum
Geelong scored more than predicted, conceded less than predicted, but the Roos moved ahead of them on the flagpole?
- Aug 18, 2009
- 4,229
- 17,495
- AFL Club
- Richmond
- Thread starter
- #610
If it were an outlier, Richmond would have fallen back from that position since then. Instead they've improved their defensive rating by restricting Melbourne to 8.8, Essendon to 6.7, Fremantle to 4.9, and the Roos to 11.6.Which hasn’t really been replicated. Seems like an outlier to me. Don’t get me wrong, great defence, but that singular result says that they are miles in front of everyone in terms of defence, and that just isn’t the case.
No doubt the Brisbane game has helped their current chart position a lot, since Squiggle is reactive to extreme results. But that's because it's usually indicative. People are always saying Squiggle overreacts when someone beats up on a bad team, because humans rate it much more when you beat a good team in a close match, but it really does usually mean we're looking at a flag contender. Hawks 2014 are a good example. (Port 2017 a counter-example.)
Last edited:
- Aug 18, 2009
- 4,229
- 17,495
- AFL Club
- Richmond
- Thread starter
- #611
Oh wow, that's an interesting one. It's because of other results. I'll have to look into it in more detail, but even though the Roos' rating slid in losing to the Cats by more than expected, their run home is expected to be easier, while the opposite happened to the Cats. I would guess that the Roos' future fixture includes teams that got belted this weekend while the Cats have yet to face the belters.Geelong scored more than predicted, conceded less than predicted, but the Roos moved ahead of them on the flagpole?
I feel like the squiggle knows us so well. It tried a few minor adjustments to our position in the first 6 rounds and then just said "nah...they were pretty right where they were". And so here we are.
Sydney are the "Squiggle stay-at-homes".
Sydney are the "Squiggle stay-at-homes".
Hey Final Siren, what's going on with the tips?
The tipping summary for all the models shows the Squiggle tipping Adelaide by 3, but the Squiggle tips page shows it tipping Freo by 1. Also, the models leaderboard shows squiggle scoring 3/7, but the squiggle tips page shows 5/7 right.
(I'm guessing the squiggle tips page is updated based on current results, even after the games is played?)
- Aug 18, 2009
- 4,229
- 17,495
- AFL Club
- Richmond
- Thread starter
- #614
I changed the model on the weekend -- will write it up later, but basically it now knows who's playing for each team and can modify tips based on team selections..Hey Final Siren, what's going on with the tips?
The tipping summary for all the models shows the Squiggle tipping Adelaide by 3, but the Squiggle tips page shows it tipping Freo by 1. Also, the models leaderboard shows squiggle scoring 3/7, but the squiggle tips page shows 5/7 right.
(I'm guessing the squiggle tips page is updated based on current results, even after the games is played?)
It just so happened that this caused two tips to change, because there were a few really close ones. You can see the difference it made under each tip: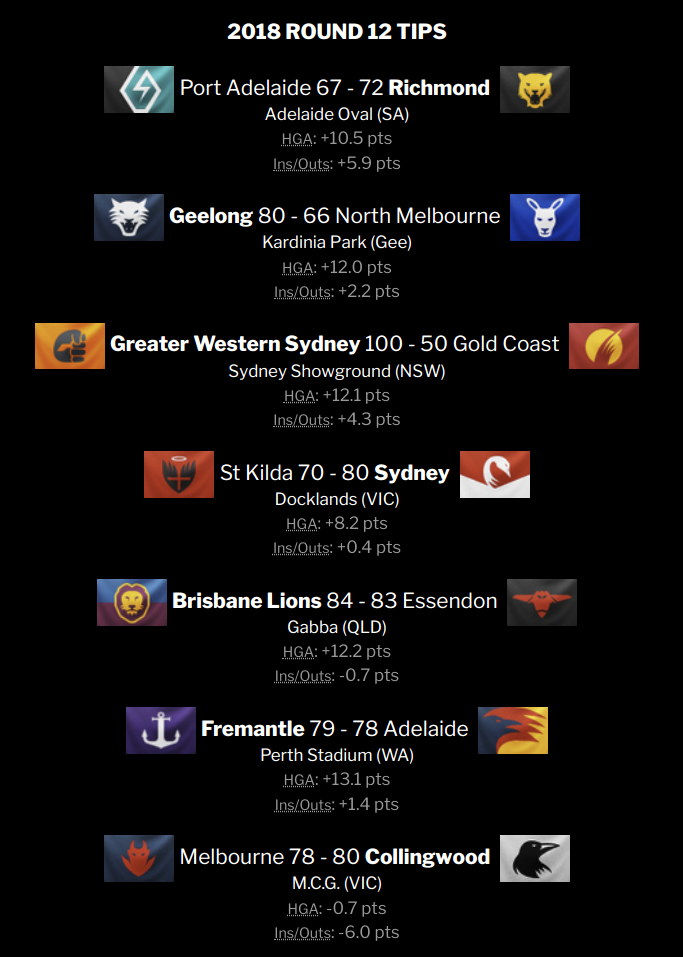
But I didn't get the new model up on live.squiggle.com.au until yesterday, so these tips don't count on the main Squiggle models leaderboard.
It seems that Ins/Outs awareness makes for a small improvement in model accuracy. Getting +2 right this weekend and 6/7 tips moving in the more accurate direction was a much more dramatic difference than I expect over the long term.
- Moderator
- #615
Amazing work!
- Aug 18, 2009
- 4,229
- 17,495
- AFL Club
- Richmond
- Thread starter
- #616
The new algorithm seems to be successfully installed, so from this round it'll be tips from SQUIGGLE4!
There's a little detail here. The only real difference is the new factoring-in of team selections. Although I did also take the opportunity to tone down the scoring shot weightings, so instead of weighting goals at 4 points and behinds at 3, it values goals at 4.3 pts and behinds at 2.7.
I don't expect too much difference over the long-term. The new algorithm seems to get about half a point closer to predicted margins on average over the last six years, which is significant, but not amazingly so.
It has made a big difference in 2018, though, since SQUIGGLE2 has been on the wrong end of several close ones, where SQUIGGLE4 would have leaned the other way.
The "TIPS" section at live.squiggle.com.au shows SQUIGGLE4 tips, so if you want to see the Historical tips for SQUIGGLE2 pre-Round 13, you need to use the models leaderboard or the Squiggle API.
There's a little detail here. The only real difference is the new factoring-in of team selections. Although I did also take the opportunity to tone down the scoring shot weightings, so instead of weighting goals at 4 points and behinds at 3, it values goals at 4.3 pts and behinds at 2.7.
I don't expect too much difference over the long-term. The new algorithm seems to get about half a point closer to predicted margins on average over the last six years, which is significant, but not amazingly so.
It has made a big difference in 2018, though, since SQUIGGLE2 has been on the wrong end of several close ones, where SQUIGGLE4 would have leaned the other way.
Code:
                                              MAE         MedAE          Bits        ComMAE
  1. SQUIGGLE4   76 -  29  72.38%  6.51/9   27.97 (  1)*  22.40 (  1)*  18.94 (  1)*  38.33 (  2)
  2. SQUIGGLE2   71 -  34  67.62%  6.09/9   28.66 (  2)   24.89 (  2)   18.84 (  2)   37.67 (  1)* <--
The "TIPS" section at live.squiggle.com.au shows SQUIGGLE4 tips, so if you want to see the Historical tips for SQUIGGLE2 pre-Round 13, you need to use the models leaderboard or the Squiggle API.
That makes my quick estimations a lot more difficult, thanks.The new algorithm seems to be successfully installed, so from this round it'll be tips from SQUIGGLE4!
There's a little detail here. The only real difference is the new factoring-in of team selections. Although I did also take the opportunity to tone down the scoring shot weightings, so instead of weighting goals at 4 points and behinds at 3, it values goals at 4.3 pts and behinds at 2.7.
I don't expect too much difference over the long-term. The new algorithm seems to get about half a point closer to predicted margins on average over the last six years, which is significant, but not amazingly so.
It has made a big difference in 2018, though, since SQUIGGLE2 has been on the wrong end of several close ones, where SQUIGGLE4 would have leaned the other way.
Code:MAE MedAE Bits ComMAE 1. SQUIGGLE4 76 - 29 72.38% 6.51/9 27.97 ( 1)* 22.40 ( 1)* 18.94 ( 1)* 38.33 ( 2) 2. SQUIGGLE2 71 - 34 67.62% 6.09/9 28.66 ( 2) 24.89 ( 2) 18.84 ( 2) 37.67 ( 1)* <--
The "TIPS" section at live.squiggle.com.au shows SQUIGGLE4 tips, so if you want to see the Historical tips for SQUIGGLE2 pre-Round 13, you need to use the models leaderboard or the Squiggle API.
Port Adelaide v Richmond +15
Geelong v North Melbourne +3
GWS +28 v Gold Coast
St Kilda v Sydney +18
Brisbane v Essendon +1
Fremantle +2 v Adelaide
Melbourne +18 v Collingwood
1. Richmond 24.9
2. Geelong 24.5 (+3)
3. Melbourne 22.0 (-1)
4. Collingwood 21.5 (+2)
5. West Coast 20.7 (-2)
6. Sydney 18.8 (+1)
7. North Melbourne 15.2 (-3)
8. Port Adelaide 11.6
9. Hawthorn 2.3
10. Essendon 0.4 (+1)
11. GWS -0.9 (+1)
12. Adelaide -4.3 (-2)
13. Fremantle -12.9 (+2)
14. Brisbane -13.6 (-1)
15. St Kilda -18.4 (-1)
16. Carlton -18.6 (+1)
17. Western Bulldogs -20.8 (-1)
18. Gold Coast -34.9
Port Adelaide +38 v Western Bulldogs
Sydney +7 v West Coast
Carlton +3 v Fremantle
Gold Coast v St Kilda +10
Hawthorn +13 v Adelaide
Geelong v Richmond +1
And the predictive ladder
1. West Coast 17.1 (+1)
2. Richmond 16.4 (-1)
3. Geelong 15.5 (+3)
4. Melbourne 15.4 (-1)
5. Sydney 15.1
6. Collingwood 15.0 (+2)
7. Port Adelaide 14.2
8. North Melbourne 14.1 (-4)
9. Hawthorn 12.6
10. GWS 10.8 (+1)
11. Adelaide 9.6 (-1)
12. Essendon 9.5
13. Fremantle 8.4
14. Western Bulldogs 6.0
15. Carlton 5.3 (+3)
16. Brisbane 4.7 (-1)
17. St Kilda 4.5 (-1)
18. Gold Coast 3.9 (-1)
- Aug 18, 2009
- 4,229
- 17,495
- AFL Club
- Richmond
- Thread starter
- #620
This is what the squiggle would look like today if Brisbane had defeated Richmond (a 94-point turnaround from reality):The Squiggle massively overstated Richmond's win against Brisbane in Round 3 which has put them ridiculously out in front of every one else.
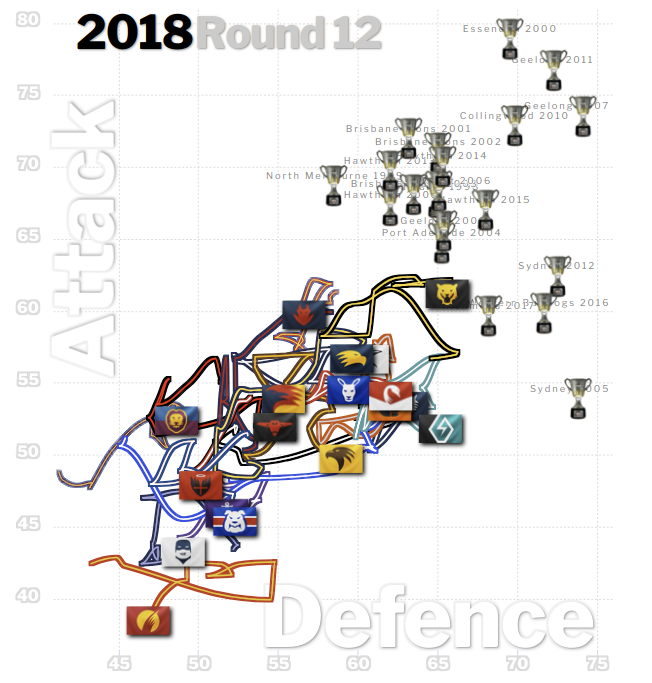
As I said, we've maintained that position, indicating squiggle has not overstated itThe Squiggle massively overstated Richmond's win against Brisbane in Round 3 which has put them ridiculously out in front of every one else.
Forward Press
Hall of Famer
As I said, we've maintained that position, indicating squiggle has not overstated it
Uh, did you see Final Siren's post above yours?
If hypothetically Richmond dropped that game they would have been much closer to the pack than they are now.
But like I said before, it's an outlier but it is what it is and is always an impressive achievement no matter the opposition. 17 points conceded in a game is very rare.
That chart suggests that we'd be moving that wayUh, did you see Final Siren's post above yours?
If hypothetically Richmond dropped that game they would have been much closer to the pack than they are now.
But like I said before, it's an outlier but it is what it is and is always an impressive achievement no matter the opposition. 17 points conceded in a game is very rare.
If my eyeballing is correct, since the hypothetical loss to Brisbane, we've gained 10 defence points, which is more than half way to our current position. A loss in that game is almost as much of an outlier as the win we ended up having.
- Aug 18, 2009
- 4,229
- 17,495
- AFL Club
- Richmond
- Thread starter
- #625
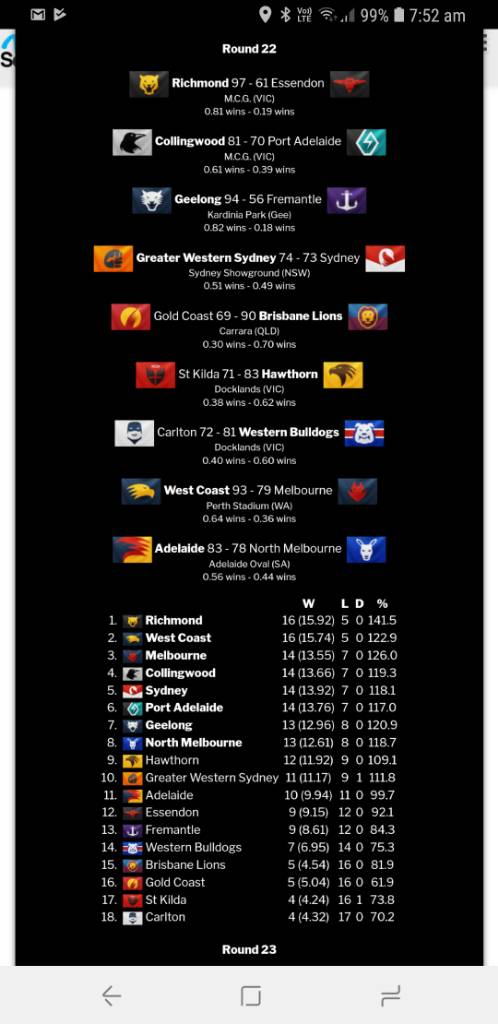
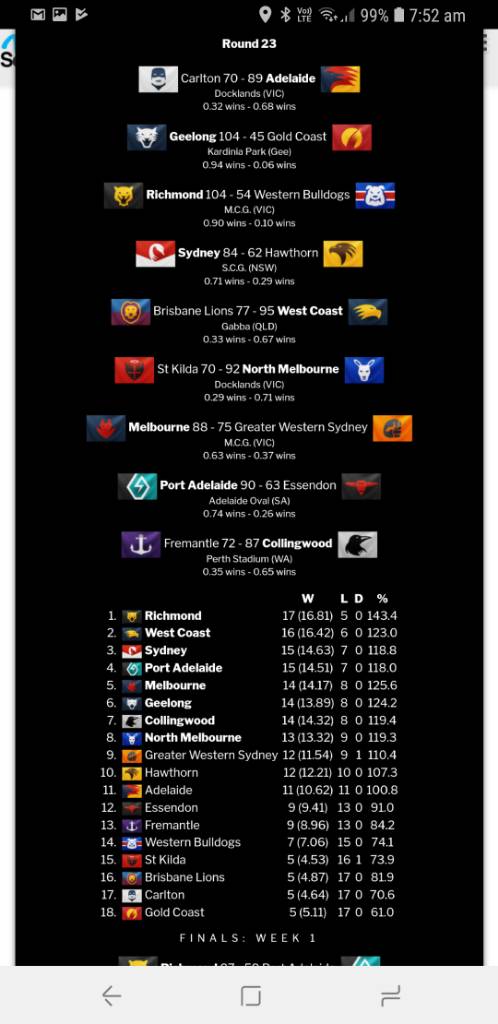
It's because that's a probabilistic ladder, where if you have a 65% win likelihood, you get 0.65 wins. So the Pies are on 13.66 wins (rounded off to 14), then gain 0.65 wins, which takes them to 14.32, still rounded off to 14.Hey Final Siren, i think you have a bug in the forecast.
Round 22 shows collingwood in 4th on 14 wins.
Round 23 shows collingwood winning but still stays on 14 wins
Sent from my SM-G960F using Tapatalk
There are a few different ways of predicting final ladders, each with their own quirks.
Tipping the favourites each time makes sense from an individual game tip point of view, but adding it up gives you a very unrealistic final ladder where the top teams go undefeated and the bottom teams are winless.
Trying to throw in a few upsets makes the final ladder more realistic, but the fact is you can't accurately pick upsets; that's why they're upsets.
The probabilistic ladder used by Squiggle here gives you a realistic final ladder, but can't tell you which particular games it expects a team to win or lose. It can also generate logically impossible ladders, e.g. last year in the final round when Richmond logically had to finish either 3rd or 6th, it would average this out to 4th or 5th.
Running a lot of simulations and aggregating the results is very similar to the above, but a little more mathematically rigorous if you have a good random number generator.
The ideal way, I reckon, which I used for AutoTip in the Squiggle Ladder Predictor at https://predictor.squiggle.com.au, is to run a lot of simulations, score them, then pick out the "most normal" one. This gives you a realistic final ladder that's logically possible AND tips individual games. But it still has drawbacks: (1) It will tip upsets, which by definition are unlikely to happen in real life, and (2) to be very reliable it needs a very high number of simulations, which requires lots of computer power.
Similar threads
- Replies
- 155
- Views
- 6K
- Replies
- 2
- Views
- 363
- Replies
- 0
- Views
- 314
- Replies
- 118
- Views
- 5K
