Certified Legendary Thread The Squiggle is back in 2023 (and other analytics)

Remove this Banner Ad

That chart suggests that we'd be moving that way
If my eyeballing is correct, since the hypothetical loss to Brisbane, we've gained 10 defence points, which is more than half way to our current position. A loss in that game is almost as much of an outlier as the win we ended up having.
Yes, I agree with this. If you take 94 points out of any team this year, it'll hurt their chart position quite a lot.

The funny thing about the Brisbane game is that the next round, Richmond defeated Melbourne by 48 and moved dead right again. So the only thing Squiggle saw wrong about Richmond's position was that it wasn't far right enough.

Anyway, Richmond's current position isn't due to just one thing. They entered the season at the head of the pack and have delivered very good results, with lots of thumping wins plus acceptably honorable losses away interstate to other strong teams. It's just a solid raft of numbers.

The other teams that started with good 2017 track records (Sydney, Geelong, Port Adelaide, Adelaide, GWS) have been inconsistent or outright poor, while teams that have performed strongly (West Coast, North Melbourne, Melbourne, Collingwood) started from much further back. It's not common for a team to rise from the lower half of the pack to flag contention in a single year, so they have a bit more to prove.
 
I thought for sure we’d edge towards Richmond last night but somehow went backwards even though we only allowed 75pts and scored 132 ourselves.

Only 2 teams have scored over 100 against us and they were 104 and 102.
 
I thought for sure we’d edge towards Richmond last night but somehow went backwards even though we only allowed 75pts and scored 132 ourselves.

Only 2 teams have scored over 100 against us and they were 104 and 102.
Port are currently rated the #2 defence, but yes, they did go backwards on that metric last night.

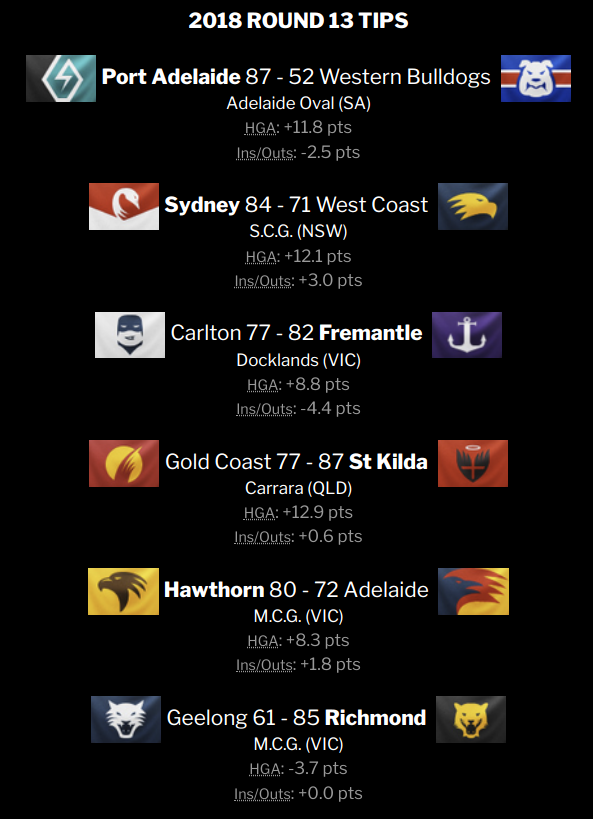
Squiggle expected an 87-52 scoreline, so Port exceeded expectations in attack, but also conceded more than they should have.

Still, you would normally expect a 57-point win to generate net positive movement, since the tip was only a 35-point win. Three things caused it to wind up rated as basically neutral:

(1) Port beat its expected score by quite a lot (scoring 132 instead of 87: that's 45 points better) and didn't let the Bulldogs score all that many more points (75 instead of 52, so only 23 points better), so you might think the combined effect should be positive for Port. But Squiggle looks at it relatively: Port's scoring was 52% higher and they allowed the Dogs to score 44% more. That's not too different.

(2) Port were unusually accurate, kicking 20.12 to 11.9. After accounting for that, Squiggle considers Port's scoring to be only 36% higher than expected and the Dogs scoring to be 38% higher. So now it's almost identical.

(3) Both teams selected slightly weaker sides this week. This makes only a small difference, but it's an interesting effect so I'll talk about it anyway. So Squiggle considered Port to be 4 points weaker this week, based on team selections, and the Dogs to be about 1.5 points weaker than they were last week. Both of these things slightly hurt Port on the chart. Firstly, the Power have to beat the Dogs by 1.5 points more now just to meet expectation. This part is already included in the tip, though, so it shouldn't be too surprising. But the other part probably is surprising: Even if Port met expectation exactly last night, they would still go backwards, because that expectation was based on Port being a 4-point weaker side. So they need to move a little to reflect that new reality.
 

Log in to remove this ad.

Port are currently rated the #2 defence, but yes, they did go backwards on that metric last night.

Squiggle expected an 87-52 scoreline, so Port exceeded expectations in attack, but also conceded more than they should have.

Still, you would normally expect a 57-point win to generate net positive movement, since the tip was only a 35-point win. Three things caused it to wind up rated as basically neutral:

(1) Port beat its expected score by quite a lot (scoring 132 instead of 87: that's 45 points better) and didn't let the Bulldogs score all that many more points (75 instead of 52, so only 23 points better), so you might think the combined effect should be positive for Port. But Squiggle looks at it relatively: Port's scoring was 52% higher and they allowed the Dogs to score 44% more. That's not too different.

(2) Port were unusually accurate, kicking 20.12 to 11.9. After accounting for that, Squiggle considers Port's scoring to be only 36% higher than expected and the Dogs scoring to be 38% higher. So now it's almost identical.

(3) Both teams selected slightly weaker sides this week. This makes only a small difference, but it's an interesting effect so I'll talk about it anyway. So Squiggle considered Port to be 4 points weaker this week, based on team selections, and the Dogs to be about 1.5 points weaker than they were last week. Both of these things slightly hurt Port on the chart. Firstly, the Power have to beat the Dogs by 1.5 points more now just to meet expectation. This part is already included in the tip, though, so it shouldn't be too surprising. But the other part probably is surprising: Even if Port met expectation exactly last night, they would still go backwards, because that expectation was based on Port being a 4-point weaker side. So they need to move a little to reflect that new reality.

Just a comment

Not a bad criticism. But you are taking the squiggle slowly away from the simplicity that was one of its strengths. As it gets more complicated it gets more accurate, but also loses the ease of understanding - a bit. In its earlier form you'd know what to mentally adjust for, given the Squiggle didn't take many things into account. Now it's a bit harder to adjust your (my) thinking to what the Squiggle is showing.

Not a bad thing. But a change in what the model does for thinking about the AFL.
 
Uh, did you see Final Siren's post above yours?

If hypothetically Richmond dropped that game they would have been much closer to the pack than they are now.

But like I said before, it's an outlier but it is what it is and is always an impressive achievement no matter the opposition. 17 points conceded in a game is very rare.

This is the exactly the type of fallacy that squigs abstracts from and what makes it so good.

Human - pfft - complete meaningless result that is an absolute outlier. I'm ignoring it.

Squigs - no there is valuable information here - historically only good teams can keep sides to such a low score defensively.
 
Port are currently rated the #2 defence, but yes, they did go backwards on that metric last night.

Squiggle expected an 87-52 scoreline, so Port exceeded expectations in attack, but also conceded more than they should have.

Still, you would normally expect a 57-point win to generate net positive movement, since the tip was only a 35-point win. Three things caused it to wind up rated as basically neutral:

(1) Port beat its expected score by quite a lot (scoring 132 instead of 87: that's 45 points better) and didn't let the Bulldogs score all that many more points (75 instead of 52, so only 23 points better), so you might think the combined effect should be positive for Port. But Squiggle looks at it relatively: Port's scoring was 52% higher and they allowed the Dogs to score 44% more. That's not too different.

(2) Port were unusually accurate, kicking 20.12 to 11.9. After accounting for that, Squiggle considers Port's scoring to be only 36% higher than expected and the Dogs scoring to be 38% higher. So now it's almost identical.

(3) Both teams selected slightly weaker sides this week. This makes only a small difference, but it's an interesting effect so I'll talk about it anyway. So Squiggle considered Port to be 4 points weaker this week, based on team selections, and the Dogs to be about 1.5 points weaker than they were last week. Both of these things slightly hurt Port on the chart. Firstly, the Power have to beat the Dogs by 1.5 points more now just to meet expectation. This part is already included in the tip, though, so it shouldn't be too surprising. But the other part probably is surprising: Even if Port met expectation exactly last night, they would still go backwards, because that expectation was based on Port being a 4-point weaker side. So they need to move a little to reflect that new reality.
You know you want to allow for umpire error. You can't let Roby have all the glory - he even retired properly.
 
Just a comment

Not a bad criticism. But you are taking the squiggle slowly away from the simplicity that was one of its strengths. As it gets more complicated it gets more accurate, but also loses the ease of understanding - a bit. In its earlier form you'd know what to mentally adjust for, given the Squiggle didn't take many things into account. Now it's a bit harder to adjust your (my) thinking to what the Squiggle is showing.

Not a bad thing. But a change in what the model does for thinking about the AFL.
Yeah, absolutely! The more complex it becomes, the more it's like a black box model where you kind of just have to trust it, instead of a simple tool or stat with easily defined strengths and weaknesses that you can combine with your human knowledge.

My goal is illumination, so I do want to make all this as accessible as possible. For example, you can see the HGA and Ins/Outs component of each tip. But right now, yeah, I just added a bunch of complexity and made it harder to see what's going on. I'll be working on this long-term.
Who do you have winning this week?
 
Who do you have winning this week?
https://live.squiggle.com.au/ -> Click TIPS

7t6WtOJ.png


Although now these can change based on team selections!
 
Port are currently rated the #2 defence, but yes, they did go backwards on that metric last night.

Squiggle expected an 87-52 scoreline, so Port exceeded expectations in attack, but also conceded more than they should have.

Still, you would normally expect a 57-point win to generate net positive movement, since the tip was only a 35-point win. Three things caused it to wind up rated as basically neutral:

(1) Port beat its expected score by quite a lot (scoring 132 instead of 87: that's 45 points better) and didn't let the Bulldogs score all that many more points (75 instead of 52, so only 23 points better), so you might think the combined effect should be positive for Port. But Squiggle looks at it relatively: Port's scoring was 52% higher and they allowed the Dogs to score 44% more. That's not too different.

(2) Port were unusually accurate, kicking 20.12 to 11.9. After accounting for that, Squiggle considers Port's scoring to be only 36% higher than expected and the Dogs scoring to be 38% higher. So now it's almost identical.

(3) Both teams selected slightly weaker sides this week. This makes only a small difference, but it's an interesting effect so I'll talk about it anyway. So Squiggle considered Port to be 4 points weaker this week, based on team selections, and the Dogs to be about 1.5 points weaker than they were last week. Both of these things slightly hurt Port on the chart. Firstly, the Power have to beat the Dogs by 1.5 points more now just to meet expectation. This part is already included in the tip, though, so it shouldn't be too surprising. But the other part probably is surprising: Even if Port met expectation exactly last night, they would still go backwards, because that expectation was based on Port being a 4-point weaker side. So they need to move a little to reflect that new reality.


Any insight into the way it calculates the value of ins and outs? Or probably more my question is, if assigning players values, are there any that really surprise you just as a fan?
 
Final Siren, I'm curious about the new In/Out adjustment - have you now got an effectiveness rating for every player in the league? If not, how does this calculation work? (If so, give us the player ratings!)

(if already explained, can someone point me to the post? Thanks).
 

(Log in to remove this ad.)

Question:

If, all other things being equal (same position, same opponent, same predicted scoreline), Team A scores 25 goals 5 behinds (30 scoring shots) and Team B scores 20 goals 20 behinds (40 scoring shots) - would Team B massively improve in comparison to Team A?
 
Question:

If, all other things being equal (same position, same opponent, same predicted scoreline), Team A scores 25 goals 5 behinds (30 scoring shots) and Team B scores 20 goals 20 behinds (40 scoring shots) - would Team B massively improve in comparison to Team A?

Yes as the weighting of goals to behinds is much closer in this model than in real life - it would be approximately a 3-4 goal win to team b in the models mind
 
Yeah, absolutely! The more complex it becomes, the more it's like a black box model where you kind of just have to trust it, instead of a simple tool or stat with easily defined strengths and weaknesses that you can combine with your human knowledge.

My goal is illumination, so I do want to make all this as accessible as possible. For example, you can see the HGA and Ins/Outs component of each tip. But right now, yeah, I just added a bunch of complexity and made it harder to see what's going on. I'll be working on this long-term.

Yep. I like the simplicity. When I do my analysis and reporting I like to try and make it as simple and straightforward as possible. Anything that requires you to do mental arithmetic and multiple causal loop thinking in looking at results is too much for almost all people. The Squiggle is great because I can just look at the chart and see the relative strengths/weaknesses of the teams, and their dynamic movement. Then, if you pay even a bit of attention to the season you know a lot more about how the teams are genuinely performing than if you just look at the ladder.

The Squiggle is input into understanding, not the actual 'truth' itself.
Apologies for downgrading your work from Godlike statements of fundamental reality, to a useful interpretation of our limited understanding of the 'reality' of AFL. :p
 
Question:

If, all other things being equal (same position, same opponent, same predicted scoreline), Team A scores 25 goals 5 behinds (30 scoring shots) and Team B scores 20 goals 20 behinds (40 scoring shots) - would Team B massively improve in comparison to Team A?
Despite Final Siren making the maths for this much more difficult

25.5 = (25*4.3) + (5*2.7) = 121
20.20 = (20*4.3) + (20*2.7) = 140

So I suppose the 20.20 is rated as a higher score.

25.5 is only 15 points more than 20.20 IRL anyway so set shot domination overcomes it.
 
So a behind is worth 62.7% of a goal? When in reality it’s worth 16.6%?

Crazy.
Yes. If you have a flick back through the pages it's been covered a few times, basically goal kicking accuracy tends to be less consistent than other factors. And tipping models that with this sort of weighting perform better than those without it.
 
Port are currently rated the #2 defence, but yes, they did go backwards on that metric last night.

Squiggle expected an 87-52 scoreline, so Port exceeded expectations in attack, but also conceded more than they should have.

Still, you would normally expect a 57-point win to generate net positive movement, since the tip was only a 35-point win. Three things caused it to wind up rated as basically neutral:

(1) Port beat its expected score by quite a lot (scoring 132 instead of 87: that's 45 points better) and didn't let the Bulldogs score all that many more points (75 instead of 52, so only 23 points better), so you might think the combined effect should be positive for Port. But Squiggle looks at it relatively: Port's scoring was 52% higher and they allowed the Dogs to score 44% more. That's not too different.

(2) Port were unusually accurate, kicking 20.12 to 11.9. After accounting for that, Squiggle considers Port's scoring to be only 36% higher than expected and the Dogs scoring to be 38% higher. So now it's almost identical.

(3) Both teams selected slightly weaker sides this week. This makes only a small difference, but it's an interesting effect so I'll talk about it anyway. So Squiggle considered Port to be 4 points weaker this week, based on team selections, and the Dogs to be about 1.5 points weaker than they were last week. Both of these things slightly hurt Port on the chart. Firstly, the Power have to beat the Dogs by 1.5 points more now just to meet expectation. This part is already included in the tip, though, so it shouldn't be too surprising. But the other part probably is surprising: Even if Port met expectation exactly last night, they would still go backwards, because that expectation was based on Port being a 4-point weaker side. So they need to move a little to reflect that new reality.


It must have been a lot of work running both the Final Siren and Roby accounts at the same time!

:)
 
I notice that while HPN is nearly at the top of the models leaderboard, it is languishing down the bottom when it comes to bits.

Does this mean they've just been lucky ie. sitting close to the fence for most games, and just happening to get them right? Or was there an outlier that contributed a large negative score that hurt them?

Also, check out that flagpole. According to the flagpole, it's Richmond's to lose, but if they fall over then it could be any one of seven teams!!
Bits and MAE (average error of predicted margins) are both more reliable indicators of a model's accuracy than Tips. See for example Tony Corke's article discussing this. Correct tips is what humans care about, but just a little good or bad luck can make a huge difference to your score.

That's not to say the best model always has the best MAE or Bits score -- it's just more likely to, compared to number of correct tips.

So HPN's new player-based model is interesting because it's currently the best-performing public model in the country on Tips, but doing badly on Bits and MAE.

I'd say there's a very good chance that it's just gotten lucky so far this year, but it's still impressive and worth watching, since it's a work in progress, created by some very smart guys who know a lot about football.

I'll be adding more stuff to the leaderboard soon so you can see round-by-round metrics. From memory, though, HPN started badly and has improved since.
 

Remove this Banner Ad

Back
Top