Certified Legendary Thread The Squiggle is back in 2023 (and other analytics)

Remove this Banner Ad

Hey Final Siren, how accurate has the Squiggle been in regards to tips this year?
For up-to-date numbers: https://squiggle.com.au/leaderboard/?y=2018

Right now Squiggle has 77 correct tips, which is two off the leading model. It is #1 on Bits, which is very pleasing, and #2 on MAE.

Compared to humans, computer models reliably are good-but-not-great. That is, if you put one into a reasonably large human tipping comp, it would never win, because it's very conservative and doesn't pick enough upsets. But it would always finish in the top 30% or so. It's similar to picking the favourites each game: You'll be right more often than most people, but not more often than a bunch of monkeys who throw in a few upsets, because one of those monkeys will randomly get enough correct to move ahead.

The Squiggle v1 algorithm, discontinued last year, would be on 74 tips today, so the new model has gotten +3 correct so far as well has having a 1.1-point better MAE and +1.5 more Bits. The new Ins/Outs Squiggle4 algorithm, if run from the start of the season, would be on 82 with better MAE and Bits again, but those are mostly "retro-dictions", not real tips.
 
Any insight into the way it calculates the value of ins and outs? Or probably more my question is, if assigning players values, are there any that really surprise you just as a fan?
I haven't attempted to rate players myself; I've just used their scores from AFL Player Ratings.

So for example Richmond yesterday looked like this:
Code:
INS:::: 1110.4
         691.6 Dustin Martin
         137.2 Jack Graham
           0.0 Ryan Garthwaite
         281.6 Daniel Rioli
----------------------
         276.0 David Astbury
         143.0 Anthony Miles
         121.9 Connor Menadue
          20.7 Callum Moore
OUTS:::: 561.6
Differential: 548.8

And Geelong looked like this:

Code:
INS::::  253.4
         113.3 Lincoln McCarthy
          63.6 Cory Gregson
          76.5 Zach Guthrie
----------------------
          52.5 Aaron Black
         175.8 James Parsons
          18.6 Jamaine Jones
OUTS:::: 246.9
Differential: 6.5

So that's no real difference for Geelong, but a big positive for the Tigers, which the algorithm translated into +5.2 points for Richmond.

As it turned out, that didn't change the tip, and in fact made it worse! It shifted from Richmond by 24 to Richmond by 29. But that's how it works.
I can see how player rating impacts one match, but what about across several? E.g. a team doing well loses a bunch of players so they aren't expected to do so well next game. All good for that. What if they are still out the following game (their player rating doesn't move much). Isn't it going to then only be regarding the one game with them out and a bunch with those players in? And not adjust for it. Or is that you've taken the round 1 side for everyone as their base line and in's / outs are done off that each week?
 

Log in to remove this ad.

I haven't attempted to rate players myself; I've just used their scores from AFL Player Ratings.

So for example Richmond yesterday looked like this:
Code:
INS:::: 1110.4
         691.6 Dustin Martin
         137.2 Jack Graham
           0.0 Ryan Garthwaite
         281.6 Daniel Rioli
----------------------
         276.0 David Astbury
         143.0 Anthony Miles
         121.9 Connor Menadue
          20.7 Callum Moore
OUTS:::: 561.6
Differential: 548.8

And Geelong looked like this:

Code:
INS::::  253.4
         113.3 Lincoln McCarthy
          63.6 Cory Gregson
          76.5 Zach Guthrie
----------------------
          52.5 Aaron Black
         175.8 James Parsons
          18.6 Jamaine Jones
OUTS:::: 246.9
Differential: 6.5

So that's no real difference for Geelong, but a big positive for the Tigers, which the algorithm translated into +5.2 points for Richmond.

As it turned out, that didn't change the tip, and in fact made it worse! It shifted from Richmond by 24 to Richmond by 29. But that's how it works.
It might be hard with minimal data, but it'd be cool to see if you could rate players based on a team's squiggle performance with them in the team vs without
 
I can see how player rating impacts one match, but what about across several? E.g. a team doing well loses a bunch of players so they aren't expected to do so well next game. All good for that. What if they are still out the following game (their player rating doesn't move much). Isn't it going to then only be regarding the one game with them out and a bunch with those players in? And not adjust for it. Or is that you've taken the round 1 side for everyone as their base line and in's / outs are done off that each week?
Good question! You are right that Ins/Outs only matter for the current week.

This is why a team's chart movement isn't affected by its own Ins/Outs. The tip may change ahead of the game, but where a team moves depends on how well it played compared to what Squiggle would have expected with no team changes.

If a team plays badly, Squiggle already knows how to capture that poor performance. It doesn't matter whether that poor performance is due to Outs or what. So there's no need to keep adjusting for long-term Outs, because the team should already have moved to the correct area.

When the injured players come back in, Squiggle will adjust the tip for that game, and then if (and only if) the team plays better, it will move to a better area.
 
It might be hard with minimal data, but it'd be cool to see if you could rate players based on a team's squiggle performance with them in the team vs without
That is how they do it in other sports. I'm not sure it translates as well to AFL, given the large number players -- e.g. you can't extract as much information from time on/off the field, because each player is a smaller part of it. And boy, that's a whole other world. I think I'll steer clear of that for now.

How all this modeling works is you can get most of the way to perfection with something stupid and simple, and every small gain from there is incredibly painful.

For example! In 2017, tipping on a coin toss would get you about 105 tips (51% correct incl. draws).

Tipping all the home teams would get you 124 tips (60%).

Squiggle v1 (ISTATE-91:12) scored 127 tips (61%).

Squiggle 2.0 would have gotten 134 tips (64.7%). Squiggle4 would have 135 tips (65.2%).

So you gained 9 percentage points of accuracy just by going from "tip randomly" to "tip the home team." But for even half as much improvement again, you had to add enormously more complexity.

At which point it also becomes increasingly difficult to tell whether you're actually improving or not.

I reckon you can make a good player-based model simply based on age. That is, it will know nothing about players except how old they all are, and provide a pretty good guide to likely performance. (There is a strong correlation between average team age and win rate.) You could improve that by using something more sophisticated to really tease out which players are the best, but it will cost exponentially more time and effort.

We've got a model at my uni with over 80 variables to predict student performance - not documented. :drunk:

As you might guess I am not a true believer. But those that do believe shout out loud the number of variables as a signifier of how good it is. :D
 
Last edited:
Positive movement in the flagpole after the Richmond game is good news. Still off the pace but not as bad as the squiggle predicted.

Get some attacking power back and things start to look a lot better.
 
Final Siren

An idea for the "player rating" would simply be to award 1/22nd of the team Off/Def points for each particular game they play. Not ideal (there aren't 22 equal players in a team) but would be an interesting perspective, as you would think as a general guide good players play in more successful sides than their immediate replacement.

Ultimately each player would have their own Off/Def 'modifier' with the team rating being the sum of these parts.
I posted a thread 4 or 5 years ago doing something similar: scoring each player based on how well their team played with them in it vs out of it. From memory, it seemed mostly correct, but with a few nonsensical ones, like how Gold Coast were a better team without Gary Ablett.

The main problem is that good players don't miss many games. So you wind up scoring them based on very little data.
 
with a few nonsensical ones, like how Gold Coast were a better team without Gary Ablett.
Was it that nonsensical though? It was quite clear that Ablett was the go-to player at the Suns. They'd constantly look for and pass to him even when he wasn't the best option. Opposition knew they would do that and so it made them highly predictable. Then when he was out of the side and the Suns' team of first rounders had to rely on their own talents they would use each other more and suddenly they turn into a dangerous, young, but very talented side.

At Hawthorn we saw a similar effect when Buddy was out for games. Our forward line became more dangerous due to the unpredictability.
 

(Log in to remove this ad.)

Was it that nonsensical though? It was quite clear that Ablett was the go-to player at the Suns. They'd constantly look for and pass to him even when he wasn't the best option. Opposition knew they would do that and so it made them highly predictable. Then when he was out of the side and the Suns' team of first rounders had to rely on their own talents they would use each other more and suddenly they turn into a dangerous, young, but very talented side.

At Hawthorn we saw a similar effect when Buddy was out for games. Our forward line became more dangerous due to the unpredictability.
Yeah, it was a bit mysterious. But I'm still suspicious of it because it smells like one of those trends that everyone leaps on as soon as it starts looking like a pattern then forgets about immediately afterward. From 2013-2015 the Suns won 46% of games when Ablett was in the side and 17% when he wasn't, and the popular narrative was that they were cooked without him ("Suns extend record without Ablett to 0-7," "Suns finally win without Ablett"), but as soon as they won a few without him and dropped games with him back, the story completely flipped around and now he was making them worse and was a terrible captain.

And maybe the Suns did over-rely on him, and become too predictable, but I think it's going too far to say that adding Ablett (or Buddy) to a team should be considered a negative. You could always just use him differently.

People are really quick to jump on a story with little evidence, and I reckon this was probably the algorithmic equivalent of that: drawing a neat conclusion from too small a sample.
 
Sorry for the late post - I've been in hiding after Adelaide's disgraceful showing last week. I'm here with one match already played, but I don't think that anybody will think I'm cheating as I post a wrong tip for yesterday's game.

Port Adelaide
+38 v Western Bulldogs
Sydney +7 v West Coast
Carlton +3 v Fremantle
Gold Coast v St Kilda +10
Hawthorn +13 v Adelaide
Geelong v Richmond +1

1. Richmond 27.2
2. Geelong 20.7
3. West Coast 20.3 (+1)
4. Sydney 19.4 (+2)
5. Collingwood 18.6 (-1)
6. Melbourne 15.6 (-3)
7. Port Adelaide 14.0 (+1)
8. North Melbourne 13.7 (-1)
9. Hawthorn 7.4
10. Essendon 0.3
11. GWS -2.3
12. Fremantle -7.0 (+1)
13. Brisbane -11.5 (+1)
14. Adelaide -11.2 (-2)
15. St Kilda -19.0
16. Western Bulldogs -25.6(+1)
17. Carlton -28.4 (-1)
18. Gold Coast -37.0

West Coast +29 v Essendon
Port Adelaide +4 v Melbourne
Hawthorn +50 v Gold Coast
Brisbane v GWS +1
Western Bulldogs v North Melbourne +39
Collingwood +46 v Carlton

And the predictive ladder

1. Richmond 17.3 (+1)
2. West Coast 16.8 (-1)
3. Sydney 15.7 (+2)
4. Port Adelaide 14.89 (+3)
5. Melbourne 14.88 (-1)
=6. Collingwood 14.70
=6. Geelong 14.7 (-3)
8. North Melbourne 14.2
9. Hawthorn 13.6
10. GWS 10.8
11. Fremantle 9.6 (+2)
12. Essendon 9.4
13. Adelaide 8.7 (-2)
14. Western Bulldogs 5.6
15. Brisbane 5.1 (+1)
16. St Kilda -5.0 (+1)
17. Carlton 3.9 (-2)
18. Gold Coasta 3.4
 
Last edited:
This is the first time since I switched over that Ins/Outs will change a tip: was predicting West Coast, now Adelaide.

Ins/Outs by AFL Player Rankings points:
Code:
ADELAIDE
INS:::: 1601.3
         568.6 Rory Sloane
          81.7 Curtly Hampton
         298.7 Luke Brown
         426.1 Rory Laird
         176.6 Cameron Ellis-Yolmen
          49.6 Darcy Fogarty
----------------------
         443.1 Eddie Betts
         307.6 Sam Gibson
         219.3 Andy Otten
         359.0 Rory Atkins
           3.0 Patrick Wilson
          35.8 Myles Poholke
OUTS:::: 1367.8
Differential: +233.5

WEST COAST
INS::::  127.2
         120.4 Brendon Ah Chee
           6.8 Brayden Ainsworth
----------------------
         345.8 Mark LeCras
         139.9 Jackson Nelson
OUTS::::  485.7
Differential: -358.5

KfzqaQz.png

Ellis-Yolmen's now out, replaced by Poholke. Does that make Squiggle flip-flop back to us? :p
 
Slow again, this time thanks to a holiday in Greece. Anything to escape Adelaide's dire form.

West Coast +29 v Essendon
Port Adelaide +4 v Melbourne
Hawthorn +50 v Gold Coast
Brisbane v GWS +1
Western Bulldogs v North Melbourne +39
Collingwood +46 v Carlton

1. Richmond 22.15
2. Geelong 16.3
3. Sydney 15.51 (+1)
4. Collingwood 15.47 (+1)
5. Melbourne 14.7 (+1)
6. Port Adelaide 13.6 (+1)
7. West Coast 10.8 (-4)
8. North Melbourne 8.0
9. Essendon 7.9 (+1)
10. Hawthorn 6.0 (-1)
11. GWS 1.0
12. Fremantle -6.2
13. Adelaide -10.7 (+1)
14. Brisbane -15.3 (-1)
15. St Kilda -18.2
16. Western Bulldogs -20.9
17. Carlton -24.8
18. Gold Coast -38.5

Adelaide move up a place after their best showing for a month. West Coast drops a bit and the vultures are circling. The positive skew has vanished with the byes, so all of the ratings are looking lower.

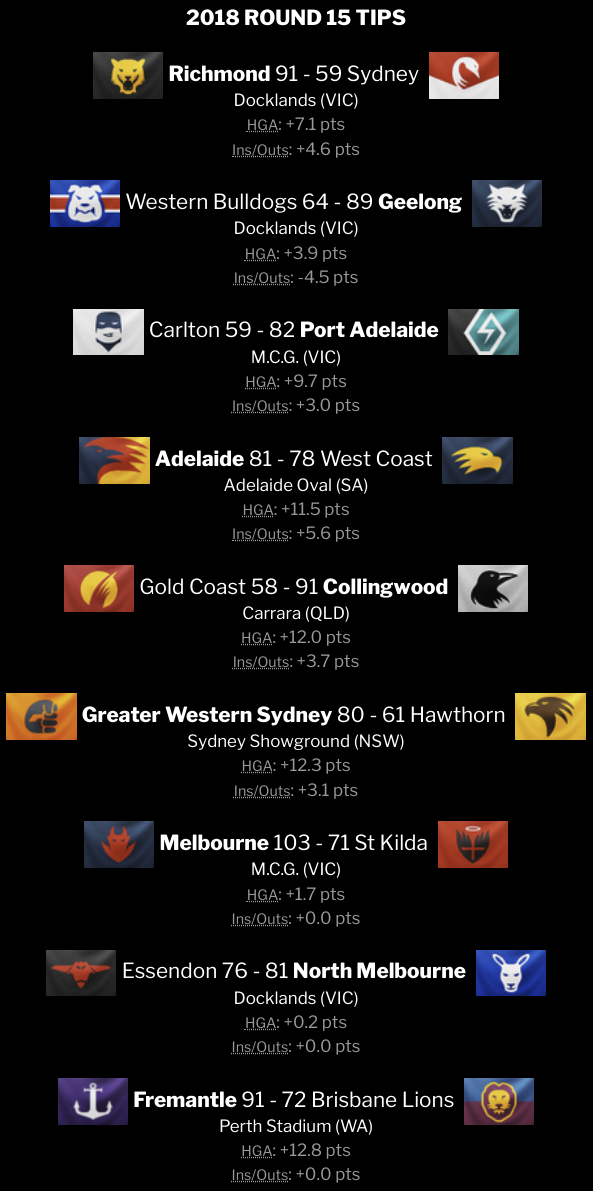
Richmond +12 v Sydney (the rarely-seen animal - the correct retrospective tip)
Western Bulldogs v Geelong +38
Carlton v Port Adelaide +32
Adelaide v West Coast +8
Gold Coast v Collingwood +48
GWS v Hawthorn +1 (really, it's tipping a 0.02 advantage to Hawthorn)
Melbourne +33 v St Kilda
Essendon v North Melbourne +1 (another almost-a-draw tip)
Fremantle +22 v Brisbane


And the predictive ladder

1. Richmond 16.8
2. Sydney 15.4 (+1)
3. Port Adelaide 15.21 (+1)
4. West Coast 15.20 (-2)
5. Collingwood 14.7 (+1)
6. Melbourne 14.43 (-1)
7. Geelong 14.40 (-1)
8. North Melbourne 13.8
9. Hawthorn 13.4
10. GWS 11.7
11. Essendon 11.1 (+1)
12. Fremantle 9.8 (-1)
13. Adelaide 9.1
14. Western Bulldogs 6.1
15. St Kilda 5.0 (+1)
16. Brisbane 4.4 (-1)
17. Carlton 4.1
18. Gold Coast 3.4
 

Remove this Banner Ad

Back
Top