From the stadium, revenue yes, profit maybe no. Stadium charges a bloody fortune. I was speaking to a senior waca exec on Saturday night and he gave me an insight to how it the charging works. Example being is that the waca would make more profit from 17,000 watching a BBL game at the waca than 40,000 watching at Optus. The only way the waca can get their Optus profit up is the special room tickets which are a bloody rip off and no one is buying.
Don’t get me wrong, being premiers will still ensure another great return for WCE but the stadium needs to be paid for and users will be paying top dollar for many years to pay it off.
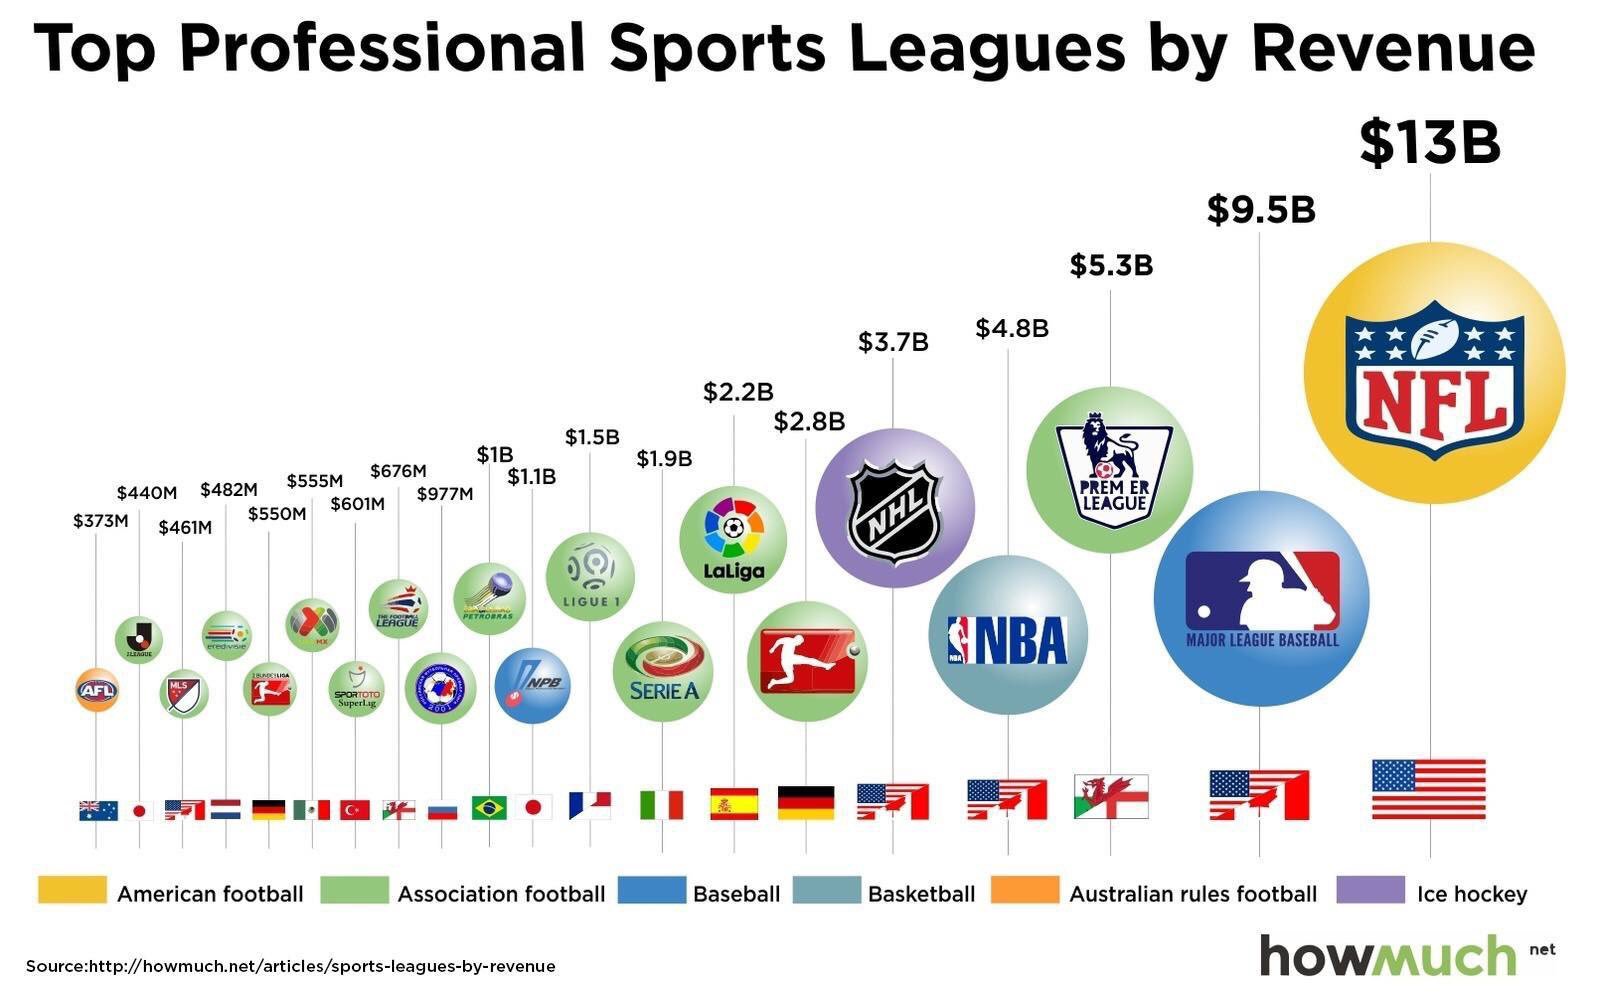
The_Wookie the following wiki page has a list of revenue by clubs in different leagues. The AFL one, as NoobPie said, is wrong as its just the AFL figure and for 2016 not 2017, and when you do a USD conversion of 75 cents of $516m you get close to their $373m USD figure. The Wiki page is mainly 2017 or 2016/17 figures. The references are pages with individual clubs total not HQ+club totals. Its in USD.
You are the reference source for the AFL clubs which is 19th on their list. I read your footy industry page they referenced and I'm not sure if your "AFL club revenues in 2017 narrowly missed the billion dollar mark, totalling $998.13m," includes Port's $57.90m as your graph on that page only shows Port's $6.78m from gaming venues as the club bloody mixes up other sources into only 2 other categories and your graph has 5 other categories.
Obviously it's fair to say that Wiki struggles with this kind of thing as contributions take a certain technical literacy and numeracy and also as it is a parochial topic.
It looks like it was attempting to add it properly going off the references.
Combining the annual report with club revenue aggregate and then converting to euro I get
Which is about 150 above what is referenced. This puts it above the J League and below the Chinese super league. 13th over all which is pretty impressive when you consider the game draws over 80% it revenue from half a country much smaller than all those above it.
However I wouldn't trust a lot of those entries. Using the links, the J-League's is actually around 600M euros and CSL apparently has 72% of its revenues from "commercial sponsorship", just 28% tops from ticketing, tv rights etc
West Coast ownership still sits in Indian Pacific Limited shell & ASIC requires lodgement by the end of January. As I read it the WAFC hold everything back until that goes public (by mid Feb), not sure of the detail of Freos ownership, it'd be on the web page.
West Coast ownership still sits in Indian Pacific Limited shell & ASIC requires lodgement by the end of January. As I read it the WAFC hold everything back until that goes public (by mid Feb), not sure of the detail of Freos ownership, it'd be on the web page.
Fremantle Football Club Limited is a limited company that is entirely a subsidary of the WAFC. Annual report generally available anywhere from now until just after the start of february.
This site uses cookies to help personalise content, tailor your experience and to keep you logged in if you register.
By continuing to use this site, you are consenting to our use of cookies.