Navigation
Install the app
How to install the app on iOS
Follow along with the video below to see how to install our site as a web app on your home screen.
Note: This feature may not be available in some browsers.
More options


You are using an out of date browser. It may not display this or other websites correctly.
You should upgrade or use an alternative browser.
You should upgrade or use an alternative browser.
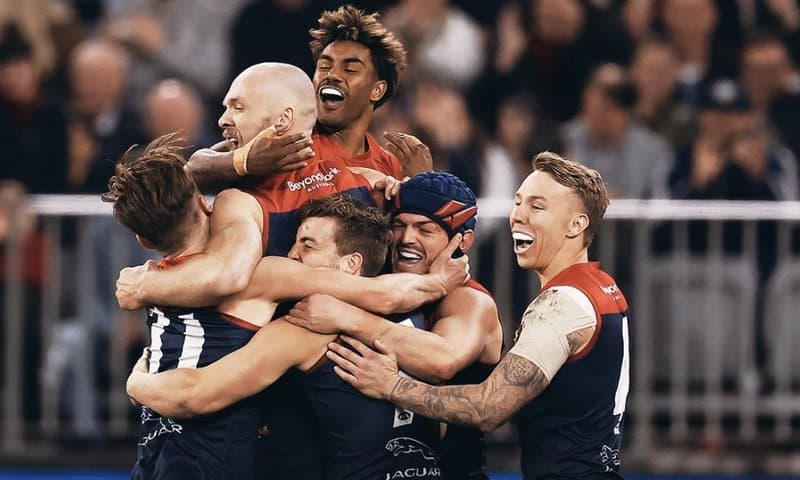
Play Nice 2021 Crowds and Ratings Thread
- Thread starter The_Wookie
- Start date
- Tagged users None
- Status
- Not open for further replies.
Massive ratings for such a one sided match

 forums.mediaspy.org
Friday 10 September 2021
Five City Metro, 6pm-12am, Total People Network ABC 10.4% 10.9% ABC K/P 1.7% 2.0% ABC Me 0.4% 0.4% ABC News 1.8% 1.8% ABC TTL 14.3% 15.1%...
forums.mediaspy.org
Massive ratings for such a one sided match
Friday 10 September 2021
Five City Metro, 6pm-12am, Total People Network ABC 10.4% 10.9% ABC K/P 1.7% 2.0% ABC Me 0.4% 0.4% ABC News 1.8% 1.8% ABC TTL 14.3% 15.1%...
Weekend TV ratings Friday September 10, 2021 - Mediaweek
3m+ watching: Storm and Demons unstoppable in Friday Night Footy finals
 www.mediaweek.com.au
So 1.724M pre streaming and almost certainly well north of 1.9M with. Massive numbers considering the game was beyond 50 points from a few minutes into the second half - I personally switched off at that point
I know the NRL was pretty one sided as well but it is noteworthy that, despite it being a one sided match between two Victorian teams on 7 mate, the ratio of NRL over AFL was only a little over 5 in Sydney and just 3 in Brisbane
428,000 (NRL 336,00) on Fox is very strong figure as well and with the massive FTA figures it puts to rest once and for all the false claim that RL is the best and most popular code on TV! Ch 9 would be smarting in Melbourne also with only 88,000 turning in to the Storm match!
It will be interesting to see if the RL put the Storm PF up against the AFL GF!
With the NRL choosing to play at a small country ground with only 9100 in attendance it made it look second rate and amateurish in comparison to the magnificent spectacle at a full Optus Oval.
It will be interesting to see if the RL put the Storm PF up against the AFL GF!
With the NRL choosing to play at a small country ground with only 9100 in attendance it made it look second rate and amateurish in comparison to the magnificent spectacle at a full Optus Oval.
Last edited:
magpiemaniac44
Club Legend
- Aug 19, 2020
- 2,374
- 2,381
- AFL Club
- Collingwood

- Other Teams
- San Antonio, Melbourne Stars
It'd be a big mistake putting it up against an AFL GF, where they could just play the Friday night before hand, but I don't think the NRL really care about Victoria to be honest. If there was no AFL game up against the Storm game last night there probably would've been 3-4 times more people watching in Vic.428,000 (NRL 336,00) on Fox is very strong figure as well and with the massive FTA figures it puts to rest once and for all the false claim that RL is the best and most popular code on TV! Ch 9 would be smarting in Melbourne also with only 88,000 turning in to the Storm match!
It will be interesting to see if the RL put the Storm PF up against the AFL GF!
With the NRL choosing to play at a small country ground with only 9100 in attendance it made it look second rate and amateurish in comparison to the magnificent spectacle at a full Optus Oval.
- Thread starter
- Moderator
- #1,932
Sunday, 12 September 2021
Seven’s AFL Finals score huge audiences
The 2021 AFL Finals Series continues to score on the Seven Network, with Friday night’s Melbourne v. Geelong match recording the biggest AFL national and capital city audience this year.
Friday night’s clash was watched by 1.3 million people nationally and 1.01 million in the capital cities.
The high-stakes match was up 76% on the 2021 regular season Friday night average and reached 2.45 million people nationally and 1.87 million in the capital cities.
Seven’s Friday AFL match was the #1 program of the night in 25 to 54s, #1 in its timeslot and pushed Seven to a huge 52.8% network commercial share.
On Saturday night, the Port Adelaide v. Western Bulldogs clash recorded an average national audience of 1.18 million people, up 81% on the 2021 regular season Saturday night average.
In the capital cities, 920,000 people tuned into Seven’s live and free coverage, up 89% on the regular Saturday night average audience. The match was the #1 program of the night in 25 to 54s, dominated its timeslot and reached 2.4 million viewers nationally and 1.8 million in the capital cities.
In Melbourne, the audience soared 119% on the regular Saturday night average audience and helped Seven win Saturday night with a massive 49.9% network commercial share across the capital cities.
Seven’s finals coverage to-date has averaged 1.08 million viewers nationally. Across the capital cities, it has an average audience of 834,000. The finals games of Australia’s number one winter sport have reached 5.86 million people nationally so far and 4.33 million in the capital cities.
- Thread starter
- Moderator
- #1,934
The 2021 AFL Preliminary Finals rated a total of 3.292m across FTA and Fox STB - down 6.9% (244,000 - a figure almost certainly made up by streaming audiences). FTA audiences were down 13.5% on 2020 (-14% on 2019), while Fox STB audiences rose 21.5% (-6% on 2019). Streaming N/A
The 2021 AFL Finals series to date has cumulative FTA & Fox STB ratings of 11.2m, down 5.6% on 2020 (-1.6% on 2019). This is likely made up by streaming numbers. FTA is down 10% on 2020 (-2% on 2019), while Fox is up 12% (-1% on 2019).
If you compare it to the 2016 Finals series, the 2021 series rated 11.2m to 14m - down 20% across FTA and Fox - a figure definitely not made up by streaming numbers. Over the last 5 years, FTA dropped 18%, Fox dropped 24%.
- May 13, 2012
- 15,812
- 5,965
- AFL Club
- GWS
- Other Teams
- Brumbies, Socceroos
If you compare it to the 2016 Finals series, the 2021 series rated 11.2m to 14m - down 20% across FTA and Fox - a figure definitely not made up by streaming numbers. Over the last 5 years, FTA dropped 18%, Fox dropped 24%.
I would have thought that streaming would come quite close to making up that 20% drop.
- Thread starter
- Moderator
- #1,936
I would have thought that streaming would come quite close to making up that 20% drop.
week 1 streaming ratings this year came in at 735,000 over 4 matches. The deficit is a couple of million still
week 1 streaming ratings this year came in at 735,000 over 4 matches. The deficit is a couple of million still
The difference would be close enough to 1 million when factoring in streaming given streaming numbers will be higher overall for the semis and prelims than for round 1 of the finals.
So you are left with an overall drop of 8% against what I am pretty sure was an outlier year (and thus an inappropriate/misleading baseline from which to assert that there has been a drop "over the last X years")
Given that there has been a stack of one-sided games (only 2 games within 5 goal margin), no thursday night game in round 1 of the finals, and an overall low drawing mix of clubs this years ratings have been stellar
Bjo187
Premiership Player
- Apr 30, 2020
- 3,185
- 4,196
- AFL Club
- Essendon
Surely you have to look at the clubs playing in the finals when comparing years and ratings. The two biggest clubs essendon and sydney bundled out in the first round. The last 6 wouldn't be in the top 8 for club support i wouldn't think. A finals series without any of these sides going deep:
Essendon, carlton, collingwood, richmond, west coast, adelaide, sydney is naturally going to rate a bit lower.
Essendon, carlton, collingwood, richmond, west coast, adelaide, sydney is naturally going to rate a bit lower.
Surely you have to look at the clubs playing in the finals when comparing years and ratings. The two biggest clubs essendon and sydney bundled out in the first round. The last 6 wouldn't be in the top 8 for club support i wouldn't think. A finals series without any of these sides going deep:
Essendon, carlton, collingwood, richmond, west coast, adelaide, sydney is naturally going to rate a bit lower.
That's dead right. In 2016 5 of the 8 finals included West Coast, Adelaide and/or Sydney (one had Adelaide and Sydney) while the other three games were:
-a two point QF between arch rivals Hawthorn and Geelong
-The doggies ending Hawthorn's attempt at a four-peat
-The doggies v Giants preliminary final classic
The gap is currently 1.7m with the first two weeks of streaming completely known, and only the prelim streaming unknown. We also know from the data that the streaming numbers for the semis wasnt significantly higher than the week 1 finals. In fact we know from the data that the average final rating dropped from week 1 to week 2.
I don't know about "helping me sleep at night" but you sure are sensitive to feedback!
That data shows the 2016 was a big outlier year
Which is reinforced by this from the 2016 annual report
The Toyota AFL Finals Series The gross cumulative audience for the 2016 Toyota AFL Finals Series was 18,368,305. This marks an increase of 10.7 per cent on the total national viewership for the 2015 Toyota AFL Finals Series (16,588,991) and makes it the highest gross cumulative audience for an AFL Finals Series in AFL/VFL history.
A major highlight of the 2016 Toyota AFL Finals Series was the preliminary final between the GWS Giants and the Western Bulldogs, which attracted a national average audience of 2.40 million across free-to-air and subscription television. It was the highest audience for a match since 2008 (excluding Grand Finals) and the second highest in history (behind only the 2.47 million who watched the Geelong v Collingwood preliminary final on a Friday night in 2007).
The average audience of 543,000 viewers on subscription television was also the highest-rating AFL match on the platform of all time (noting the AFL Grand Final is not broadcast on subscription television)
So that Giants Bulldogs game alone had almost 900K more average viewers on FTA plus Box alone than last night's game.
Last edited by a moderator:
- Thread starter
- Moderator
- #1,941
I don't know about "helping me sleep at night" but you sure are sensitive to feedback!
Im not sensitive at all. If you need to pick and choose your data or find context to make it easier to swallow, then good for you - I chose not to in this case - I simply note that I chose a 5 year reference point - Id have done a 10 year one if I had the data to hand as well. Yes it was a big year.
Every year has differentiating factors that make it fun to compare.
Im not sensitive at all.
Hahahah aaaaaaah, sure. Keep telling yourself that.
If you need to pick and choose your data or find context to make it easier to swallow, then good for you
- I chose not to in this case - I simply note that I chose a 5 year reference point - Id have done a 10 year one if I had the data to hand as well. Yes it was a big year.
Every year has differentiating factors that make it fun to compare.
It is noting to do with "picking and choosing". I didn't "pick and choose" anything.
It's the very basics of analytical competence
No professional (i.e. not you) data analyst would mindlessly use an outlier year as the basis for a comparison without qualification - which is what you did.
"Simply" probably says it all really.
- Thread starter
- Moderator
- #1,943
Hahahah aaaaaaah, sure. Keep telling yourself that.
sure.
It is noting to do with "picking and choosing". I didn't "pick and choose" anything.
You cant just take a peak point and say it doesnt count because it doesnt fit your narrative. I mean, obviously you can, because you did, but it doesnt mean you should.
It's the very basics of analytical competence
No professional (i.e. not you) data analyst would mindlessly use an outlier year as the basis for a comparison without qualification - which is what you did.
"Simply" probably says it all really.
Never claimed to be professional, nor did i supply analysis - simply noted what it was and that it was down on 2016. which is all true.
Last edited:
sure.
Yep
You cant just take a peak point and say it doesnt count because it doesnt fit your narrative. I mean, obviously you can, because you did, but it doesnt mean you should.
Which I didn't do at all. Where did I say "it doesn't count"?
I said it is an
inappropriate/misleading baseline from which to assert that there has been a drop "over the last X years"
Never claimed to be professional,
And yet you are carrying on like you are
nor did i supply analysis - simply noted what it was and that it was down on 2016. which is all true.
You did supply analysis. You clearly just don't know the difference
- Thread starter
- Moderator
- #1,945
And yet you are carrying on like you are
And thats rubbish. And its always been rubbish. And its touted by people who cant stand that some people like or respect what i do for some reason. Its an issue you and certain others have had for some time.
Im not a ratings expert - even though i have access to the ratings data needed to make that ascertation - any more than Im a financial expert, despite decades of collating, reading and dissembling the data. Ive never claimed otherwise.
You did supply analysis. You clearly just don't know the difference
No I did not. I gave data and said it was down on 5 years ago - this is fact given without opinion or analysis.
I think you are right on the money there!Surely you have to look at the clubs playing in the finals when comparing years and ratings. The two biggest clubs essendon and sydney bundled out in the first round. The last 6 wouldn't be in the top 8 for club support i wouldn't think. A finals series without any of these sides going deep:
Essendon, carlton, collingwood, richmond, west coast, adelaide, sydney is naturally going to rate a bit lower.
And thats rubbish. And its always been rubbish. And its touted by people who cant stand that some people like or respect what i do for some reason. Its an issue you and certain others have had for some time.
I think most people "like or respect" the fact you gather and assemble sporting data. I've conveyed such sentiments to you previously. I won't do it this time because on previous times you've assured me you don't care if I am grateful for your work!
I've got an issue with how rude and defensive you get if anyone questions any inference you make from that data
In this instance, for tha sins of correctly pointing out that 2016 was likely an outlier and thus
an inappropriate/misleading baseline from which to assert that there has been a drop "over the last X years"
you've responded with data (that proved I was correct) suggesting that you hope "it helps me sleep at night" with the clear intent of demeaning me for merely pointing out 2016 was likely an outlier year
I can't even reference anything else you wrote in that post along the same lines because you have subsequently deleted it but there was more along those lines that my correct assessment was actually just blinkered bias
I suspect such rude responses are a reason why some people have an issue with you rather than that people "like and respect" you.
Im not a ratings expert - even though i have access to the ratings data needed to make that ascertation - any more than Im a financial expert, despite decades of collating, reading and dissembling the data. Ive never claimed otherwise.
You actually do have ratings expertise. You would probably be within a few hand fulls of people with your level of knowledge of Australian sports TV ratings.
You just don't have any analytical expertise. Your problem is you don't even know when you are departing from the revealer of collected ratings data to analyst and interpreter of that data.
No I did not. I gave data and said it was down on 5 years ago - this is fact given without opinion or analysis.
No, this is what you said
Over the last 5 years, FTA dropped 18%, Fox dropped 24%.
You implied a "drop" "over the last five years", which was an analytical claim and, given the base year was an outlier year (and a massive one at that), it was a very misleading one
The fact you are even arguing with me on this is proof you think you have a professional level of expertise. Otherwise why would you be so cocksure?
- Thread starter
- Moderator
- #1,949
I think most people "like or respect" the fact you gather and assemble sporting data. I've conveyed such sentiments to you previously. I won't do it this time because on previous times you've assured me you don't care if I am grateful for your work!
I've got an issue with how rude and defensive you get if anyone questions any inference you make from that data
Ive no issue with people intepreting the data. It happens all the time on my twitter feed and on here and elsewhere. I have an issue with what you claim I did./
In this instance, for tha sins of correctly pointing out that 2016 was likely an outlier and thus
you've responded with data (that proved I was correct) suggesting that you hope "it helps me sleep at night" with the clear intent of demeaning me for merely pointing out 2016 was likely an outlier year
Thats not how its intended to come across. If it helps you to believe a certain thing, you do that.
I can't even reference anything else you wrote in that post along the same lines because you have subsequently deleted it but there was more along those lines that my correct assessment was actually just blinkered bias
Actually its deleted, because Im literally not allowed to post tabulated ratings on this forum or on twitter - expressly forbidden by oztam.
I suspect such rude responses are a reason why some people have an issue with you rather than that people "like and respect" you.
Its got nothing to do with that. This discussion has been had before where you and others treat me in certain ways.
You actually do have ratings expertise. You would probably be within a few hand fulls of people with your level of knowledge of Australian sports TV ratings.
You just don't have any analytical expertise. Your problem is you don't even know when you are departing from the revealer of collected ratings data to analyst and interpreter of that data.
Youve no idea what expertise i have in anything. The data is in point of fact lower - or down - on 2016. Literally all i said.
You implied a "drop" "over the last five years", which was an analytical claim and, given the base year was an outlier year (and a massive one at that), it was a very misleading one
It doesnt take analysis to see that the 2020 figure is demonstrably lower than the 2016 figure. Your argument is that i literally didnt provide context - which is in fact, analysis, or isnt it?
The fact you are even arguing with me on this is proof you think you have a professional level of expertise. Otherwise why would you be so cocksure?
Because im literate and can read what I damn wrote.
Ive no issue with people intepreting the data. It happens all the time on my twitter feed and on here and elsewhere. I have an issue with what you claim I did./
Thats not how its intended to come across. If it helps you to believe a certain thing, you do that.
So "if it helps you sleep at night" wasn't meant to come across as rude? And if I believe it did than you are going with another "if it helps you"?
I'll give you a hint, if you are responding with "if it helps you sleep at night" where somebody makes a very non-personal critique of something you say - you are the one being rude and personal.
Actually its deleted, because Im literally not allowed to post tabulated ratings on this forum or on twitter - expressly forbidden by oztam.
Sure. And that post also included your rude response to my reasonable critique of your post.
Its got nothing to do with that. This discussion has been had before where you and others treat me in certain ways.
"If it helps you sleep at night" that you get negative response sometimes because people are jealous that others "like and respect you" than good for you!
Youve no idea what expertise i have in anything.
Yes I do. I have inferred that using my expertise and I have enough information to make that judgement.
Deep knowledge of ratings data and processes in a certain area exceeding all but perhaps a dozen people = genuine (albeit niche) subject expertise by any stringent measure
Not knowing basic logic and principles of conceptual and quantitative analysis = no analytical expertise by the most lenient measure
BTW I notice you've belatedly changed to using known streaming shares to estimate streaming ratings after your ridiculous intransigence earlier this year!
The data is in point of fact lower - or down - on 2016. Literally all i said.
If you said one data point was "lower" than another data point you would just have been making an observation. If you had just done that you are still engaging in analysis. As soon as you go to the effort of putting two data points next to each-other to "compare" them you are engaging in analysis.
But you did more than this. You said it had "dropped" "over the last five years" which clearly implies a trend which is plain wrong. From the data you put up earlier, 2016 was a massive outlier
It doesnt take analysis to see that the 2020 figure is demonstrably lower than the 2016 figure. Your argument is that i literally didnt provide context - which is in fact, analysis, or isnt it?
No my main beef is that, in response to correctly, fairly and relatively politely pointing out that using an outlier year is an
inappropriate/misleading baseline from which to assert that there has been a drop "over the last X years"
You responded very rudely and resorted to ad hominens
I didn't argue that you "literally didnt provide context". I said you provided a misleading baseline. Providing context would be one way of making it less misleading but I would have started by not using language that implied it was a trend!
Because im literate and can read what I damn wrote.
It's because you have such lack of awareness of the technical implications of the language you use but are arguing anyway like you couldn't possibly be wrong. You wouldn't be doing that if you were aware of your own inexpertise
- Status
- Not open for further replies.
Similar threads
- Replies
- 398
- Views
- 20K
- Poll
- Replies
- 76
- Views
- 6K
