
Mission
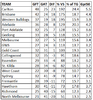
Here it is. The stat we've all been waiting for and one that Champion Data won't release. The definitive answer to oppos who state "it's not how many frees you get, it's where you get them". Well feast your eyes on the table below.
I've gone through every game up to the current round this year, and watched every single goal to get an accurate count. Note that this is goals directly from frees. This means:
Also note that I'm not differentiating between frees that were dubious or not. There's plenty of goals from frees that were absolutely there. Just as there were plenty which came from dubious decisions (Daniher diving forward vs Geelong last night for example). To the table below:
Setup

Analysis
This was the tricky part. The general trend seems to be that the better teams (Melbourne, Bulldogs, Geelong, Brisbane, Port) all fare very well in the positive. However there are some odd results that contradict this. Carlton is MILES ahead of any other team and remarkably, 25% of their goals this year have come from frees. Watching their matches made me realize that Harry McKay
gets a lot of free kicks, most for holding/blocking, and a lot of them dubious. Carlton also have the greatest differential from one match. Their Round 3 game vs Freo saw Carlton kick 7 goals from frees to Freo's 1. Mental.
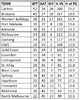
As expected, the lower teams are on the ladder, the worse they seem to fare. North Melbourne and Hawthorn haven't fared too well this year, but it's to be expected considering the amount of defending they're doing each game.
Onto the Tigers. We have the equal second worst goals for, differential, percentage, and percent of total goals. We also have the equal second highest goals against. The board consensus is that we've been robbed quite a bit, and these stats certainly back that claim up. The fact that we give away a lot of goals from frees is ok, because we do play an aggressive gamestyle. But to barely receive any in return compared to other good teams is the perplexing part.
Goals from Frees per Inside 50
I added this onto the table per request. It's the percentage of goals that come from free kicks per inside 50. Say for example a team has 40 Inside 50s for a game, and kicks 10 goals from frees in that game. The above number would be 25%. The higher this percentage is, the better rewarded a team is when the ball is inside their forward line. This is aimed at comparing weaker teams (less inside 50s) and stronger teams (more inside 50s).
Thoughts?
Well what do you all think? I know we've had plenty of umpiring threads/discussion this year, and hopefully this gives some credibility to those claims that we get a bit of a raw deal.
Also note, if you ever hear umpiring whinging from Carlton supporters, show them this table and then tell them to gagf.
Note that I will be updating this table mid-week at the end of each round.
Here it is. The stat we've all been waiting for and one that Champion Data won't release. The definitive answer to oppos who state "it's not how many frees you get, it's where you get them". Well feast your eyes on the table below.
I've gone through every game up to the current round this year, and watched every single goal to get an accurate count. Note that this is goals directly from frees. This means:
- Player gets a free. Then has a set shot or plays on and kicks the goal.
- Player gets a free. Teammate takes advantage and kicks the goal.
Also note that I'm not differentiating between frees that were dubious or not. There's plenty of goals from frees that were absolutely there. Just as there were plenty which came from dubious decisions (Daniher diving forward vs Geelong last night for example). To the table below:
Setup
- GFT = Goals For Total. Total amount of goals from frees.
- GAT = Goals Against Total. Total amount of goals against from frees.
- DIF = Differential. Goals from frees minus goals against from frees.
- % VS = % Versus. Same as percentage on the ladder. Another way of looking at it compared to just using the differential.
- % of TG = Percentage of Total Goals. Shows what percent of every goal kicked this season for that team came from a free kick.
- GP I50 = Goals from frees per Inside 50. See explanation below.

Analysis
This was the tricky part. The general trend seems to be that the better teams (Melbourne, Bulldogs, Geelong, Brisbane, Port) all fare very well in the positive. However there are some odd results that contradict this. Carlton is MILES ahead of any other team and remarkably, 25% of their goals this year have come from frees. Watching their matches made me realize that Harry McKay
PLAYERCARDSTART
10
Harry Mckay
- Age
- 26
- Ht
- 200cm
- Wt
- 106kg
- Pos.
- Fwd
Career
Season
Last 5
- D
- 9.9
- 3star
- K
- 7.5
- 3star
- HB
- 2.4
- 2star
- M
- 5.5
- 5star
- T
- 1.6
- 4star
- G
- 1.4
- 5star
- D
- 6.6
- 1star
- K
- 4.6
- 2star
- HB
- 2.0
- 1star
- M
- 3.6
- 4star
- T
- 1.4
- 2star
- G
- 1.4
- 5star
- D
- 8.8
- 3star
- K
- 6.8
- 3star
- HB
- 2.0
- 2star
- M
- 4.4
- 4star
- T
- 0.8
- 3star
- G
- 2.0
- 5star
PLAYERCARDEND
As expected, the lower teams are on the ladder, the worse they seem to fare. North Melbourne and Hawthorn haven't fared too well this year, but it's to be expected considering the amount of defending they're doing each game.
Onto the Tigers. We have the equal second worst goals for, differential, percentage, and percent of total goals. We also have the equal second highest goals against. The board consensus is that we've been robbed quite a bit, and these stats certainly back that claim up. The fact that we give away a lot of goals from frees is ok, because we do play an aggressive gamestyle. But to barely receive any in return compared to other good teams is the perplexing part.
Goals from Frees per Inside 50
I added this onto the table per request. It's the percentage of goals that come from free kicks per inside 50. Say for example a team has 40 Inside 50s for a game, and kicks 10 goals from frees in that game. The above number would be 25%. The higher this percentage is, the better rewarded a team is when the ball is inside their forward line. This is aimed at comparing weaker teams (less inside 50s) and stronger teams (more inside 50s).
Thoughts?
Well what do you all think? I know we've had plenty of umpiring threads/discussion this year, and hopefully this gives some credibility to those claims that we get a bit of a raw deal.
Also note, if you ever hear umpiring whinging from Carlton supporters, show them this table and then tell them to gagf.
Note that I will be updating this table mid-week at the end of each round.
Attachments
Last edited:


