Resource 2021 Stats Thread

Remove this Banner Ad

At the beginning of the year I looked at offensive efficiency and I thought it was worthwhile revisiting it at this point to see how we are going. In 2020 we ranked 7th in the competition in terms of shots per inside 50, where we converted 46% of inside 50s into shots.

So far in 2021 we rank 11th in this stat at 47.4%. So we have marginally improved but everyone else has improved more than us (stand rule?). The Bulldogs sit well on top at 51.5%. No wonder they are on top of the ladder. Interestingly Sydney sit quite low in this stat as well, but I don't think it tells the whole story because many of the worse clubs are potentially taking low percentage shots on goals. I think the goals per inside 50 probably tell a better story.

1627897901985.png

In terms of goal efficiency we sit 7th with 23.5%. West Coast are top in this stat at 24.9% but they have performed poorly in terms of absolute inside 50s this year. The next best is the Bulldogs at 24.6%, well ahead of the rest of the pack.

1627898160147.png

So in terms of offense we sit around the middle of the pack this year, but it's pretty clear that the top clubs (excluding Melbourne, but they most likely excel in defence) sit just that bit above us. This is an area of improvement for us but we are not that far off from Sydney, Geelong and the Lions. The bulldogs are just in a different league however.

At the beginning of they year I thought offense was our Achilles heel but lately I feel our defence has been below par. I'll try to have a look at this next.
 
Following up from the look at Offence above, now we can take a look at defence for this year. Starting with a breakdown of defensive efficiency on a shot basis (i.e. what percentage of inside 50s against result in a shot on goal for the opposition).

1628583690568.png

In this stat we rank second at 44.1% . Melbourne are the clear leader at first with 40.6% but our other fellow top 4 teams in Geelong and Western Bulldogs sit a fair way back in 7th and 6th place respectively. Contenders Sydney suffer when it comes to this stat - they sit 14th and this is likely what prevents them from being a premiership threat. Perennial strugglers Gold Coast are the surprise packet here as they rank 4th. Maybe once they get their offence and midfield together they'll come good?

In terms of defensive efficiency on a goal basis.

1628583985891.png

Melbourne are still top dogs but Geelong are close behind. This tells me that Geelong allow their opponents many shots less of these result in a goal - perhaps they force shots from acute angles or cast voodoo spells on their opponents to make them miss. We rank third, a way behind Melbourne and Geelong but quite a bit ahead of 4th..who is the Gold Coast again? Stewy is cooking something up there, if he can survive long enough. The Western Bulldogs sit at 6th and Sydney sit in 7th (so quite a bit better than their shot basis).

So to summarise from a Port Adelaide perspective, defensively we are quite good but there is a little improvement there to be as good as Melbourne and Geelong. Offensively we are off the pack and this still remains the major area of improvement if we are to go deep into finals.

Overall in terms of the premiership race, the Western Bulldogs/Melbourne battle is a classic case of defence v. attack. Which will prevail? Perhaps none of them and the more balanced Geelong side will take the prize.

That being said midfields usually win games of football so potentially all the talk about offensive and defensive efficiency is a bit moot. In this stat we rank 5th, a fair way behind the Bulldogs in 1st. Given this, you would think the Bulldogs are flag favourites for now.
 
Will be interesting to compare the above 2 posts to the Matter of Stats guys


August 10, 2021
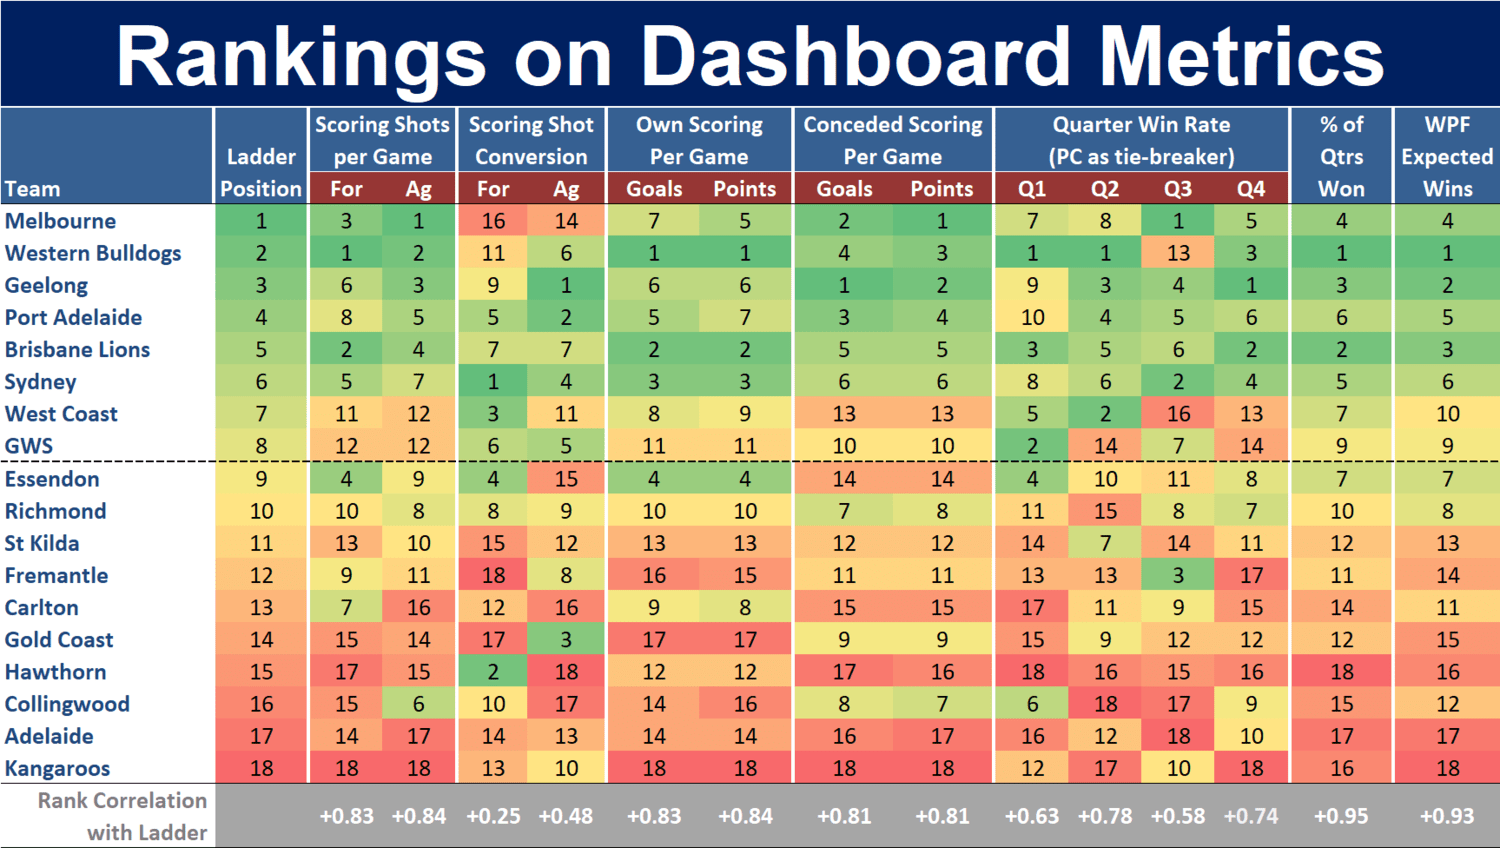
Below is the latest Ranking on Dashboard Metrics data, which shows, as it has done to about the same extent across the entire season, that ladder position is:
Highly related to:
  • Percent of Quarters Won
  • Expected Wins according to the MoS Win Production Function
  • Scoring Shots, Goals, and Points Generated
  • Scoring Shots, Goals, and Points Conceded
  • Q2 and Q4 Perfomances
Moderately related to:
  • Q1 and Q3 Performances
  • Opponent Scoring Shot Conversion
Weakly related to:
  • Own Scoring Shot Conversion

1628588924155.png


The full Team Dashboard appears below, a few of the interesting things from which are that:

  • Sydney have recorded 55.8% of their Scoring Shots as goals, Fremantle only 45.2%
  • Hawthorn’s opponents have registered 56.7% of their Scoring Shots as goals, Geelong’s only 46.2%
  • Adelaide, Gold Coast, Hawthorn, and North Melbourne are the only teams to have been outscored by their opponents in each of the four quarters considered separately
  • Brisbane Lions, Melbourne, and Port Adelaide are the only teams to have outscored their opponents in each of the four quarters considered separately
  • West Coast have scored 56% of their points in Q2s and Q3s
  • Geelong have scored only 19% of their points in Q1s
  • Only four of the teams currently in the Top 8 registered wins this week
  • Essendon and Richmond sit outside the Top 8 with a percentage above 100, and West Coast and GWS sit inside it with a percentage below 100
  • Essendon have scored 200 more points than GWS and 50 more than Melbourne
  • Port Adelaide and Melbourne are the only teams in the Top 8 who are on at least a two-game winning streak
  • Hawthorn has the second equal-longest winning streak in the competition
  • The two currently in the Top 8 have a collective 9 and 7 record across the last two rounds
1628589122704.png
 

Log in to remove this ad.


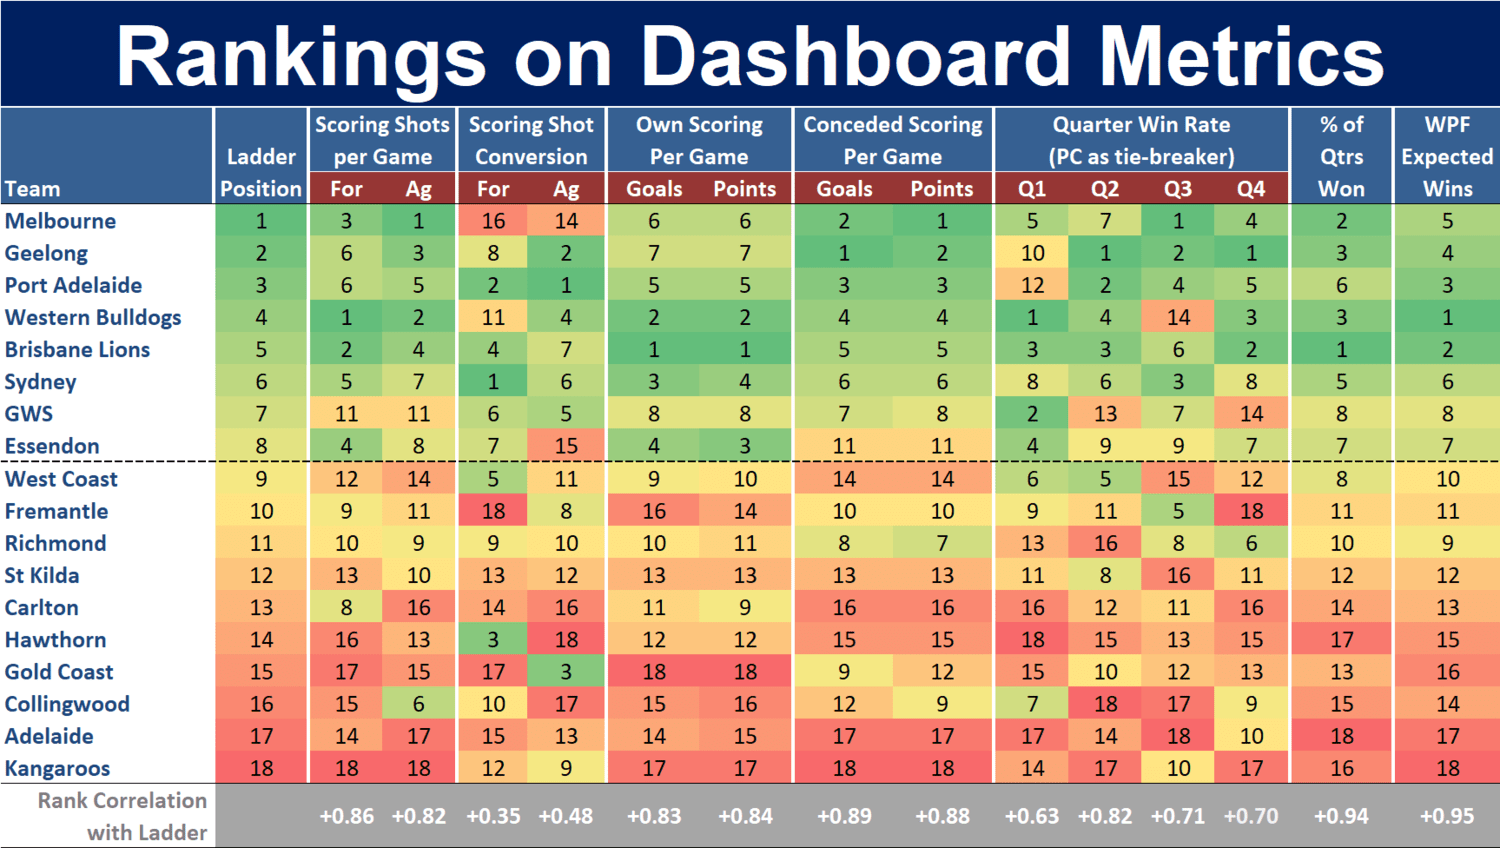
Below is the latest Ranking on Dashboard Metrics data, which suggests that, according to the MoS Win Production Function, all of the Top 8 teams deserve to be Top 8, but in a different order. (And, yikes, that thing is 10 years old now. I should be looking for primary schools for it).
Amongst that Top 8:
  • Melbourne stand out for their relatively poor Own and Opponent Scoring Shot Conversion
  • Geelong and Port Adelaide stand out for their relatively poor Q1 Performances (happened again against carlton).
  • Western Bulldogs stand out for their relatively poor Own Scoring Shot Conversion and Q3 Performances
  • GWS stand out for their relatively poor Own and Opponent Scoring Shot Generation, and for their Q2 and Q4 Performances
  • Essendon stand out for their relatively poor Opponent Scoring Shot Conversion, and for Goals and Points Conceded
R22 - Ranking on Dashboard Metrics.png

The full Team Dashboard appears below, a few of the interesting things from which are that:
  • Sydney have recorded 55.5% of their Scoring Shots as goals, Fremantle only 45.9%
  • Hawthorn’s opponents have registered 56.4% of their Scoring Shots as goals, Port Adelaide’s only 46.7% (Carlton's crappy goal kicking in Rd 22 helped that this week again)
  • Adelaide, Carlton, Gold Coast, and North Melbourne are the only teams to have been outscored by their opponents in each of the four quarters considered separately (Hawthorn have scored exactly as many points as they’ve conceded in Q3s)
  • Brisbane Lions, Melbourne, and Port Adelaide are the only teams to have outscored their opponents in each of the four quarters considered separately
  • Geelong have scored only 19% of their points in Q1s
  • GWS still sits inside the Top 8 with a percentage below 100
  • Essendon have scored 44 more points than Melbourne, and 83 more points than Geelong
  • Hawthorn has the equal second-longest winning streak in the competition
 
Why do we lose? Well yes, Hinkley, I know. But at a more granular level it is interesting to see what the key indicators are that determine whether we win or lose a game. And why these indicators go up and down (and who is responsible...yes Hinkley I know).

With three facets of the game (midfield, defence and offence) there are three sets of indicators.

Hopefully this gives some insight into where we go wrong and what we can improve. Although nothing really seems to change at Port Adelaide so I mostly expect there will be the same issues next year. Anyway onto the numbers.

Midfield

Overall Summary

The basic methodology here is to quantify the difference between the indicators for Port Adelaide and the opposition using a percentage difference and then compare these differences in wins and losses.

For midfield the best stats available are contested possessions, ground ball gets, centre clearances, stoppage clearances, pressure acts, hitout win percentage and hitouts to advantage.

See the below comparison between wins and losses.

1631942955867.png

When we win, we win contested ball, ground balls, centre clearances and stoppage clearances. Notably the win in ground balls is marginal, we rarely completely dominate this stat and potentially that is a reason why we don't blow out opponents. When we lose we get smashed in these stats. Destroyed in ground ball and stoppage clearance and big deficits in contested possession and centre clearances.

When we win, we lose pressure acts and when we lose, we win pressure acts. If you don't got the ball you chasing ass. I don't this stat is useless, if you are going to competitive in the game you need to be competitive in this stat, but it certainly is not a key indicator of winning and losing.

We usually win raw hitout counts but in wins convert that win into hitouts to advantage. In losses we actually win the hitout numbers by more, but that leads to a smaller surplus in hitouts to advantage. So in other words, raw hitout number seem pretty pointless and good teams are able to limit the damage.

So who is to blame? Where are we losing all this ground balls, contested possessions, clearances etc. Some players hold up in losses better than others...

The below summaries show the percentage difference between a players performance in losses vs. wins. (positive means they perform better in losses, negative means they perform better in wins).

Mr Reliable

These are the players where the difference between their performance in wins and losses is comparable. I've sorted this by ground balls but it's pretty similar for contested possessions.

1631943870313.png

SPP is the absolute king here. Plays well when ship is sinking and holds up as his team crumbles. A significant outperformance in both ground balls and contested possessions in losses. Duursma is a pleasant surprise here with his ground balls but less good in the contest. Amon and Wines are two of our more reliable players and this is evident on the field and stats.

Aliir, DBJ and Jonas are most likely prominent here because they are defenders and see more of the ball in losses. But that being said, my personal opinion is that these guys are the more reliable of our defenders compared to some others.
 
Why do we lose? Well yes, Hinkley, I know. But at a more granular level it is interesting to see what the key indicators are that determine whether we win or lose a game. And why these indicators go up and down (and who is responsible...yes Hinkley I know).

With three facets of the game (midfield, defence and offence) there are three sets of indicators.

Hopefully this gives some insight into where we go wrong and what we can improve. Although nothing really seems to change at Port Adelaide so I mostly expect there will be the same issues next year. Anyway onto the numbers.

Midfield

Overall Summary

The basic methodology here is to quantify the difference between the indicators for Port Adelaide and the opposition using a percentage difference and then compare these differences in wins and losses.

For midfield the best stats available are contested possessions, ground ball gets, centre clearances, stoppage clearances, pressure acts, hitout win percentage and hitouts to advantage.

See the below comparison between wins and losses.

View attachment 1239086

When we win, we win contested ball, ground balls, centre clearances and stoppage clearances. Notably the win in ground balls is marginal, we rarely completely dominate this stat and potentially that is a reason why we don't blow out opponents. When we lose we get smashed in these stats. Destroyed in ground ball and stoppage clearance and big deficits in contested possession and centre clearances.

When we win, we lose pressure acts and when we lose, we win pressure acts. If you don't got the ball you chasing ass. I don't this stat is useless, if you are going to competitive in the game you need to be competitive in this stat, but it certainly is not a key indicator of winning and losing.

We usually win raw hitout counts but in wins convert that win into hitouts to advantage. In losses we actually win the hitout numbers by more, but that leads to a smaller surplus in hitouts to advantage. So in other words, raw hitout number seem pretty pointless and good teams are able to limit the damage.

So who is to blame? Where are we losing all this ground balls, contested possessions, clearances etc. Some players hold up in losses better than others...

The below summaries show the percentage difference between a players performance in losses vs. wins. (positive means they perform better in losses, negative means they perform better in wins).

Mr Reliable

These are the players where the difference between their performance in wins and losses is comparable. I've sorted this by ground balls but it's pretty similar for contested possessions.

View attachment 1239097

SPP is the absolute king here. Plays well when ship is sinking and holds up as his team crumbles. A significant outperformance in both ground balls and contested possessions in losses. Duursma is a pleasant surprise here with his ground balls but less good in the contest. Amon and Wines are two of our more reliable players and this is evident on the field and stats.

Aliir, DBJ and Jonas are most likely prominent here because they are defenders and see more of the ball in losses. But that being said, my personal opinion is that these guys are the more reliable of our defenders compared to some others.
Where do you get ground ball stats from? I know the AFL site has them for the last game per team and the whole season. Have you been keeping a file after every game?
 
Where do you get ground ball stats from? I know the AFL site has them for the last game per team and the whole season. Have you been keeping a file after every game?
The AFL website has them in the "My stats" section of their stats overview for each game. If you go to "My stats" then "Manage stats" button on the top right you can add pressure acts in the "Possessions" section. A bit convoluted but they are there.


For my purposes I download them from an API so I can do some analysis without having to manually take it all down. If you want a list of all of them per game per player in an excel format I can attach it here.
 
The below summaries show the percentage difference between a players performance in losses vs. wins. (positive means they perform better in losses, negative means they perform better in wins).

The Letdowns

These are the players whose performance dips moderately in losses. This section to me is characterised by players who I expect better from. Some of these guys are old heads who should really be more solid under pressure yet seem to let us down consistently when the heat is on.

1632010003498.png

Bergman being on this list is pretty harsh given he is practically a first year player and actually is ahead of quite a few more senior teammates. That being said I am quite concerned about his ground ball ability if he is to transition into a more inside midfield role. He needs to be stronger over the ball and more clean with his hands.

Dixon is a major culprit of turning to s**t in big games and has been this way since he walked through the door. Gray use to be somewhat reliable but recently seems to get beaten very easily against capable opponents. He needs to be better or he needs to go.

Georgiades does well in contested possession but poorly in ground balls. This suggests to me that against better opponents Georgiades becomes extremely reliant on conventional mark-kick forward play and loses his ability to participate in general play. At least he does something, but the next step in his game is becoming more involved at ground level so he doesn't flash in and out of games as much. Although not really any worse than Dixon lol.

Rozee and Butters are learning well of their older teammates in how to under perform. The hope is that these guys are not like the previous generation but it seems to be heading in that direction.

Travis Boak is the worst performing midfielder in our team in losses with a pretty huge 21% drop in ground balls and 14% drop in contested possession. It's not too off the mark to say that us getting thumped in these sorts of games is a lot to do with Travis Boak being a complete non-factor. Great player but perhaps this is an argument as to why its getting close to time to move on?
 
The below summaries show the percentage difference between a players performance in losses vs. wins. (positive means they perform better in losses, negative means they perform better in wins).

The Flakey Flankers (TM)

Finishing off the list we have the players whose performance plummets in losses. Mostly these are flankers, with one exception.

1632037839779.png

Tom Clurey sits at the top of this list. Notably, Tom didn't play a heap of football this year with his injury and form, and also got subbed in one game at half time (which tanked his ratings somewhat, sorry Tom if I have besmirched your name).

Half backs Riley Bonner, Dan Houston and Ryan Burton are next up. With Bonner you get what you pay for. I guess his late season resurgence didn't save his ratings that much. Houston is a disappointment although an expected one. Had a poor year and struggled in the big games, and his contested work really suffered after his shoulder injury. Burton surprises me that he this low, I thought he had a reasonable year, but it seems he really struggled in losses. Those are some big percentage decreases in ground balls and contested ball.

And then we have the flakiest of the flankers in Motlop and Fantasia. These guys fall off the face of the planet in losses. 79% decrease in contested ball in losses for Fantasia! 65% reduction in ground balls for Motlop! Again these guys (especially Fantasia) spent significant time on the injury list this year but I'm not sure this saves them.

I think this is reasonably expected, for the most part (with the exception of Clurey and maybe Burton/Houston) these are the guys you expect to suffer in losses with a lack of easier ball.
 
The below summaries show the percentage difference between a players performance in losses vs. wins. (positive means they perform better in losses, negative means they perform better in wins).

The Flakey Flankers (TM)

Finishing off the list we have the players whose performance plummets in losses. Mostly these are flankers, with one exception.

View attachment 1240143

Tom Clurey sits at the top of this list. Notably, Tom didn't play a heap of football this year with his injury and form, and also got subbed in one game at half time (which tanked his ratings somewhat, sorry Tom if I have besmirched your name).

Half backs Riley Bonner, Dan Houston and Ryan Burton are next up. With Bonner you get what you pay for. I guess his late season resurgence didn't save his ratings that much. Houston is a disappointment although an expected one. Had a poor year and struggled in the big games, and his contested work really suffered after his shoulder injury. Burton surprises me that he this low, I thought he had a reasonable year, but it seems he really struggled in losses. Those are some big percentage decreases in ground balls and contested ball.

And then we have the flakiest of the flankers in Motlop and Fantasia. These guys fall off the face of the planet in losses. 79% decrease in contested ball in losses for Fantasia! 65% reduction in ground balls for Motlop! Again these guys (especially Fantasia) spent significant time on the injury list this year but I'm not sure this saves them.

I think this is reasonably expected, for the most part (with the exception of Clurey and maybe Burton/Houston) these are the guys you expect to suffer in losses with a lack of easier ball.
Nothing surprising on that list. Our backline has lacked backbone for a long time. Teams seem to score easily against us if they get an ascendancy from clearances. I’m never confident they can step up when the chips are down.
We’re still downhill skiers.
 
Coming out of the trade period and into the draft period, I thought it would be interesting to preview what's to come in the 2021 National Draft using some stats! There is quite a bit of analysis on the history of Port Adelaide drafting in this thread. But here I will take a look at our draft hand for 2021.

Currently it looks like we will take three picks to the national draft. Notionally, these picks are pick 12, pick 63 and a FS in Jase Burgoyne. However after FS and academy picks it is quite hard to predict where that pick 63 will fall. With some degree of certainty we can say that pick 12 will be most likely be pick 14 after the bids for Darcy and Daicos though, and as such I'll take a in depth look at the historical performance of former pick 14s.

In the Ladhams trade we traded up from pick 16 to pick 12 so I'll use pick 18 (taking into account bidding) as a comparison.

For my performance metric I'm going to be using the Player Approximate Value (PAV for short) from HPN. Specifically I'm going to be using the cumulative PAVs at 7 years of development as I did in the draft analysis. There are 15 drafts in the sample 2000-2014.

As a high summary we can use means and medians to provide some insight into the data. Below are the mean PAV and median PAV for pick 14 and pick 18.

1634358131795.png

What we can see here is that Mean PAVs for these picks are roughly the same, however the medians are quite different. This indicates that there are more busts from pick 18. For pick 14 only 4 players had less than 20 PAV but for pick 18 there are 7 players. However, on the other end of the spectrum pick 18 has three players above 100 PAV whilst pick 14 has none. The high end of pick 18 is actually a bit better than the high end of pick 14.

So the takeaway here is that at pick 14 you are more likely to have a solid AFL player, however at pick 18 you might be a bit more likely to find a star. Of course we are dealing with a small sample size here so it is dangerous to infer too much. However to some extent it does make sense, as at pick 18 a club might more liable to take a risk and take a more speculative pick than at pick 14, and as such the potential upside may be higher.

5 top players from pick 14.

1634359765974.png

5 top players from pick 18 (Heeney was a academy pick and probably should of been taken top 5).

1634359784172.png

Port Adelaide had had two pick 18s; SPP and Duursma. And one pick 14, Miles Bergman. None of these guys are included in this analysis as they were taken after 2014.
 
Last edited:

(Log in to remove this ad.)

Great player but perhaps this is an argument as to why its getting close to time to move on?

Or the contenders recognise his obvious importance and are far better equipped to target/negate him [and Gray, and Dixon] than lesser teams, and are able to do so accordingly.

Some of that’s on Travis, some of that’s on teammates and some of that’s on the coaches - he [and the other two] is the wrong side of 30 after all.
That might be true. However I would argue that ground ball is a pretty good measure of the absolute ability of a midfielder these days. Barely any teams run hard tags anymore - certainly not any of the top teams. There might be some "referencing" and what not, but for the most part its man on man combat and the best competitor wins. Boak v Oliver. Boak v Bont. Boak v Lyons etc. My opinion is that when he comes up against the absolute cream he gets found out a bit. Whether that's ability or a mental factor or whatever, it seems to be the case.

I think its fair to say that our lack of options in midfield is also a pretty big contributor as well though. If Travis is having a poor game there aren't many (or any) options to turn to give a different look. If we had more guys to rotate through it might alleviate some pressure. It's why I'll always be a big advocate of SPP because he can take that pressure off.

With Dixon and to a lesser extent Gray they are a bit different in that they play forward, where (a) their ability to get ground ball is directly impacted by how much ball is actually getting inside 50 and (b) they are more close checked and their ground ball is more impacted by the negating ability of the oppo defence.
 
It's not too off the mark to say that us getting thumped in these sorts of games is a lot to do with Travis Boak being a complete non-factor. Great player but perhaps this is an argument as to why its getting close to time to move on?

LOL. Replace him with???

Sure Travis has to take some of this on board. But in our best W/L season since the early 00's = 18w 6l are you seriously trying to say we should move Boak on because in 5 of those 6 losses his ground ball gets and contested possessions dropped compared to our wins (didn't play against Brisbane)??? All of those teams - Brisbane Lions, Western Bulldogs, West Coast, Melbourne and Geelong have the midfield power and numbers to focus on shutting down Travis Boak because when you do that you win. I'd love to see what the ruck stats were in those games too, particularly against Melbourne and West Coast. Hard to play your best midfield game when your ruck is getting trounced by e.g. Nic Nat.

Also there are contested possessions when it is 50/50 and contested possessions where the ball is put consistently to your opponents advantage. Same goes for ground ball gets. If your side loses, and loses againsts a top 6 side, chances are both those stats are not 50/50 contests, especially with a midfield as thin as ours was this year.

Most weeks he is the oldest midfielder playing, certainly for us. Paradoxically he has more time on ground (81%) than Drew (71%) or Wines (77%). Why??? FFS. The idea is to manage your older stars if they are still performing for you, not completely run them into the ******* turf. I would be willing to bet he covers as much or more distance than those two guys but I can't get my hands on that data.He played only one less game than either Drew or Wines.

Go back and do the stats for 2013, 14 or even 20 so you can better tell whether it is a mental thing with Boak, or a physical thing. If its a physical thing, maybe we learn a thing or two about managing older stars before we put them out to pasture, especially when we don't have anything to replace them with.

Finally, this is Boak being a 'complete non factor' in thumpings we got this year compared to his statistical average. Perhaps your non-statistical bias is showing through here? In fact when he came up against the cream in 4 out of those 5 losses his key midfield stats were only a tick of his season averages.


Boak.jpg
 
Last edited:
The below summaries show the percentage difference between a players performance in losses vs. wins. (positive means they perform better in losses, negative means they perform better in wins).

The Flakey Flankers (TM)

Finishing off the list we have the players whose performance plummets in losses. Mostly these are flankers, with one exception.

View attachment 1240143

Tom Clurey sits at the top of this list. Notably, Tom didn't play a heap of football this year with his injury and form, and also got subbed in one game at half time (which tanked his ratings somewhat, sorry Tom if I have besmirched your name).

Half backs Riley Bonner, Dan Houston and Ryan Burton are next up. With Bonner you get what you pay for. I guess his late season resurgence didn't save his ratings that much. Houston is a disappointment although an expected one. Had a poor year and struggled in the big games, and his contested work really suffered after his shoulder injury. Burton surprises me that he this low, I thought he had a reasonable year, but it seems he really struggled in losses. Those are some big percentage decreases in ground balls and contested ball.

And then we have the flakiest of the flankers in Motlop and Fantasia. These guys fall off the face of the planet in losses. 79% decrease in contested ball in losses for Fantasia! 65% reduction in ground balls for Motlop! Again these guys (especially Fantasia) spent significant time on the injury list this year but I'm not sure this saves them.

I think this is reasonably expected, for the most part (with the exception of Clurey and maybe Burton/Houston) these are the guys you expect to suffer in losses with a lack of easier ball.

Just a quick question (lol) what's the typical range of raw numbers per game for these categories for your different groupings (flankers, forwards, defenders, mids)? In other words how much difference to the % figure does one more or less unit stat make? Maybe some of the % numbers are a bit sensitive to small numbers/big steps. In soccer when 11 usually beat 10 we don't claim the stats prove that the 10-man side has a specific weak link. The midfield is the best analogy to that, when the oppo has just one more elite mid than us we do seem to have *a* problem, thanks Einstein (not aimed at you lol!) but I don't see that analysis-paralysis over individual midfield stats necessarily points to a source that can be fixed by simple substitution or finger pointing.
 
Just a quick question (lol) what's the typical range of raw numbers per game for these categories for your different groupings (flankers, forwards, defenders, mids)? In other words how much difference to the % figure does one more or less unit stat make? Maybe some of the % numbers are a bit sensitive to small numbers/big steps. In soccer when 11 usually beat 10 we don't claim the stats prove that the 10-man side has a specific weak link. The midfield is the best analogy to that, when the oppo has just one more elite mid than us we do seem to have *a* problem, thanks Einstein (not aimed at you lol!) but I don't see that analysis-paralysis over individual midfield stats necessarily points to a source that can be fixed by simple substitution or finger pointing.
On average, when we lose games we lose ground balls by ~16 and contested poss by ~17. When we win, we win ground ball by about ~4 and contested by ~13.

"The Letdowns" group contribute -6 of that ground ball deficit and the "Flakey Flankers" contribute -8.5 in losses (the Letdowns also has one extra member).

Flanker ground ball and midfield ground ball are no doubt different - ultimately if the midfield is getting beaten there will be less ground ball available for forwards and I guess to some extent half back flankers.

I'm not really sure what you mean by this 10 men angle or extra midfielders? Ultimately every team has 22 players. I agree that replacing one or two of those flanker type players with more genuine, ground ball midfielders would be helpful. That was part of my point. However, if a particular player, like Boak, is getting -20% ground ball in losses (which equates to about -2), this simply means they are getting beaten in the ground ball war.

Perhaps an extra midfielder would help Boak win more ground ball at an individual level? I'm not sure. All we can say based on the available evidence is that he gets beaten quite badly in losses. And if you agree that we typically lose games because we lose ground ball (i.e. it is causal), then it is sensible to suggest that this is a contributor to us losing.
 

Remove this Banner Ad

Back
Top