2023 Crowds and TV/Streaming

Remove this Banner Ad

I see your point, but it's more like, how can a 100,000 member strong, original big-four, "Powerhouse" Melbourne-based club, who have won 3 of the last 6 flags and genuinely call the MCG home (as opposed to some clubs being shoehorned in) manage to fill 3/10ths of their home ground. Last year they got 21,000 to a Thursday Night game. It's like Manchester United only getting 9,000 to Old Trafford - doesn't matter if it's raining or it's Sunday, it just doesn't make sense for any game for clubs like these.

Membership and crowd numbers are not linear.
Can we stop pretending they are.

Lots of other clubs have well over there average crowd figures, but I’m yet to see them discussed every week.

Probably an unpopular opinion amongst my fellow Richmond supporters but we are not as big as Collingwood, Essendon and Carlton.

There is no way to measure it, but my intuition tells me that 37 years in the wildness become a badge of pride we wore and the club has been so good on turning ‘support’ into ‘active support’ which transfers into huge crowd numbers at times.

I think we have also seen with the Hawks, after years of sustained success, crowds will drop off when you start having average years. No club would be immune to this.

4th biggest crowd in Melbourne V port.
11th biggest between the two.

If I’m reviewing the stats at the club this morning to be 15th and drawing the 4th biggest crowd between the two, I’m pretty happy.


Sent from my iPhone using BigFooty.com
Great post 👍no club is immuned when a club drops off apart from WCE their crowds are unbelievable.
 
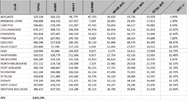
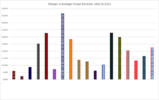
We're basically half way through the season and as the bye rounds begin here's the state of the crowds:

1685324429294.png


1685324560203.png

Pleasingly, every single club is currently averaging more than 2022. These figures will inevitably drop in the second half of the year, but of the clubs with the lowest increases the crowds for all of Adelaide, Brisbane, Freo, and Melbourne should hold up as they continue to challenge. Carlton is at the biggest risk of falling behind last year as their form slumps, but also because they had one of their biggest years ever in 2022. Everyone else is more than 10% up on last year.

Every team's home game average is also up, except GWS which is less than 50 people down.
 

Log in to remove this ad.

We're basically half way through the season and as the bye rounds begin here's the state of the crowds:

View attachment 1699596


View attachment 1699599

Pleasingly, every single club is currently averaging more than 2022. These figures will inevitably drop in the second half of the year, but of the clubs with the lowest increases the crowds for all of Adelaide, Brisbane, Freo, and Melbourne should hold up as they continue to challenge. Carlton is at the biggest risk of falling behind last year as their form slumps, but also because they had one of their biggest years ever in 2022. Everyone else is more than 10% up on last year.

Every team's home game average is also up, except GWS which is less than 50 people down.

Oh you beat me to this lol
 
Might be a difficult question to answer but what clubs are doing the best in tv ratings this year?
It’s not worth considering because some clubs who got rewarded with FTA prime slots for good on field form skew the figures from an objectivity sense. It’s even more elastic to on field fortunes than crowds and membership comparisons.
 

(Log in to remove this ad.)

27488​
West Coast v Melbourne

So that game was played on 15 May 2022.

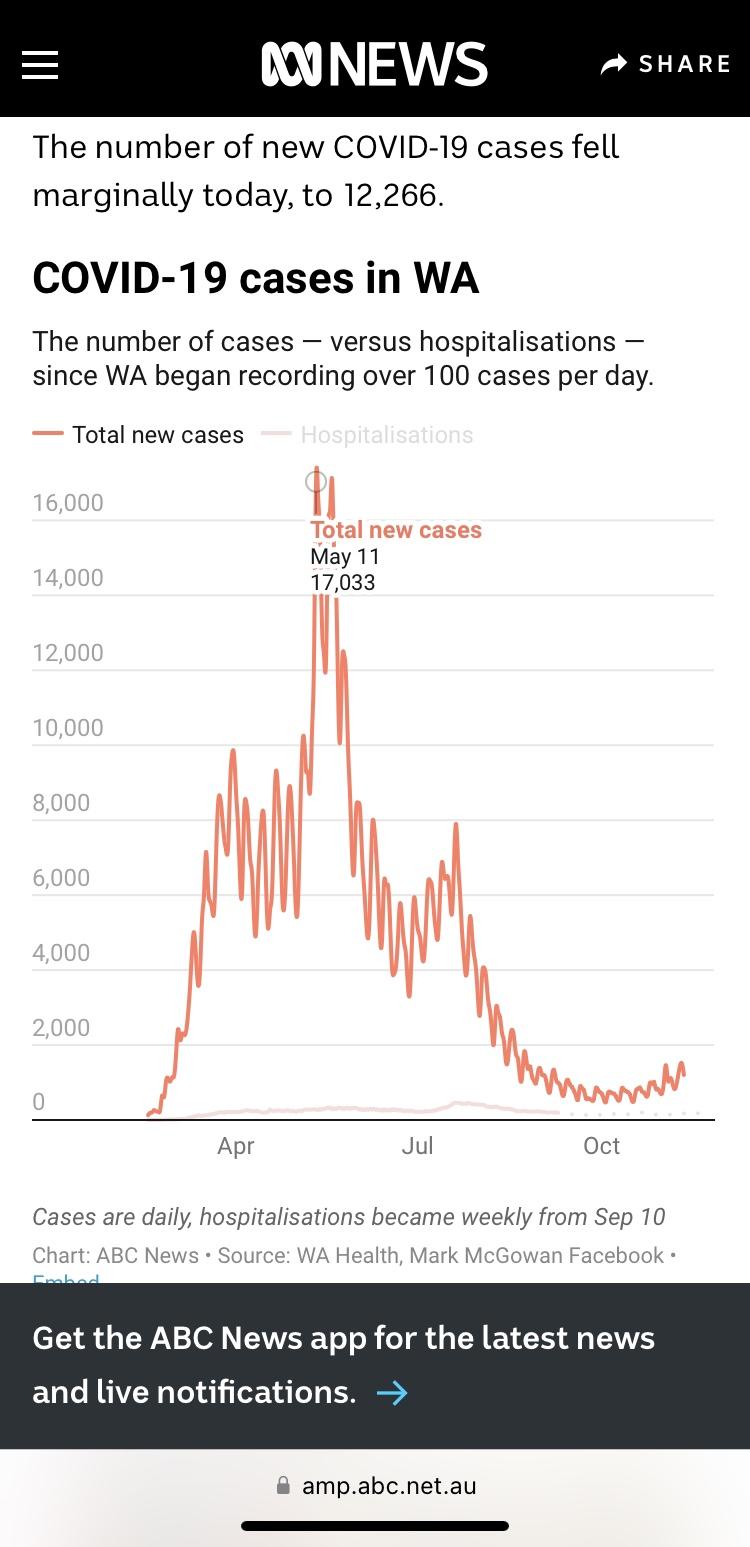
To be fair to the Eagles, that week was the big covid outbreak in WA after the borders had reopened in March. Every other state had their outbreaks around December/January 2021/22 as their borders were already open.

There would have been a large group of people who stayed home for that reason rather than the quality of the Eagles. So they crowd should be considered as Covid impacted.


675d77796522e5b1bbdabd6a38d8497e.jpg


You will notice that the Freo game the next week in Rd10 vs Collingwood (35,000) was also about 7,000 down from the crowd against Carlton (42,000) two home games earlier in Rd6 before the covid outbreak. Being the two big Victorians, it is unusual for the Collingwood crowd to be so much smaller, except for the hesitancy of going out. Two weeks later, once the covid numbers went down and people accepted it, Freo got 47,000 vs Brisbane.

So I’m summary, don’t think to hard on that Eagles crowd being below 30,000.

And any games before R5 in 2022 in Perth still had capacity restrictions.
 
Last edited:
So that game was played on 15 May 2022.

To be fair to the Eagles, that week was the big covid outbreak in WA after the borders had reopened in March. Every other state had their outbreaks around December/January 2021/22 as their borders were already open.

There would have been a large group of people who stayed home for that reason rather than the quality of the Eagles. So they crowd should be considered as Covid impacted.


675d77796522e5b1bbdabd6a38d8497e.jpg


You will notice that the Freo game the next week in Rd10 vs Collingwood (35,000) was also about 7,000 down from the crowd against Carlton (42,000) two home games earlier in Rd6 before the covid outbreak. Being the two big Victorians, it is unusual for the Collingwood crowd to be so much smaller, except for the hesitancy of going out. Two weeks later, once the covid numbers went down and people accepted it, Freo got 47,000 vs Brisbane.

So I’m summary, don’t think to hard on that Eagles crowd being below 30,000.

And any games before R5 in 2022 in Perth still had capacity restrictions.
That makes sense for the low Eagles crowd.
 
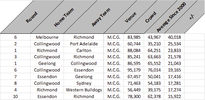
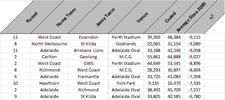
Because I'm bored at work, I got the average crowd since 2000 for each game this year (same home team, away team and venue).

Of the 99 games so far this season, 55 have exceeded the post 2000 average and 34 fell short. The other 10 were instances where matchups/venues had not occurred since 2000 (7 from Gather Round plus St Kilda/Ess @ MCG, Rich/GC @ Docklands, GC/WB @ Darwin).

Overall the total increase above the long term average comes to a bit over 300k, or 3,411 per game.

For context, in 2022 there were 55 above average games for the entire season, and 133 that were below average. The per game average was -3,075.


The top ten above average crowds:
1685426070917.png

The marquee games that haven't existed for a lot of the post 2000 period (primarily the ANZAC Eve clash) do get a bit of a leg up.


The ten most below average crowds:
1685426597098.png

Adelaide seems to have had a much softer rebound from Covid than other cities.
 
Because I'm bored at work, I got the average crowd since 2000 for each game this year (same home team, away team and venue).

Of the 99 games so far this season, 55 have exceeded the post 2000 average and 34 fell short. The other 10 were instances where matchups/venues had not occurred since 2000 (7 from Gather Round plus St Kilda/Ess @ MCG, Rich/GC @ Docklands, GC/WB @ Darwin).

Overall the total increase above the long term average comes to a bit over 300k, or 3,411 per game.

For context, in 2022 there were 55 above average games for the entire season, and 133 that were below average. The per game average was -3,075.


The top ten above average crowds:
View attachment 1700492

The marquee games that haven't existed for a lot of the post 2000 period (primarily the ANZAC Eve clash) do get a bit of a leg up.


The ten most below average crowds:
View attachment 1700498

Adelaide seems to have had a much softer rebound from Covid than other cities.

Good stuff. If you have any extra spare time at work, I have always wondered if you excluded gws and gc, if crowd averages have gone up much since 2010. That would be a good way to determine increase or decrease in attendances for the 16 original teams (i gather those 2 have brought down the averages a lot).
 
Good stuff. If you have any extra spare time at work, I have always wondered if you excluded gws and gc, if crowd averages have gone up much since 2010. That would be a good way to determine increase or decrease in attendances for the 16 original teams (i gather those 2 have brought down the averages a lot).

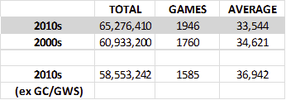
You're in luck as I did exactly this comparison at the end of the last decade (2010-2019). Even more luckily, I actually correctly labelled the spreadsheet I kept the info in and was able to find it again.

1685431301603.png

If you exclude all games involving GC and GWS, the average went up from 34,621 (2000-2009) to 36,942 (2010-2019).

Including all games saw the average instead drop to 33,544.
 
Last edited:
You're in luck as I did exactly this comparison at the end of the last decade (2010-2019). Even more luckily, I actually correctly labelled the spreadsheet I kept the info in and was able to find it again.

View attachment 1700537

If you exclude all games involving GC and GWS, the average went up from 34,621 (2000-2009) to 36,942 (2010-2019).

Including all games saw the average instead drop to 33,544.

Great stuff, thanks. Would almost expect to crack 40k average in the next 5 to 10 years (excluding gws and gc). I also feel like we now play more games at small regional venues than back in the early 2000 period, but I may be wrong. If so that would affect the average a bit too. Ie. Ballarat, Cairns, Darwin, Alice, Hobart, Launceston etc.
 
You're in luck as I did exactly this comparison at the end of the last decade (2010-2019). Even more luckily, I actually correctly labelled the spreadsheet I kept the info in and was able to find it again.

View attachment 1700537

If you exclude all games involving GC and GWS, the average went up from 34,621 (2000-2009) to 36,942 (2010-2019).

Including all games saw the average instead drop to 33,544.

Out of curiosity mate, how do you get this level of in depth data? Is there a application, website or database engine you ascertain this data from..?
Would love to know! It’s great work.


Sent from my iPhone using BigFooty.com
 
Out of curiosity mate, how do you get this level of in depth data? Is there a application, website or database engine you ascertain this data from..?
Would love to know! It’s great work.


Sent from my iPhone using BigFooty.com

It’s a hobby. I run various spreadsheets that I’m always updating. Once the basic data is in there it’s just a matter of crunching it in different ways and finding different uses for it. And I’m very much a self taught amateur with that kind of stuff.

The original data I started with is from AFL Tables, which anyone can download. It’s actually pretty crazy that the only place you can access historical crowd and match information is on an unofficial site that could disappear at any time.
Well done, it’s highly insightful and great to breakdown and discuss on here.
 
We're basically half way through the season and as the bye rounds begin here's the state of the crowds:

View attachment 1699596


View attachment 1699599

Pleasingly, every single club is currently averaging more than 2022. These figures will inevitably drop in the second half of the year, but of the clubs with the lowest increases the crowds for all of Adelaide, Brisbane, Freo, and Melbourne should hold up as they continue to challenge. Carlton is at the biggest risk of falling behind last year as their form slumps, but also because they had one of their biggest years ever in 2022. Everyone else is more than 10% up on last year.

Every team's home game average is also up, except GWS which is less than 50 people down.
We had no team average over 50k last year for home games and now it looks like we will have 3 averaging 50k+ in Essendon Carlton and maybe Richmond or Melbourne with also Collingwood who are on track for something around low 60s.
 
It’s a hobby. I run various spreadsheets that I’m always updating. Once the basic data is in there it’s just a matter of crunching it in different ways and finding different uses for it. And I’m very much a self taught amateur with that kind of stuff.

The original data I started with is from AFL Tables, which anyone can download. It’s actually pretty crazy that the only place you can access historical crowd and match information is on an unofficial site that could disappear at any time.

As someone who runs similar spreadsheets for tv ratings data, your crowd data info is well beyond anything i have to hand. You have my respect sir.
 

Remove this Banner Ad

Back
Top