RussellEbertHandball
Flick pass expert
- Thread starter
- #201
On queue last week Stats insider has an article on Saint Kilda's goal kicking this year and it is at historical high levels.
 www.statsinsider.com.au
From Sinners to Saints: How St Kilda Revolutionised Its Goalkicking
www.statsinsider.com.au
From Sinners to Saints: How St Kilda Revolutionised Its Goalkicking
By Ricky Mangidis on 5-Aug, 13:31.
St Kilda’s goal kicking accuracy is the best ever, by any club in history, through nine rounds of a season.
Yet, if one were to look at Stats Insider’s expected score tool, the Saints haven’t even exceeded expectations. So how can a side literally be the most accurate in history and for it to be perfectly normal?
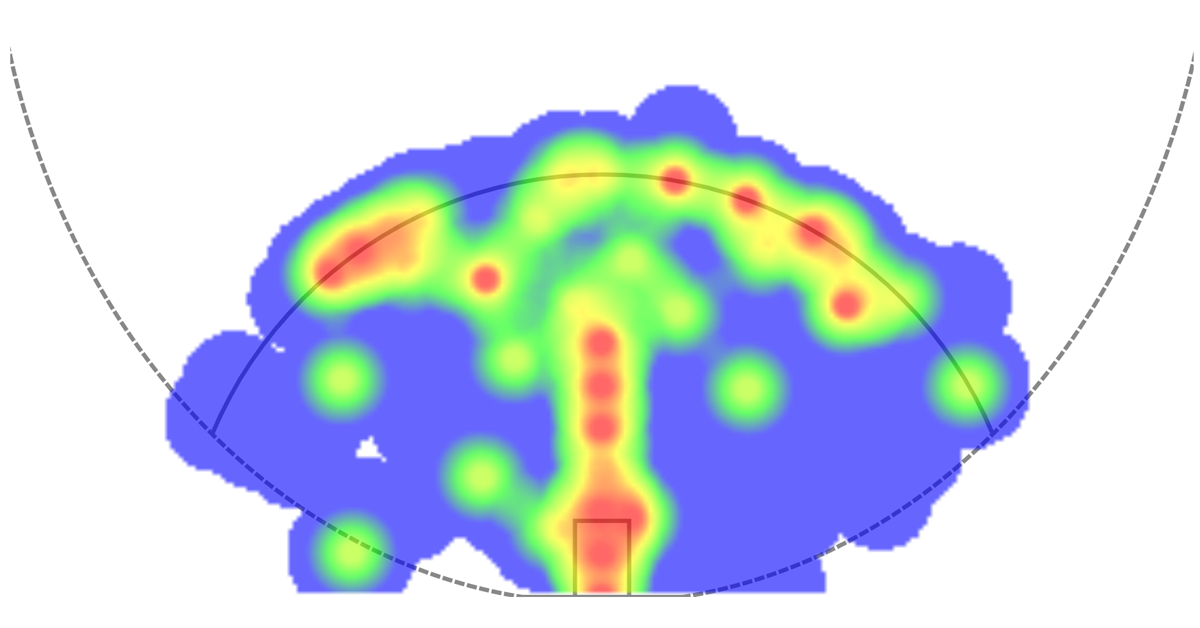
The answer lies in the type of shots St Kilda are creating which represent a significant departure from previous years. By looking through Stats Insider’s Shot Chart Explorer we can see that in 2018 and 2019, St Kilda very much had a scattergun approach – get within range and let fly, regardless of distance and angle.

St Kilda’s 2019 accuracy of 42.6% was the fourth lowest ever recorded, and looking at the above, with red areas indicating where the most shots came from, it’s easy to see why.
Therefore, heading into 2020, clearly the main focus was to improve accuracy.
Brett Ratten has made a point of focusing on improving both the Saints’ shot location, while also ensuring the ones which came in general play were from higher percentage situations.
Naturally, the quickest way to improve accuracy is to take shots closer to goal.
Comparing 2018 and 2019 to 2020, using the Stats Insider shotcharting data which breaks shot distance into three areas – 0-24 metres, 25-49 metres and 50+ metres – we can see a significant increase in what’s been taken close to goal.
The distance is only one part of the puzzle though. Taking shots close to goal is all well and good, but if they come closer to the first row than the square, it won’t amount to much.
But add location to distance, and suddenly something emerges. Remember the 2018 and 2019 shot charts? Add 2020 to it and..…
Those hot spots in the pockets? Gone. Those hot spots on the flanks? Largely gone.
What’s left is a highly concentrated area right where sides would take all their shots in a dream world.
For St Kilda, that dream is a reality. In the space of one year an overall shot profile has changed from all over the place to something every other team would crave.
Perhaps no game highlighted it as perfectly as Round 4 against Richmond. The Saints kicked 15.3.93 and only narrowly exceeded their expected score of 91.When the focus is on shots coming from as close to goal and as straight as possible, to succeed there has to be no hesitation.
.......
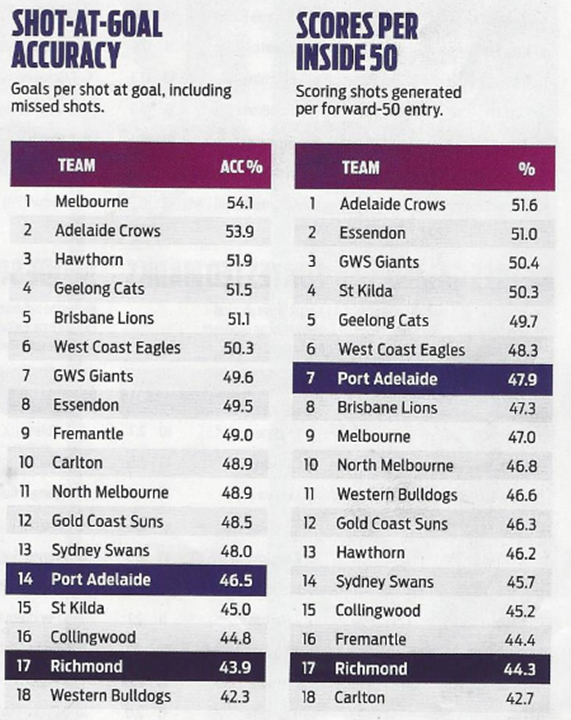
Compare Port and St Kilda after 10 games. Rushed behinds have been eliminated from total scores.
Charlie and others are missing set shots from straight in front that the Saints are kicking. Most of Saints shots from straight in front have been from general play close to goal, but they are nailing the easy set shots.
Compare the pair.
Go to https://www.statsinsider.com.au/afl/shot-charting and sort by teams and/or players and timeframe.
All Shots 2020

Set Shots only 2020

After 10 games Port had kicked 100.84 + 18 rushed behinds, St Kilda 114.54 + 10 rushed behinds. But....
Port's expected score from 224 shots is 730.6 pts actual score is 680 pts St Kilda expected score from 184 shots is 665.3 pts but actual score is 662 pts.

From Sinners to Saints: How St Kilda Revolutionised Its Goalkicking
St Kilda’s goal kicking accuracy is the best ever, by any club in history, through nine rounds of a season. Yet, if one were to look at Stats Insider’s expected score tool, the Saints haven’t even exceeded expectations.
By Ricky Mangidis on 5-Aug, 13:31.
St Kilda’s goal kicking accuracy is the best ever, by any club in history, through nine rounds of a season.
[Above stat was updated for Rd 10 game as after Rd 9 game Inside Lane tweet link above had it at 64.9%.]
Yet, if one were to look at Stats Insider’s expected score tool, the Saints haven’t even exceeded expectations. So how can a side literally be the most accurate in history and for it to be perfectly normal?
The answer lies in the type of shots St Kilda are creating which represent a significant departure from previous years. By looking through Stats Insider’s Shot Chart Explorer we can see that in 2018 and 2019, St Kilda very much had a scattergun approach – get within range and let fly, regardless of distance and angle.

St Kilda’s 2019 accuracy of 42.6% was the fourth lowest ever recorded, and looking at the above, with red areas indicating where the most shots came from, it’s easy to see why.
Therefore, heading into 2020, clearly the main focus was to improve accuracy.
Brett Ratten has made a point of focusing on improving both the Saints’ shot location, while also ensuring the ones which came in general play were from higher percentage situations.
Naturally, the quickest way to improve accuracy is to take shots closer to goal.
Comparing 2018 and 2019 to 2020, using the Stats Insider shotcharting data which breaks shot distance into three areas – 0-24 metres, 25-49 metres and 50+ metres – we can see a significant increase in what’s been taken close to goal.
| St Kilda’s shots on goal by distance | 0-24 metres | 25-49 metres | 50+ metres | |
| 2018 | 15.5% | 55.4% | 29.1% | |
| 2019 | 18.6% | 54.6% | 26.8% | |
| 2020 | 28.8% | 48.4% | 22.8% |
The distance is only one part of the puzzle though. Taking shots close to goal is all well and good, but if they come closer to the first row than the square, it won’t amount to much.
But add location to distance, and suddenly something emerges. Remember the 2018 and 2019 shot charts? Add 2020 to it and..…
Those hot spots in the pockets? Gone. Those hot spots on the flanks? Largely gone.
What’s left is a highly concentrated area right where sides would take all their shots in a dream world.
For St Kilda, that dream is a reality. In the space of one year an overall shot profile has changed from all over the place to something every other team would crave.
Perhaps no game highlighted it as perfectly as Round 4 against Richmond. The Saints kicked 15.3.93 and only narrowly exceeded their expected score of 91.When the focus is on shots coming from as close to goal and as straight as possible, to succeed there has to be no hesitation.
.......
Compare Port and St Kilda after 10 games. Rushed behinds have been eliminated from total scores.
Charlie and others are missing set shots from straight in front that the Saints are kicking. Most of Saints shots from straight in front have been from general play close to goal, but they are nailing the easy set shots.
Compare the pair.
Go to https://www.statsinsider.com.au/afl/shot-charting and sort by teams and/or players and timeframe.
All Shots 2020

Set Shots only 2020

After 10 games Port had kicked 100.84 + 18 rushed behinds, St Kilda 114.54 + 10 rushed behinds. But....
Port's expected score from 224 shots is 730.6 pts actual score is 680 pts St Kilda expected score from 184 shots is 665.3 pts but actual score is 662 pts.

Last edited:

")