- May 3, 2007
- 36,265
- 21,004
- AFL Club
- Fremantle
- Other Teams
- Man City, Valencia, Lazio, Panthers
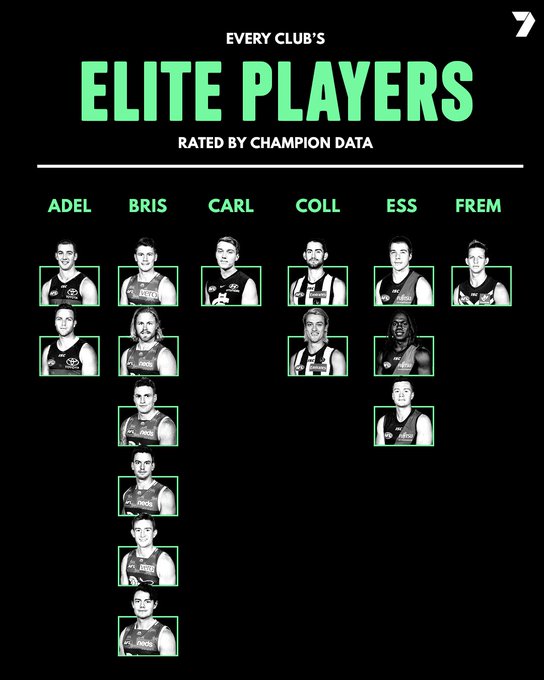
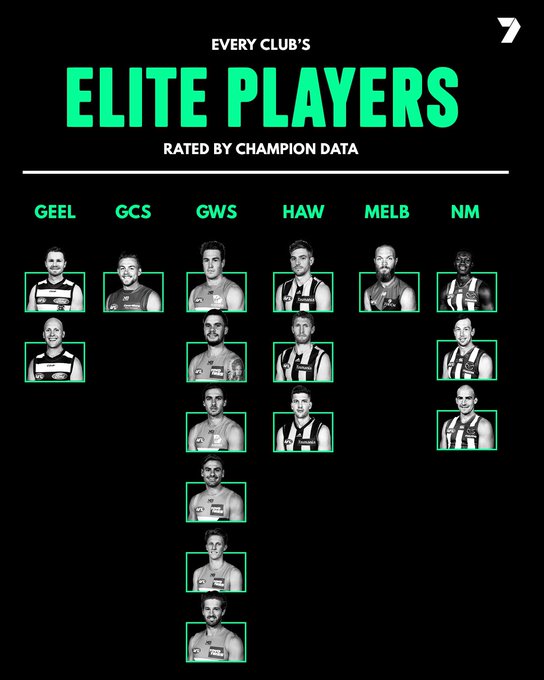
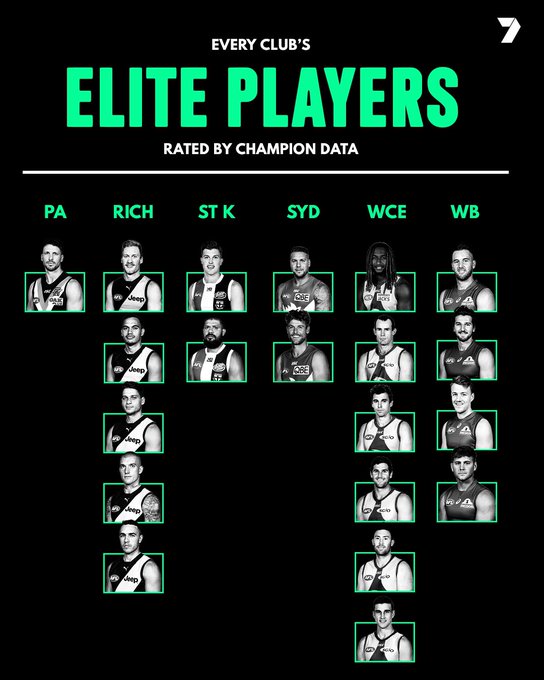
Majak Daw is elite!Gets e even better when you see the players CD rate "Elite"

Sorry Hawk fans Tex Walker, Connor McKenna, Huge Greenfield and Majak Daw are Elite talent and Tom Mitchell isn't