Politics Climate Change Paradox (cont in part 2)

Should we act now, or wait for a unified global approach


  • Total voters
    362

Remove this Banner Ad

Status
Not open for further replies.
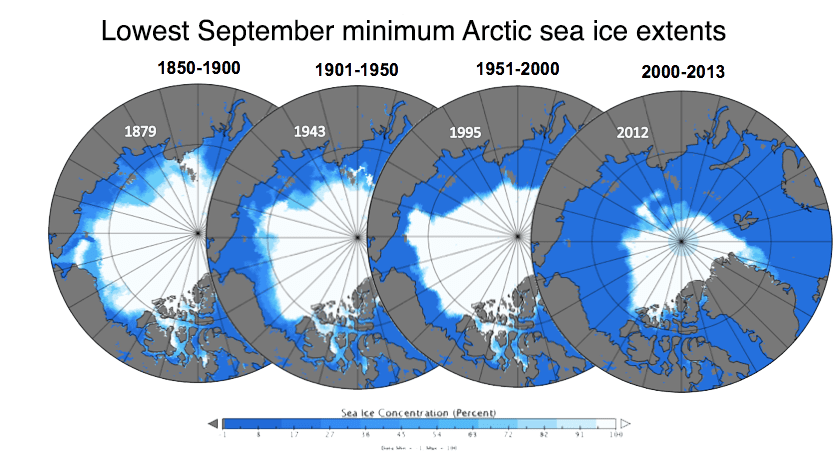
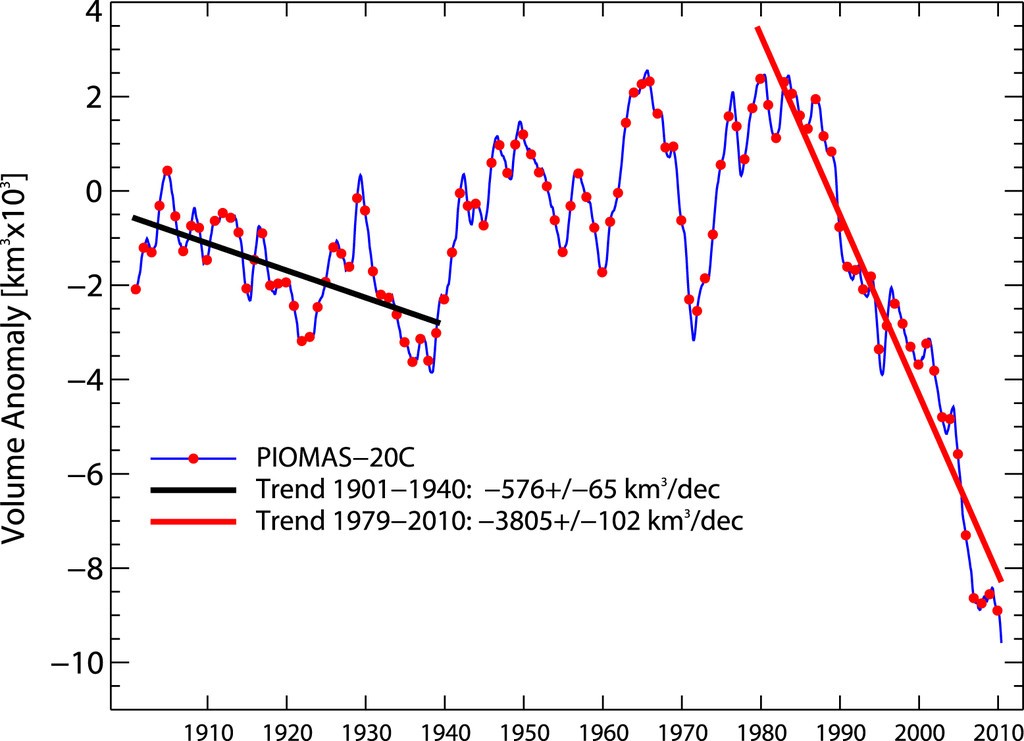
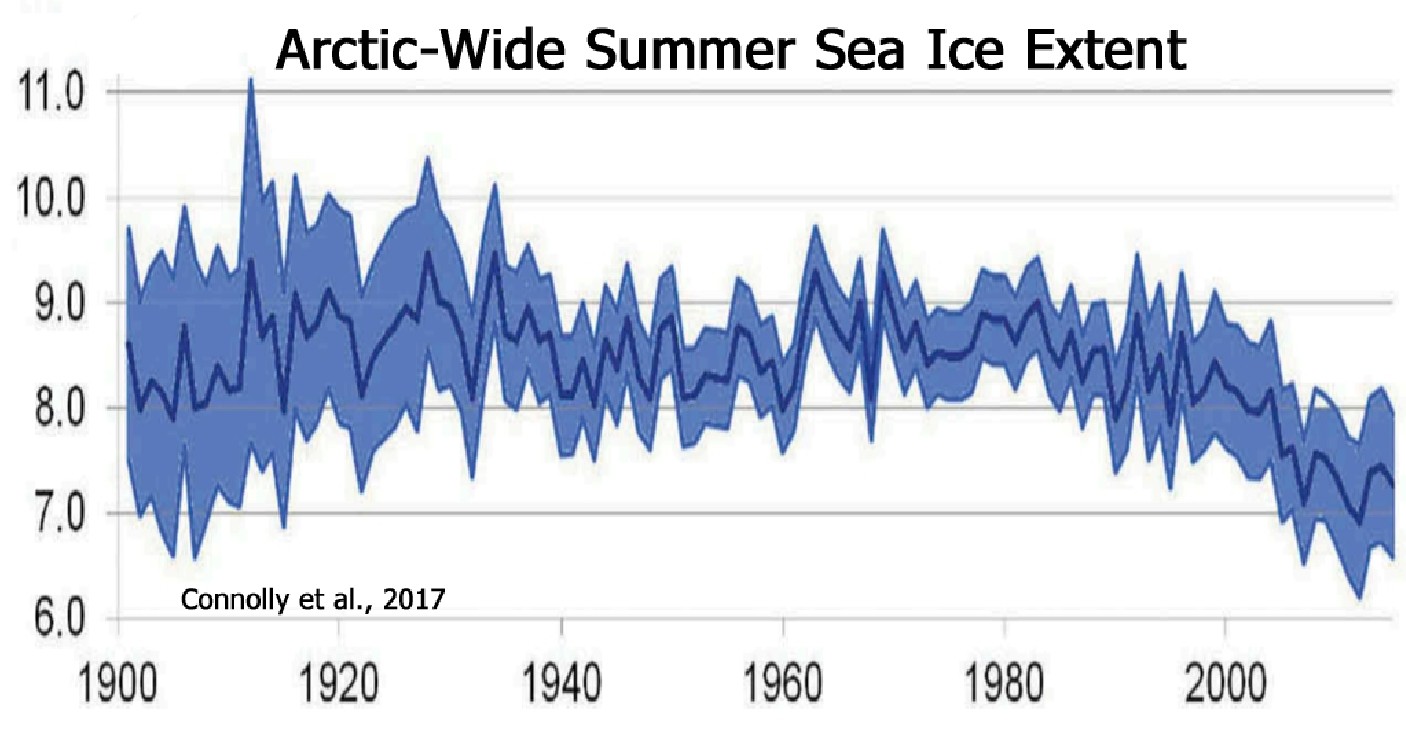
The graph in skeptical science is taken from the 3rd link i sent you, which is a peer review scientific paper. The graph is based on observed satellite data, are you saying this graph is fake? I can provide NASA link if you want to, showing similar graphs, but you know better?

I need to start work, but which chart are you referring to? Obviously modern satellite data is accurate.
 
I don't think it's "clearly false" at all. There is evidence pointing to extremely rapid glacier melt in that decade, but the data is not of high quality. You've pointed me to skepticalscience.com which is as rabidly pro-warming as any denier site is anti-.

Was just looking up the science on polar warming because the fact that it accounts for the lion's share of total warming is not often discussed, and it appears that it's because climate scientists cannot speak authoritatively on the subject.

Sure arctic ice didn't change, all sat. data is a conspiracy. The Roll eyes smiley is nearly not enough


Figure5b-2.png
 

Log in to remove this ad.

1943 (hand-picked year?) is obviously not satellite data.

Did you read this? there is a reason why its 1943

An earlier period of unusually low summer sea ice extent around 1937 to 1943 (as compared to the 1850 to 2013 average) did not extend to the winter season, and was followed by a few years of significantly higher-than-average summer ice extents.
 
Did you read this? there is a reason why its 1943

An earlier period of unusually low summer sea ice extent around 1937 to 1943 (as compared to the 1850 to 2013 average) did not extend to the winter season, and was followed by a few years of significantly higher-than-average summer ice extents.

No I didn't read, I looked at the chart you presented and still don't understand why we are talking about satellite data and the 1940's.
From the 1920s to the 1940s, the Artic experienced significant warming that is comparable to the recent 30-year warming.

https://www.sciencedirect.com/science/article/pii/S1873965211000053

Gotta go.
 
No I didn't read, I looked at the chart you presented and still don't understand why we are talking about satellite data and the 1940's.


https://www.sciencedirect.com/science/article/pii/S1873965211000053

Gotta go.

Ok, let me help then,

full-jcli-d-19-0008.1-f13.jpg


Eiher way your initial argument the Arctic ice caps is the same as 1940 is clearly false, how many papers do i need to show you to prove this? You won't be convninced cause of you know, 'conspiracy' but these are proper scientific papers i am quoting, not blogs or fossil fuel funded papers.Anyway i am not here to convince you.

Mate you're citing reconstructions by models now, not observations. I could cite this reconstruction:

Arctic-Sea-Ice-Extent-Summer-Connolly-2017.jpg


My comment about polar melt being "about where it was in the 1940s" was based on something I read years ago, perhaps 10-12. But for the sake of ending this, I concede that polar melt is significantly worse today than was likely the case in the 1940s.

That's summer sea ice index only, but ok.

What's worrying is what happened since 1975, the paper states:

“The volume of sea ice in the Arctic Ocean today and the current rate of loss are unprecedented in the 110-year record,”

Your graph still shows a considerable amount of decline from 1975 onwards, 2/3rd of the temp. rise been recorded from 75 onwards, so your graph shows exactly the result of the increase in temp.
 

(Log in to remove this ad.)

We are past the ‘it might happen’ on the timeline. It’s actually happening

Maybe our out and out deniers are advocating a military build up so we can fight over the scraps which remain viable
 
It’s more the maintenance of things in fine balance, with more than a few percent off balance being fairly catastrophic.

The sustenence of earth as a viable life supporting planet (take quick look at dead planets around us)

The sustenance of living systems on the surface of earth

The complex infrastructure systems we have built which keep us alive in great numbers


I’m amazed that certain people who are seen as thought leaders look at Mars and think ‘we can terraform that and people can live there’

Why aren’t they getting the message ‘oh it looks like there was water and a maybe a liveable planet once. Heed the lesson. Maybe we need to take greater care of the one we’ve got.

Ironically terraforming Mars or repairing earth would use pretty much the same technology and application, collaboration. Just about a BILLION BILLION BILLION times easier in the case of the earth
 
published in the journal Quaternary Science Reviews calculates that the 56 million indigenous deaths across the Americas caused by disease and European-led massacres led to the overgrowth and reforesting of large tracts of agricultural land, contributing to a 0.15C degree drop in the early 1600s known as the Little Ice Age.
 
That's summer sea ice index only, but ok.

What's worrying is what happened since 1975, the paper states:

“The volume of sea ice in the Arctic Ocean today and the current rate of loss are unprecedented in the 110-year record,”

Your graph still shows a considerable amount of decline from 1975 onwards, 2/3rd of the temp. rise been recorded from 75 onwards, so your graph shows exactly the result of the increase in temp.

So for a planet that has been in existence for Billions of years and habitable for hundreds of millions of years, we're going to zoom in on a 110 year period.

Do you think it's not possible to zoom in on a 110 year period during any other time over millions of years and find similar charts/ results?

I hope you can understand and appreciate the point I am making


No doubt the Earth is very likely albeit not certain to correct itself from a 110 year period "blip".


The question is, during that "blip" how many species will go the way of the 99% species that have already become extinct over those hundreds of millions of years? And will that include us?
 
No doubt the Earth is very likely albeit not certain to correct itself from a 110 year period "blip".


The question is, during that "blip" how many species will go the way of the 99% species that have already become extinct over those hundreds of millions of years? And will that include us?

You completely missed the point... nevermind
 
You completely missed the point... nevermind


Is your point that there is no correlation between extreme short-term trends in climate and increased extinction?

Does it matter how often or for what reason the Earth's climate goes through extreme changes even for a short period of time... if the end result is possibly mass and/or human extinction?
 
Status
Not open for further replies.
Back
Top