Society/Culture Climate Change put on hold for a few decades

Remove this Banner Ad

Even the most fervent of warmists admits they arent sure the feedback of water vapour


The sensitivity of increased CO2 is not determined precisely. Who claims it is?

We're not talking about sensitivity, we're talking about radiative forcing, but, since you ask...

The sensitivity attributed to water and CO2 are pretty stable, they were calculated back in the 1890's to a high degree of accuracy, and revisited in the 50's in a way that is generally accepted. The real uncertainty lies with fedbacks. Btu, where the **** is your evidence, Goebbels? Repeating something doesn't make it true.

http://www.realclimate.org/index.php/archives/2010/01/the-carbon-dioxide-theory-of-gilbert-plass/
 
Btu, where the **** is your evidence, Goebbels? Repeating something doesn't make it true.

What are you on today? A wide range is given for the estimate of the sensitivity of climate to co2 increase.

http://www.realclimate.org/index.php/archives/2006/03/climate-sensitivity-plus-a-change/

Almost 30 years ago, Jule Charney made the first modern estimate of the range of climate sensitivity to a doubling of CO2. He took the average from two climate models (2ºC from Suki Manabe at GFDL, 4ºC from Jim Hansen at GISS) to get a mean of 3ºC, added half a degree on either side for the error and produced the canonical 1.5-4.5ºC range which survived unscathed even up to the IPCC TAR (2001) report. Admittedly, this was not the most sophisticated calculation ever, but individual analyses based on various approaches have not generally been able to improve substantially on this rough estimate, and indeed, have often suggested that quite high numbers (>6ºC) were difficult to completely rule out. However, a new paper in GRL this week by Annan and Hargreaves combines a number of these independent estimates to come up with the strong statement that the most likely value is about 2.9ºC with a 95% probability that the value is less than 4.5ºC.
 
Here's the graph of forcings for various materials.

I won't uglify the thread with it.

http://upload.wikimedia.org/wikiped...forcings.svg/600px-Radiative-forcings.svg.png

The graph uses the term "estimate", nothing is "proven" here as you said. CO2 is about 1.7 w/m2, you said 32.

There are various definitions which are all very complicated, I'll quote a couple of lines

In this report radiative forcing values are for changes relative to preindustrial conditions defined at 1750 and are expressed in watts per square metre (W/m2).":36

and

"...the rate of energy change per unit area of the globe as measured at the top of the atmosphere."[

It seems they have quoted the RF as the estimated additive effect at 1750.

I don't see anything that would allow someone to say CO2s greenhouse effect is proven and is "this" much.
 

Log in to remove this ad.

We're not talking about sensitivity, we're talking about radiative forcing, but, since you ask...

The sensitivity attributed to water and CO2 are pretty stable, they were calculated back in the 1890's to a high degree of accuracy, and revisited in the 50's in a way that is generally accepted. The real uncertainty lies with fedbacks. Btu, where the **** is your evidence, Goebbels? Repeating something doesn't make it true.

http://www.realclimate.org/index.php/archives/2010/01/the-carbon-dioxide-theory-of-gilbert-plass/


Unless your discussing disappearing glaciers with the IPCC.........
 
Here's my source, where's yours?

The authors find that for the clear sky case the contribution due to water
vapor to the total longwave radiative forcing is 75 W m-2, while for carbon dioxide it is 32 W m-2
http://www.cgd.ucar.edu/cas/papers/KiehlTrenbBAMS97.pdf

If you have something better than Wikipedia, then lets see it.

But, I like the way you've switched tack from trying to discount W/m-2 as a measurement to trying to cast doubt on the veracity of that particular figure. That's one way of admitting you were wrong, I guess :rolleyes:
 
What are you on today? A wide range is given for the estimate of the sensitivity of climate to co2 increase.

Not that wide a range, and my (lol, I should say the generally accepted) figure falls close to the middle of that range :rolleyes:

Anyway, as I said, we were talking about radiative forcing, not sensitivity.
 
That graph is prefaced with "2005 radiative forcings as estimated by the IPCC."

You'd have to agree that there's a hell of a difference between 32 and 1.7.

And no, on the contrary, this gets exactly to my point.

You write a response to someone, Frodo, where you're quoting those figures, you're doing this in a sub-forum of a AFL football forum. You're replying to someone who's current knowledge you know little about, and yet, AND YET, you quote numbers in your post (falsely stated as "proven") that would only be relevant if that person and yourself were currently aware of and understood the following

The radiative forcing of the surface-troposphere system due to the perturbation in or the introduction of an agent (say, a change in greenhouse gas concentrations) is the change in net (down minus up) irradiance (solar plus long-wave; in Wm-2) at the tropopause AFTER allowing for stratospheric temperatures to readjust to radiative equilibrium, but with surface and tropospheric temperatures and state held fixed at the unperturbed values. [2]

And even then as we see with 32 and 1.7 and also the 1750 reference the figures themselves are highly debatable and are quoted as a snapshot in time and would need that reference point included to be meaningful.

What it is is you posting stuff you don't understand and they don't understand and everyone is supposed to shut up at that point because you said "proven" and wrote about stuff that people in this forum don't have the background knowledge to debate.
 
The other scares were based on scientific advice to the government.
How are they "scares"? Why use that term unless you're specifically trying to portray them as empty and of no consequence?
 
That graph is prefaced with "2005 radiative forcings as estimated by the IPCC."

You'd have to agree that there's a hell of a difference between 32 and 1.7.

And no, on the contrary, this gets exactly to my point.

You write a response to someone, Frodo, where you're quoting those figures, you're doing this in a sub-forum of a AFL football forum. You're replying to someone who's current knowledge you know little about, and yet, AND YET, you quote numbers in your post (falsely stated as "proven") that would only be relevant if that person and yourself were currently aware of and understood the following


And even then as we see with 32 and 1.7 and also the 1750 reference the figures themselves are highly debatable and are quoted as a snapshot in time and would need that reference point included to be meaningful.

What it is is you posting stuff you don't understand and they don't understand and everyone is supposed to shut up at that point because you said "proven" and wrote about stuff that people in this forum don't have the background knowledge to debate.

Lmao @ your shift in attack, it's just a pathetic game of 'gotchya', isn't it? It's sad because you don't understand this s**t either but are happy to cast doubt in the minds of others out of a pathetic inclination to trip me up. Ain't gonna happen sunny boy Jim!

The 1.6 figure is the change in downward flux since preindustrial times. Radiative forcing is usually defined as the change in downward radiation from pre-industrial times until now. Roughly speaking, the downward flux from CO2 in pre-industrial times would’ve been around 30 Wm-2. Because of increasing CO2 levels, this has increased to 32 Wm-2 (this is a bit of an oversimplification as different greenhouse gases overlap in their absorption bands). So the radiative forcing – the change in downward flux from CO2 since pre-industrial times – is around 2 Wm-2. More accurately, it’s actually around 1.66 Wm-2
 
What are you on today? A wide range is given for the estimate of the sensitivity of climate to co2 increase.

http://www.realclimate.org/index.php/archives/2006/03/climate-sensitivity-plus-a-change/

Almost 30 years ago, Jule Charney made the first modern estimate of the range of climate sensitivity to a doubling of CO2. He took the average from two climate models (2ºC from Suki Manabe at GFDL, 4ºC from Jim Hansen at GISS) to get a mean of 3ºC, added half a degree on either side for the error and produced the canonical 1.5-4.5ºC range which survived unscathed even up to the IPCC TAR (2001) report. Admittedly, this was not the most sophisticated calculation ever, but individual analyses based on various approaches have not generally been able to improve substantially on this rough estimate, and indeed, have often suggested that quite high numbers (>6ºC) were difficult to completely rule out. However, a new paper in GRL this week by Annan and Hargreaves combines a number of these independent estimates to come up with the strong statement that the most likely value is about 2.9ºC with a 95% probability that the value is less than 4.5ºC.

You're confusing radiative forcing for climate sensitivity, those calculations are based on uncertainties in measuring feedbacks, hence the wide range in the values. The radiative forcing value of CO2 is well understood.
 
It has been proven that the grenhouse effect is real, that the radiative forcing of CO2 is 32 W/m2, that water vapour has a radiative forcing of 75 W/m2 and amplifies CO2's radiative forcing by 100%, and that CO2 concentrations have risen by nearly 40% and are on track to double by 2100. What about this do you dispute?

Emphasis mine.

http://www.cgd.ucar.edu/cas/papers/KiehlTrenbBAMS97.pdf

The budget in Fig. 7 is based on the results that do not include any additional atmospheric solar absorption that may be present, as discussed in section 3.

The values put forward in Fig. 7 are reasonable but clearly not exact. The purpose of this paper is not so much to present definitive values, but to discuss how they were obtained and give some sense of the uncertainties and issues in determining the numbers.

Science is settled so shut up.
 
LOL, lame as s**t, you are just trying to find any mention of uncertainty and exploit it, but what you can't do if present anything that contradicts the universally accepted values, you don't have it, you're argument isn't based on anything at all other than a burning desire to prove me wrong, which, one again you have failed miserably at. Maybe you should give it up and make an effort to undestand the scientific basis for GW before launching off into half cocked attempts at finding flaws in it. You're an absolute reject.
 

(Log in to remove this ad.)

So lets see:

1. The world is not warming

2. The polar bears are thriving

3. The glaciers are not melting

4. The Arctic Ice is not disappearing

5. Ice thikening in Antartica

6. Scientists caught manipulating data

Sounds like a scam to me and most of the people in the world. Poor old Barak Obama will be doing nothing re climate, will be lucky to get a second term. The Global Warming (oh yes 'climate' change now that warming is not happening) is:

DEAD!

But there is hope for fools like BP, the next scam is a shortage of oxygen. Get on board early BP, you can be the Tim 'no water in Adelaide' Flannery of oxygen shortages.
 
So lets see:


Sounds like a scam to me and most of the people in the world. Poor old Barak Obama will be doing nothing re climate, will be lucky to get a second term. The Global Warming (oh yes 'climate' change now that warming is not happening) is:

DEAD!

But there is hope for fools like BP, the next scam is a shortage of oxygen. Get on board early BP, you can be the Tim 'no water in Adelaide' Flannery of oxygen shortages.

LOL, You read a lot of Andrew Bolt, don't you?


1. The world is not warming

Uh, yeah it is, 2009 was the 5th warmest year on record, it was the hottest on record for the southern hemisphere - despite being the depest solar minimum for a century. 2010 is well on track for a severe El Nino and has a high likelihood of being THE warmest year on record.

2. The polar bears are thriving

Nonsense, polar bear populations are declining.

3. The glaciers are not melting

Again, utter nonsense, there isn't a glacial region on the planet that isn't in decline

4. The Arctic Ice is not disappearing

Again, utter twaddle

5. Ice thikening in Antartica

Wrong again, West Antarctica has been losing mass for a long time now, and more worryingly E. Antarctica, which wasn't predicted to lose mass for at least another century, appears to be in decline

6. Scientists caught manipulating data

No, they were accused of doing so based on miscontextualised readings of a handful of private emails, but there is no evidence that even their supposed worst transgressions ever actually occurred. And even if they had, they are three or four researchers working on one or two streams of evidence out of the hundreds that show the same thing, that the earth is clearly warming in response to human activity.

You should really stop getting your science news from the op-ed's of Murdoch rags, Morgy!
 
Arctic ice extent is up quite a bit in the last couple of years.

Re Antarctic

http://www.news.com.au/antarctic-ice-is-growing-not-melting-away/story-0-1225700043191

Australian Antarctic Division glaciology program head Ian Allison said sea ice losses in west Antarctica over the past 30 years had been more than offset by increases in the Ross Sea region, just one sector of east Antarctica.

"Sea ice conditions have remained stable in Antarctica generally," Dr Allison said
..

re Polar Bears

http://scienceandpublicpolicy.org/images/stories/papers/reprint/taylor_polar_bears.pdf

During the last 30 years, it is generally agreed that polar bear numbers have
increased as a response to improved conservation measures (harvest controls).

.........

Why do you persist?
 
Arctic ice extent is up quite a bit in the last couple of years.

No it's not, it might be up slightly from the record lows of 2007 (but even that is disputable) but it is still at historic lows

http://nsidc.org/sotc/sea_ice.html

Re Antarctic

http://www.news.com.au/antarctic-ice-is-growing-not-melting-away/story-0-1225700043191

Australian Antarctic Division glaciology program head Ian Allison said sea ice losses in west Antarctica over the past 30 years had been more than offset by increases in the Ross Sea region, just one sector of east Antarctica.

"Sea ice conditions have remained stable in Antarctica generally," Dr Allison said

Yah, no one has ever said Antarctic sea ice was depleting, the Southern Ocean is cold, we know that.

If the Southern Ocean is warming, why is Antarctic sea ice increasing? There are several contributing factors. One is the drop in ozone levels over Antarctica. The hole in the ozone layer above the South Pole has caused cooling in the stratosphere (Gillet 2003). This strengthens the cyclonic winds that circle the Antarctic continent (Thompson 2002). The wind pushes sea ice around, creating areas of open water known as polynyas. More polynyas leads to increased sea ice production (Turner 2009).
Another contributor is changes in ocean circulation. The Southern Ocean consists of a layer of cold water near the surface and a layer of warmer water below. Water from the warmer layer rises up to the surface, melting sea ice. However, as air temperatures warm, the amount of rain and snowfall also increases. This freshens the surface waters. So now you have a surface layer that is less dense than the saltier, warmer water below. The layers become more stratified and mix less. Less heat is transported upwards from the deeper, warmer layer. Hence less sea ice is melted (Zhang 2007).

^^ This is exactly what climate models have predicted for well over twenty years!

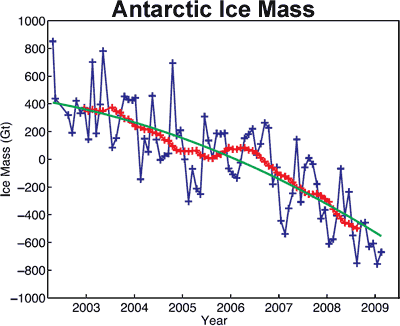
But, despite what your News Corp (lol!) link claims, Antarctica has had a negative mass balance

Antarctica_Ice_Mass.gif

Figure 2: Ice mass changes for the Antarctic ice sheet from April 2002 to February 2009. Unfiltered data are blue crosses. Data filtered for the seasonal dependence are red crosses. The best-fitting quadratic trend is shown as the green line (Velicogna 2009).


And no matter how you try to ignore it, the evidence suggests that even the East Antarctica is starting to lose ice mass, a good 50 years before predicted

http://www.skepticalscience.com/East-Antarctica-is-now-losing-ice.html

..

re Polar Bears

http://scienceandpublicpolicy.org/images/stories/papers/reprint/taylor_polar_bears.pdf

During the last 30 years, it is generally agreed that polar bear numbers have
increased as a response to improved conservation measures (harvest controls).

.........

Right, so, just to humour you for a moment, any increase actually has to do with conservation efforts?! That says NOTHING about GW!

At any rate, despite what your think tank propaganda says, the facts are clear, polar bear populations are in decline, even if a few populations have bucked that trend

http://www.iucnredlist.org/apps/redlist/details/22823/0

Why do you persist?

LOL, I'm not the one desperately railing against ALL scientific evidence! The real question is why do you persist, I think it has to do with some sort of autistic tendency on your part to never admit that you might possibly have been wrong and hitched your horse to the wrong wagon!
 
No it's not, it might be up slightly from the record lows of 2007 (but even that is disputable) but it is still at historic lows

a) it has increased in the last couple of years, that is beyond doubt
b) thus by definition it cant be at historic lows.

But, despite what your News Corp (lol!) link claims, Antarctica has had a negative mass balance

They quoted from elsewhere

"Australian Antarctic Division glaciology program head Ian Allison said "

At any rate, despite what your think tank propaganda says, the facts are clear, polar bear populations are in decline, even if a few populations have bucked that trend

That is simply wrong

further only two areas were found to be threatened re loss of ice.

http://scienceandpublicpolicy.org/images/stories/papers/reprint/taylor_polar_bears.pdf

Generally, polar bears currently appear to be as abundant as, or more abundant than at present as they have
ever been in modern times (Table 1).


Although two polar bear subpopulations (Western Hudson Bay and Southern Beaufort Sea) no longer appear to be viable due to reduction in sea ice habitat, polar bears as a species do not appear to be threatened by
extinction in the foreseeable future from either a demographic or an ecological perspective.

LOL, I'm not the one desperately railing against ALL scientific evidence!

You sure are

You defend Gore and the HS FFS
 
a) it has increased in the last couple of years, that is beyond doubt
b) thus by definition it cant be at historic lows.

Are you just going to keep ignoring the links provided?

They quoted from elsewhere

"Australian Antarctic Division glaciology program head Ian Allison said "

You miss the point, for starters News have misrepresented Dr. Allison, secondly no one has ever said that E. Antarctica should be losing ice, and thirdly, that doesn't in the slightest take into account the latest satellite measurements that show that E Antarctic may indeed be losing mass.

That is simply wrong

further only two areas were found to be threatened re loss of ice.

http://scienceandpublicpolicy.org/images/stories/papers/reprint/taylor_polar_bears.pdf

Generally, polar bears currently appear to be as abundant as, or more abundant than at present as they have
ever been in modern times (Table 1).


Although two polar bear subpopulations (Western Hudson Bay and Southern Beaufort Sea) no longer appear to be viable due to reduction in sea ice habitat, polar bears as a species do not appear to be threatened by
extinction in the foreseeable future from either a demographic or an ecological perspective.

Yes, keep quoting your think tank, and be damned any evidence that isn't ideologically pure!

More Polar Bear Populations in Decline
By ANDREW C. REVKIN
polar bears swimming USGS Polar bears swimming in the Arctic Ocean.

There is rising concern among polar bear biologists that the big recent summertime retreats of sea ice in the Arctic are already harming some populations of these seal-hunting predators. That was one conclusion of the Polar Bear Specialist Group, a network of bear experts who met last week in Copenhagen to review the latest data (and data gaps) on the 19 discrete populations of polar bears around the Arctic. The group, part of the International Union for Conservation of Nature, includes biologists in academia and government and at nonprofit conservation organizations. Only one bear population is increasing (in the Canadian high Arctic), while eight are declining in numbers, the scientists said. At its last meeting, in 2005, the group concluded that five populations were in decline. Three populations appear to be stable and seven are too poorly monitored to gauge a trend.
You sure are

You defend Gore and the HS FFS

And you keep repeating nonsense no matter how many times it is shown to be utter bunkum. You're a blind ideologue who just will not let go and accept the fact that you picked the wrong horse years ago.
 
http://www.skepticalscience.com/East-Antarctica-is-now-losing-ice.html

The comments are worth reading at that site, comments by scientists who at least sound like they know what they're talking about, such as...

My understanding for East Antarctic is that there is a positive anomaly in the GRACE data. From Chen and many others this is put down to GIA i.e. the land is rising and depending on how much you believe is occuring this leads to stasis or falling ice mass. The Tregoning paper suggests using GPS data that the positive anomaly can't be put down to GIA therefore it must be due to ice/snow accumulation. It should be noted that the work was done on coastal regions.

So one method says stasis followed by ice loss while another says ice gain followed by stasis. I think this does change the picture. I also think it does change a fundamental pillar of the antarctic picture.

Settled science....
 
You ****ing numpty! Whoever ever claimed that the E Antarctic ice mass was "settled", look at every post I've ever made on the subject, you'll notice the word "may" being bandied around a lot. And whether or not EA is losing or gaining mass has nothing to do with whether the science is settled or not, it doesn't need to be losing mass for the science of GW to be settled, no one ever predicted that it would this side of 2100, it is simply a new piece of evidence to add to the whole picture. But if it is then we are in deeper s**t than we ever imagined.
 

Remove this Banner Ad

Back
Top