Steve Dore
International Trade Facilitator
- Aug 30, 2004
- 36,121
- 64,973
- AFL Club
- Port Adelaide
- Other Teams
- Vikings, Canadiens, Sharks
Did they read out KT's email?
Follow along with the video below to see how to install our site as a web app on your home screen.
Note: This feature may not be available in some browsers.
True for too many, but there are also far too many who are being stubborn bastards.Sadly lots of them are probably isolated with no contact with their families and have to shop for themselves. Or too stubborn to stop.
You know that Geoff is a Baby Boomer and deserves to die from COVID-19 right?Just as we get Geoff Morris in to help with our skills this happens ☹
The Uni of Sydney ran a computer simulation that attempted to model the whole population of Australia. It started by creating the software equivalent of 24m Aussies, then applied assumptions about inter-personal contact rates and virus transmissions rates. It then ran scenarios for different degrees of compliance with social distancing.Very compelling if accurate.
Surely the graph would look different depending on which groups were isolated. i.e. anyone overseas or in contact with those overseas or with family overseas and who have disposable income. Bang isolation with an eye being kept on them. Those who have not been out of SA for the last year. No isolation. Extreme cases, but do you get my drift?
The bottom line is to me that curve looks very different depending on who the 70% are who are isolated, or who the 10% between 70% and 80% are who decide not to isolate.
Another hypothetical, those who choose not to isolate are most likely to be those who has the means not to isolate, and who think the rules shouldn't apply to them. Surely that is a demographic we can target (it sounds like the young and the rich doesn't it?).
Just food for thought. A case could be made for those who are most at risk. The elderly should theoretically be the most isolated and provided with the means to stay with loved ones via techniology as a priority until the spread is contained and has reached an acceptably downward trend.
 This government is a genuine joke.
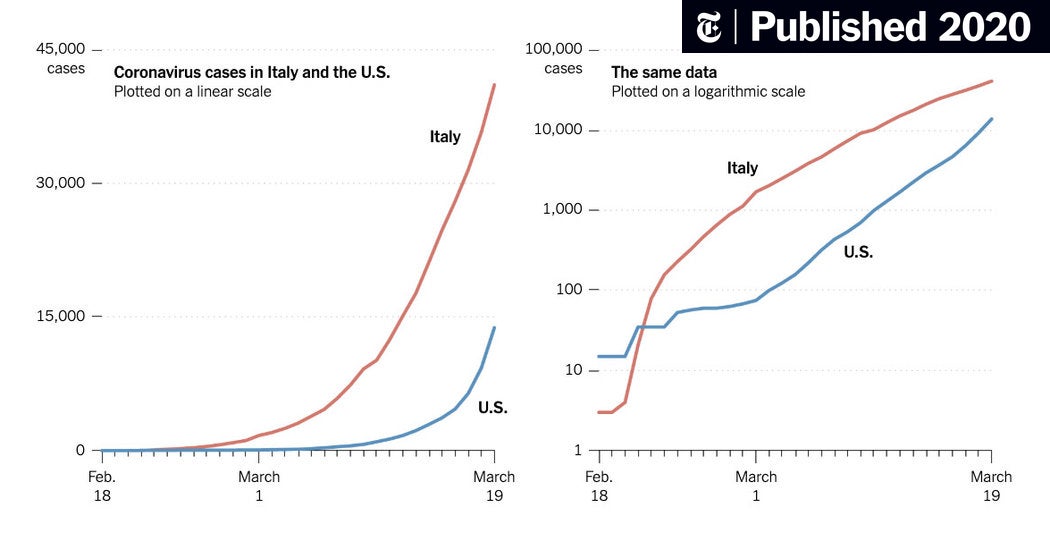
Please be rightA Different Way to Chart the Spread of Coronavirus (Published 2020)
Those skyrocketing curves tell an alarming story. But logarithmic graphs can help reveal when the pandemic begins to slow.www.google.com
Logarithmic graphs are the best way to track a pandemic. You cant just assume continued exponential growth.
China and Korea have well and truly turned the corner.
Italy and Iran despite their total cases going up have started to flatten the curve if you look at worldometer.com and will turn the corner soon.
Australia is not that far behind.
This will all be settling down much sooner than predicted and way before a vaccine eventuates.
Looking at the logarithmic graphs and comparing it to other countries (where all fitting the China and Korea bell curves) I predict Australia curve to start to flatten in the next few days, for us to hit peak total cases in 2-3 weeks and for the total cases to be half that number 2-3 weeks later.
On SM-G960F using BigFooty.com mobile app

You haven't quite taken into account that we haven't even entered flu season yet and other countries have come out of them which will no doubt make this worse for us in the coming months. You're also banking on the restrictions that we are at now will take effect in the coming weeks.A Different Way to Chart the Spread of Coronavirus (Published 2020)
Those skyrocketing curves tell an alarming story. But logarithmic graphs can help reveal when the pandemic begins to slow.
Logarithmic graphs are the best way to track a pandemic. You cant just assume continued exponential growth.
China and Korea have well and truly turned the corner.
Italy and Iran despite their total cases going up have started to flatten the curve if you look at worldometer.com and will turn the corner soon.
Australia is not that far behind.
This will all be settling down much sooner than predicted and way before a vaccine eventuates.
Looking at the logarithmic graphs and comparing it to other countries (where all fitting the China and Korea bell curves) I predict Australia curve to start to flatten in the next few days, for us to hit peak total cases in 2-3 weeks and for the total cases to be half that number 2-3 weeks later.
On SM-G960F using BigFooty.com mobile app

That's why I look at ones like these two, a deaths logarithmic graphsA Different Way to Chart the Spread of Coronavirus (Published 2020)
Those skyrocketing curves tell an alarming story. But logarithmic graphs can help reveal when the pandemic begins to slow.
Logarithmic graphs are the best way to track a pandemic. You cant just assume continued exponential growth.
China and Korea have well and truly turned the corner.
Italy and Iran despite their total cases going up have started to flatten the curve if you look at worldometer.com and will turn the corner soon.
Australia is not that far behind.
This will all be settling down much sooner than predicted and way before a vaccine eventuates.
Looking at the logarithmic graphs and comparing it to other countries (where all fitting the China and Korea bell curves) I predict Australia curve to start to flatten in the next few days, for us to hit peak total cases in 2-3 weeks and for the total cases to be half that number 2-3 weeks later.
On SM-G960F using BigFooty.com mobile app


Can't believe the s**t that's being dribbled out of the chief medical officers mouth. He thinks we may end up going into a full lockdown but won't go now? and the 30 minute haircut law changed overnight because "like everything it changes from day to day"
The royal commission in 2025 will be enormous.
The chief medical officer isn't a virologist or an expert in epidemiology and infectious diseases. If the CMO's expertise were those fields he/she probably would have pushed the government harder.The longer this goes on the more I think the chief medical officer is a liberal party stooge. Completely at odds with the medical profession it seems
The chief medical officer isn't a virologist or an expert in epidemiology and infectious diseases. If the CMO's expertise were those fields he/she probably would have pushed the government harder.
His field of expertise is kidneys and then moved into work on cancer. He has sat/sits on lots healthcare industry boards and was CEO of Austin Health before he got the gig as CMO.
His deputy Dr Paul Kelly makes gravy -ohps that's for the dad joke thread. Kelly is an epidemiologist and you will notice a slightly different emphasis when he talks about things compared to Dr Brendan Murphy.
They are all getting different opinions and they have to balance up health needs with what they think they can sell to society and at what stage as this develops.
Couldn't pay me enough for me to want to do their jobs.
 yarn.co
The chief medical officer isn't a virologist or an expert in epidemiology and infectious diseases. If the CMO's expertise were those fields he/she probably would have pushed the government harder.
His field of expertise is kidneys and then moved into work on cancer. He has sat/sits on lots healthcare industry boards and was CEO of Austin Health before he got the gig as CMO.
His deputy Dr Paul Kelly makes gravy -ohps that's for the dad joke thread. Kelly is an epidemiologist and you will notice a slightly different emphasis when he talks about things compared to Dr Brendan Murphy.
They are all getting different opinions and they have to balance up health needs with what they think they can sell to society and at what stage as this develops.
Couldn't pay me enough for me to want to do their jobs.
The funny thing is the businesses that are still open , retail , barbers ect all want a full lockdown anyway as they're not getting business , they feel unsafe and they can't access the governments financial rescue package if they're made to stay open. What a mess. Hopefully Victoria and NSW go ahead tomorrow.
With everyone panic buying alchohol now we expect to get busy and bringing forward wines that were planned to be bottled june/July to the next few weeks..The funny thing is the businesses that are still open , retail , barbers ect all want a full lockdown anyway as they're not getting business , they feel unsafe and they can't access the governments financial rescue package if they're made to stay open. What a mess. Hopefully Victoria and NSW go ahead tomorrow.