Grand Solar Minimum

Remove this Banner Ad

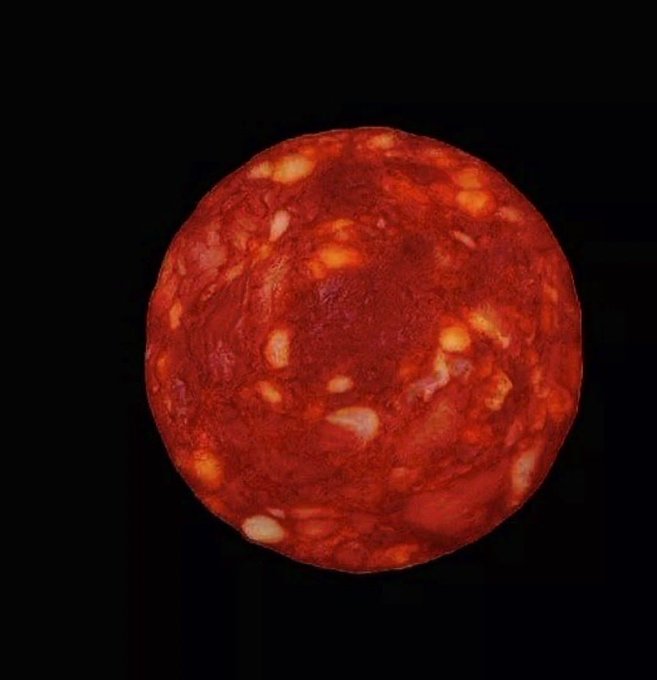
Exiting news, top French scientist Etienne Klein has just posted an image from the James Webb space telescope of Proxima Centauri , the nearest star to our sun. If you wanted to travel to this star I suggest you take some lunch along, my own preference is for pizza. Proxima is 4.2 light years away. " A new world is revealed every day" Klein said.


FZAV0R1XoAEXE14

We have many images of Proxima Centauri. Voyager 1 & 2 were launched in the direction of that star system but will take 70,000 years to reach there at their current speed which will not change with no further propulsion available.
 
We have many images of Proxima Centauri. Voyager 1 & 2 were launched in the direction of that star system but will take 70,000 years to reach there at their current speed which will not change with no further propulsion available.
I love this website: Voyager - Mission Status
 

Log in to remove this ad.

NASA’s James Edward Hansen, ‘the father of global warming’, is on record as saying, back in 1989: “The West Side Highway [of New York City, which runs along the Hudson River] will be under water [by 2009!]” due to glacial melting. Hanson continued, doubling down on the absurdities: “There will be tape across the windows across the street because of high winds. And the same birds won’t be there. The trees in the median strip will change.”

The summer of 2022 has delivered colder-than-average temperatures across Greenland, readings well-below the multidecadal norm.

The latest data point from the Danish Meteorological Institute, an agency charged with tracking Greenland’s Surface Mass Balance (SMB)–a calculation used to determine the ‘health’ of a glacier–shows impressive GAINS across the ice sheet.

We’re in the middle of summer. Moreover, we’re in the middle of the summer of 2022; by now, according to AGW Party scripture, Greenland should be ice-free and, as a result, coastal cities around the globe should be submerged.
 
Northern Hemisphere sea ice has held strong during 2022.

It has refused to melt not only as scheduled by the season but also as demanded by AGW Party scripture.

Wherever you look–whether that be Alaska, the Arctic, or Greenland–sea ice this summer is proving very robust and stubborn.

Taking Greenland, for example, the ice sheet actually saw snow/ice GAINS on Monday, Aug 8 — a reality that the MSM–no surprise–has refused to report on, despite its rarity and despite its obvious signal that the end may not be so nigh, after all.
 

JULY IN ANTARCTICA WAS ANOTHER COLDER-THAN-AVERAGE MONTH

Antarctica’s provisional average temperature for July is in, and as expected, it was a cold month across the bottom of the world.


The South Pole Station logged an average temperature of -61.2C (-78.2F) last month, which is a full -1C below the 1991-2020 baseline and some -1.4C below the 1981-2010 average–a further indication that the Antarctic continent has actually been COOLING in recent decades.
Given the above is sea ice levels below the average due to land ice not calving, makes sense to me.
 
Last edited:
How weird is that? Talks about pizza as if that has anything to do with this?

Except that it looks very much like a backlit slice of pepperoni! 🤡

View attachment 1468789
Wrong. It was apparently a backlit slice of chorizo!

I guess some people are so used to believing everything they are told to believe is true, they lack a questioning mind and critical thinking.

 
It's like the OP discovered the sun has a solar cycle and in the excitement of it all, he then exploded into a supernova himself.
 
“Something unusual may be happening to the sun’s magnetic dynamo beneath the surface where this sunspot is growing,” postulates Dr Tony Philips of spaceweather.com. “We’ll keep an eye on AR3088 to see what happens next,” he concludes.
 

NOAA CHARTS REVEAL GLOBAL COOLING IS INTENSIFYING

NOAA shows that the rate of Earth’s cooling has increased during 2022–thank you to a reader for pointing this out.

The agency’s ‘Global Time Series’ temperature tool plots the current ‘Land and Ocean’ rate of decrease as 0.19C per decade, up from a decrease of 0.11C per decade at the start of the year:

Selected month: Jan (Feb 2016-Jan 2022) decrease of 0.11C per decade
Selected month: Feb (Mar 2016-Feb 2022) decrease of 0.13C per decade
Selected month: Mar (Apr 2016-Mar 2022) decrease of 0.16C per decade
Selected month: Apr (May 2016-Apr 2022) decrease of 0.18C per decade
Selected month: May (Jun 2016-May 2022) decrease of 0.18C per decade
Selected month: Jun (Jul 2016-Jun 2022) decrease of 0.18C per decade
Selected month: Jul (Aug 2016-Jul 2022) decrease of 0.19C per decade
Not only is the Earth cooling, it is cooling at a faster and faster rate.
 

Remove this Banner Ad

Back
Top