Society/Culture Historical temperature record proving climate change a result of fraudulent statistics?

Remove this Banner Ad

Yes, it means that we would grow marginally less than we would have otherwise.

You goose.

3% annually is a massive amount.

http://www.oecd.org/document/40/0,2340,en_33873108_33873229_37149416_1_1_1_1,00.html

Recent macroeconomic performance continues to be impressive: gross domestic product (GDP) growth since the turn of the millennium has averaged above 3% per annum and, including the terms-of-trade gains, growth in real gross domestic income has averaged over 4%, among the handful of OECD countries achieving such rapid growth;

Better than an 5% loss of global GDP, or has high as 20% for individual GDP's in places like India.

Where do you get 20% per annum from?

Treasury made it very clear what the optimal level of mitigation was.

Zero.

And that's not even taking into account higher oil prices, which [strike]if[/strike] when oil reaches $150+ a barell then mitigation will actually lead to economic gains.

Stop trolling. It is getting rather annoying.
 
You goose.

3% annually is a massive amount.

http://www.oecd.org/document/40/0,2340,en_33873108_33873229_37149416_1_1_1_1,00.html

Recent macroeconomic performance continues to be impressive: gross domestic product (GDP) growth since the turn of the millennium has averaged above 3% per annum and, including the terms-of-trade gains, growth in real gross domestic income has averaged over 4%, among the handful of OECD countries achieving such rapid growth;

Well, it's a good thing that mitigation won't cost 3%, because oil prices will most definitely go up between now and 2030. Should push the costs down to blow 1% of GDP, like Stern said.

Where do you get 20% per annum from?

http://www.swissre.com/pws/media centre/news/news_releases_2009/eca_pr.html

Treasury made it very clear what the optimal level of mitigation was.

Zero.

No, Garnaut noted that if Australia could continue the Howard governments policy to emit without consequence, and ride on the coat-tails of a wider global effort to reduce emissions then the optimal mitigation would b zero. He then went on for many paragraphs explaining why this was a flawed approach.

You are twisting facts to suit your extremist agenda, something that puts you in good stead with the rest of the denialists liars.


Stop trolling. It is getting rather annoying.

Who's trolling? You picked the most extreme figure, 3%, even though the margin went from less than 1% to 3% and that comes from a thorough analysis of the available literature. And you ignore important caveats, such as the price of oil or the benefits from new job creation, in order to push your extremist agenda. You are the extremist. You are the troll. And, yes, it must be annoying for you to get proven wrong on so, so many points.
 
Well, it's a good thing that mitigation won't cost 3%, because oil prices will most definitely go up between now and 2030. Should push the costs down to blow 1% of GDP, like Stern said.

Switching away from oil happens regardless of GW.

You are twisting facts to suit your extremist agenda, something that puts you in good stead with the rest of the denialists liars.

No, it is blatantly clear what Treasury said.

Optimal mitigation is zero. All this talk of green jobs, improved economic growth etc are just propaganda.

Who's trolling? You picked the most extreme figure, 3%, even though the margin went from less than 1% to 3% and that comes from a thorough analysis of the available literature.

It's not a thorough analysis. You have no idea on economics and quote from kooks.

You have no idea what annual gdp lowered by 3% means and you simply dont care.

This is the sort of mad hard green zealotry that has turned so many including even the BBC away from your Chicken Little nonsense

When your nonsense is pointed out all you can say is "denier".

Pathetic.
 

Log in to remove this ad.

Switching away from oil happens regardless of GW.

What's the problem then!

Oh, and I'd love to see this economic modeling that takes a switch away from oil into account.

No, it is blatantly clear what Treasury said.

Optimal mitigation is zero. All this talk of green jobs, improved economic growth etc are just propaganda.

This is just like your cherry picked food production claims. You are a zealot and will latch onto a single sentence, take it way out of contest, then insist that it is The Truth. It IS blatantly clear what Garnaut said. here, I'll post it verbatim again.

12.6 Does Australia matter for global mitigation? Only effective global action can solve the climate change problem. Australia is the source of only about 1.5 per cent of global greenhouse gas emissions. So does Australian action matter?
If our own mitigation efforts had no effect at all on what others did, we could define our own targets and trajectories, and approaches to their realisation, independently of others’ perceptions or reactions. We could enjoy the benefits of reduced risk of climate change from others’ actions, without accepting our share of the costs. The optimal level of Australian mitigation effort—the level that would maximise the incomes and wealth of Australians—is easily calculated. It would be zero. That is not far from the stance of Australian policy until recent times.
Australia’s relevance to the international policy discussion has been apparent in the period since early 2001. The fact that Australia had joined the Bush administration in not ratifying the Kyoto agreement that we had each negotiated was a key fact in the American domestic discussion. Australia was presented as evidence that the Bush administration was not alone among developed countries.
All countries, Australia and the United States among them, agreed at United Nations meetings in Kyoto in 1997 that all developed countries would accept certain obligations. While the Review’s analysis demonstrates that a substantial majority of the future growth in emissions will come from developing countries (Chapter 3), the international community has agreed that the first steps in mitigation would be taken by developed countries. This gives every developed country a veto on substantial progress on global mitigation: The failure of any one of them to do what it said it would do would make it unlikely that the necessary later steps would be taken by major developing countries. We played that veto card.
Whether we like it or not, Australia matters.

...

If there is to be an effective global agreement, it is not open to Australians, any more than to people from any other country, to pick and choose among principles according to what suits them best in a particular and narrow context. The corollary of the focus on per capita allocation of emissions rights for interim targets discussed above and in Chapter 9 is acceptance of long-term global allocation rules built around eventual convergence across countries in per capita entitlements. This is the source of the required 80 per cent reduction in Australian emissions (90 per cent reduction per capita) from 2000 levels by 2050 under a 550 scenario and 90 per cent reduction in Australian emissions (95 per cent reduction per capita) from 2000 levels by 2050 under a 450 scenario.

http://www.garnautreview.org.au/chp12.htm

It's not a thorough analysis. You have no idea on economics and quote from kooks.

You have no idea what annual gdp lowered by 3% means and you simply dont care.

This is the sort of mad hard green zealotry that has turned so many including even the BBC away from your Chicken Little nonsense

When your nonsense is pointed out all you can say is "denier".

Pathetic.

Yes, the BBC reporting on developments in the science means they turned away from climate change :rolleyes:

You're a delusional zealot.
 
You know, I got curious about this and decided to ask around, today I got this response from Eli Rabett. I also emailed Pieter Tans who runs the Mauna Loa observatory for NOAA, so will post his reply when and if I get one.


So, once again Plimer has shown his deep intellectual dishonesty. He takes a perfectly valid fact about how the NOAA collate their data, leaves out a bunch of critical information, then extrapolates from that that the NOAA must be fudging their figures without providing a shred of evidence to support the claim.

Are you starting to see his M.O now, Ripper?

KOL . 'connor" must have been reading this blog and posted that up in record time as it is a direct cut and paste from my post )complete with the missing Plimer words that I was too lazy to type.

So the reply is " Plimer is actually right but ,trust us"

Code:
MLO 1984 01 05 03   342.95 -99.99 .D.
MLO 1984 01 05 04   343.42 -99.99 .U.
MLO 1984 01 05 05   343.44 -99.99 .U.
MLO 1984 01 05 06   343.85 -99.99 .D.
MLO 1984 01 05 07   344.13 -99.99 ...
MLO 1984 01 05 08   344.10 -99.99 ...
MLO 1984 01 05 09   343.74 -99.99 .D.
MLO 1984 01 05 10   344.02 -99.99 ...
MLO 1984 01 05 11   343.98 -99.99 ...
MLO 1984 01 05 12   344.25 -99.99 ...
MLO 1984 01 05 13   344.09 -99.99 ...
MLO 1984 01 05 14   343.72 -99.99 ...
MLO 1984 01 05 15   343.88 -99.99 ...
MLO 1984 01 05 16   343.02 -99.99 .A.
MLO 1984 01 05 17   343.06 -99.99 .A.
MLO 1984 01 05 18   343.54 -99.99 .A.
MLO 1984 01 05 19   343.62 -99.99 ...
MLO 1984 01 05 20   343.32 -99.99 .A.
MLO 1984 01 05 21   343.40 -99.99 .U.
MLO 1984 01 05 22   343.19 -99.99 .U.
MLO 1984 01 05 23   343.25 -99.99 .U.
MLO 1984 01 06 00   343.36 -99.99 .U.
MLO 1984 01 06 01   342.48 -99.99 .D.
MLO 1984 01 06 02   342.85 -99.99 .D.
MLO 1984 01 06 03   343.64 -99.99 .U.
MLO 1984 01 06 04   343.88 -99.99 ...
MLO 1984 01 06 05   344.36 -99.99 ...
MLO 1984 01 06 06   344.28 -99.99 ...
MLO 1984 01 06 07   344.90 -99.99 .A.
MLO 1984 01 06 08   344.69 -99.99 .A.
MLO 1984 01 06 09   344.01 -99.99 ...
ftp://ftp.cmdl.noaa.gov/ccg/co2/in-situ/mlo/mlo1984_01C0_hr.co2

Here a one little sample from the 1984 data that does not match the specications.

Remember the flagged ones are discarded.
 
So, once again Plimer has shown his deep intellectual dishonesty. He takes a perfectly valid fact about how the NOAA collate their data, leaves out a bunch of critical information, then extrapolates from that that the NOAA must be fudging their figures without providing a shred of evidence to support the claim.

Are you starting to see his M.O now, Ripper?


How can you possibly bang on about Plimer and then excuse similar issues (on a greater scale) re Yamal and bristlecones?

It makes you look like a hypocrite of the highest order.
 
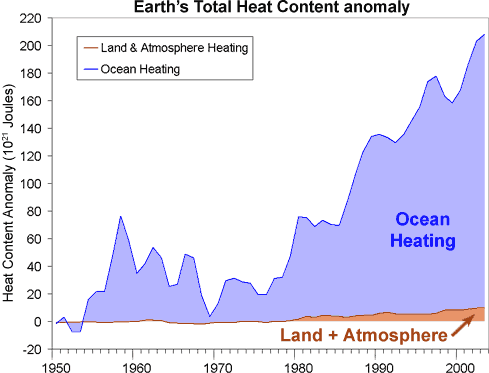
Total-Heat-Content.gif


I find this graph fairly worrying.

I didn't realise that there was absolutely ZERO heat content in the oceans and the land mass in 1950.
 
How can you possibly bang on about Plimer and then excuse similar issues (on a greater scale) re Yamal and bristlecones?

It makes you look like a hypocrite of the highest order.

And your comments show that you have no idea what you are talking about. The errors in Plimer's book a nowhere near being 'similar' to McIntyre's criticism of Briffa.
 
And your comments show that you have no idea what you are talking about. The errors in Plimer's book a nowhere near being 'similar' to McIntyre's criticism of Briffa.

From all the reviews I have read re Plimer the major issue seems to be very poor referencing of data, graphs etc.

Is this not an issue that McIntyre has raised re Yamal ie couldnt get the data, did not know which trees were being used etc?

It seems to be they are of a similar nature ie lack of transparency.
 
KOL . 'connor" must have been reading this blog and posted that up in record time as it is a direct cut and paste from my post )complete with the missing Plimer words that I was too lazy to type.

Uh, I told you that I'd asked around and that was the reply I got. It's no great mystery.

So the reply is " Plimer is actually right but ,trust us"

No, the reply is "the data is right there for anyone to see, why didn't Plimer do his homework? Or, more importantly, why didn't Plimer tell his readers the full story of how the data is collated. The obvious answer seems to be that he is trying to fool people who don't know any better.

ftp://ftp.cmdl.noaa.gov/ccg/co2/in-situ/mlo/mlo1984_01C0_hr.co2

Here a one little sample from the 1984 data that does not match the specications.

Remember the flagged ones are discarded.

Lulwut? How does it not "match the specifications"?

I find this graph fairly worrying.

I didn't realise that there was absolutely ZERO heat content in the oceans and the land mass in 1950.

The zero is a baseline, obviously.
 
Yup, exactly what I said, no discernible change to global temps. None of the decadal trends changed, much more important to climate change than whether one individual year is warmer than another.
 
Uh, I told you that I'd asked around and that was the reply I got. It's no great mystery.

Lol , thanks for that connor. ;)

No, the reply is "the data is right there for anyone to see, why didn't Plimer do his homework? Or, more importantly, why didn't Plimer tell his readers the full story of how the data is collated. The obvious answer seems to be that he is trying to fool people who don't know any better.


Lulwut? How does it not "match the specifications"?

2: The data should vary from the previous hour by less than 0.25

Code:
MLO 1984 01 05 03   342.95 -99.99 .D.
MLO 1984 01 05 04   343.42 -99.99 .U.
MLO 1984 01 05 05   343.44 -99.99 .U.
MLO 1984 01 05 06   343.85 -99.99 .D.
[B] MLO 1984 01 05 07   344.13 -99.99 ...[/B]
MLO 1984 01 05 08   344.10 -99.99 ...
MLO 1984 01 05 09   343.74 -99.99 .D.
[B] MLO 1984 01 05 10   344.02 -99.99 [/B]...
MLO 1984 01 05 11   343.98 -99.99 ...
[B] MLO 1984 01 05 12   344.25 -99.99 [/B]...
MLO 1984 01 05 13   344.09 -99.99 ...
[B] MLO 1984 01 05 14   343.72 -99.99[/B] ...
MLO 1984 01 05 15   343.88 -99.99 ...
MLO 1984 01 05 16   343.02 -99.99 .A.
MLO 1984 01 05 17   343.06 -99.99 .A.
MLO 1984 01 05 18   343.54 -99.99 .A.
MLO 1984 01 05 19   343.62 -99.99 ...
MLO 1984 01 05 20   343.32 -99.99 .A.
MLO 1984 01 05 21   343.40 -99.99 .U.
MLO 1984 01 05 22   343.19 -99.99 .U.
MLO 1984 01 05 23   343.25 -99.99 .U.
MLO 1984 01 06 00   343.36 -99.99 .U.
MLO 1984 01 06 01   342.48 -99.99 .D.
MLO 1984 01 06 02   342.85 -99.99 .D.
MLO 1984 01 06 03   343.64 -99.99 .U.
MLO 1984 01 06 04   343.88 -99.99 ...
[B] MLO 1984 01 06 05   344.36 -99.99[/B] ...
MLO 1984 01 06 06   344.28 -99.99 ...
MLO 1984 01 06 07   344.90 -99.99 .A.
MLO 1984 01 06 08   344.69 -99.99 .A.
[B] MLO 1984 01 06 09   344.01 -99.99[/B] ...

Remember the flagged ones are discarded.
The zero is a baseline, obviously.

It clearly is labled both on top and on the axis.
 

(Log in to remove this ad.)

[B said:
bit_pattern[/B]]"All hourly averages that are further than two standard deviations, calculated for every day, away from the fitted curve ("outliers") are rejected. This step is iterated until no more rejections occur."

But 2 comes before 3.

Plimer appears to be correct. No surprise that it didn't make the list on the "debunking"
 
But 2 comes before 3.

Plimer appears to be correct. No surprise that it didn't make the list on the "debunking"
Anything over 2 standard deviations from a fitted curve is often treated as an outlier and therefore statistically 'insignificant' for the purposes of making a model. It's fairly standard modelling procedure. It just smooth it out and removes potential distortions from faulty equipment or human error etc.
 
Anything over 2 standard deviations from a fitted curve is often treated as an outlier and therefore statistically 'insignificant' for the purposes of making a model. It's fairly standard modelling procedure. It just smooth it out and removes potential distortions from faulty equipment or human error etc.

Thats fair enough, Except when you have a tree that has a sigma of 8,
Or you toss all the upwind samples beforehand.

Then you disregard the 180 YO record of measurements.

http://www.ingentaconnect.com/content/mscp/ene/2007/00000018/00000002/art00006

Between 1857 and 1958, the Pettenkofer process was the standard analytical method for determining atmospheric carbon dioxide levels, and usually achieved an accuracy better than 3%. These determinations were made by several scientists of Nobel Prize level distinction. Following Callendar (1938), modern climatologists have generally ignored the historic determinations of CO2, despite the techniques being standard text book procedures in several different disciplines. Chemical methods were discredited as unreliable choosing only few which fit the assumption of a climate CO2 connection.

The two longest thermometer records in the world.

http://cadenzapress.co.uk/download/beck_mencken_hadley.jpg

Everywhere you look at the raw non urban and even some urban one (I.E. Adelaide & Darwin) records they show nothing out of the ordinary.

In fact Adelaide & Darwin are cooler than in the 1890's
 
http://klimaathype.vkblog.nl/
Hans Erren:

http://www.climateaudit.org/?p=7328#comment-361111


October 12th, 2009 at 2:20 pm Re: steven mosher (#115),
Under the assumption that a tree captures the climate signal for an area I see no reason why one can't combine series ( from the same species) from regions as large as this ( say 1200 km radius ) to improve the sample size.
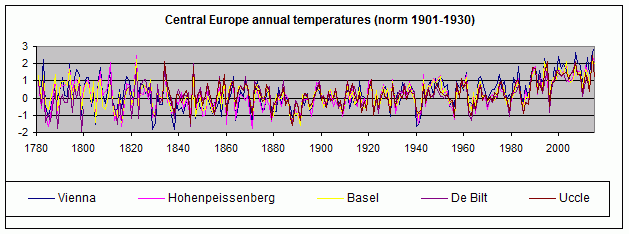
Sure look at Central Europe how well stations match that are 900 km apart. (real observed temperatures!)I think I calculated an R2 of 0.7.
centraleuropetemp0130.gif

BTW the Khadyta larches match to summer (JJA) temperature in Salehard with an R2 of only 0.1

Hans Erren is a Dutch meteorologist
 
Thanks Hawk.

Have you seen the latest where Lord Monckton claims that "Obama is poised to cede power in Copenhagen"

It's gone a bit viral.

[youtube]PMe5dOgbu40[/youtube]

Here is an analysis and link to the treaty.

38. The scheme for the new institutional arrangement under the Convention will be based on three basic pillars: government; facilitative mechanism; and financial mechanism, and the basic organization of which will include the following:

(a) The government will be ruled by the COP with the support of a new subsidiary body on adaptation, and of an Executive Board responsible for the management of the new funds and the related facilitative processes and bodies. The current Convention secretariat will operate as such, as appropriate.
(b) The Convention’s financial mechanism will include a multilateral climate change fund including five windows: (a) an Adaptation window, (b) a Compensation window, to address loss and damage from climate change impacts, including insurance, rehabilitation and compensatory components,

(c) a Technology window; (d) a Mitigation window; and (e) a REDD window, to support a multi-phases process for positive forest incentives relating to REDD actions.
(c) The Convention’s facilitative mechanism will include: (a) work programmes for adaptation and mitigation; (b) a long-term REDD process; (c) a short-term technology action plan; (d) an expert group on adaptation established by the subsidiary body on adaptation, and expert groups on mitigation, technologies and on monitoring, reporting and verification; and (e) an international registry for the monitoring, reporting and verification of compliance of emission reduction commitments, and the transfer of technical and financial resources from developed countries to developing countries. The secretariat will provide technical and administrative support, including a new centre for information exchange.

Remember that Australia is hell bent on signing this as well.
 
Meanwhile, back on Planet Earth...

Global Highlights

* The combined global land and ocean surface temperature for September 2009 was 0.62°C (1.12°F) above the 20th Century average of 15.0°C (59.0°F). This was the second warmest September on record, behind 2005, and the 33rd consecutive September with a global temperature above the 20th Century average. The last below-average September occurred in 1976.
* The global land surface temperature for September 2009 was 0.97°C (1.75°F) above the 20th Century average of 12.0°C (53.6°F), and ranked as the second warmest September on record, also behind 2005.
* The worldwide ocean temperature tied with 2004 as the fifth warmest September on record, 0.50°C (0.90°F) above the 20th Century average of 16.2°C (61.1°F). Warmer-than-average sea surface temperatures were widespread, particularly in lower latitudes. The near-Antarctic southern ocean and the Gulf of Alaska featured notable cooler-than-average temperatures.
* For the year to date, the global combined land and ocean surface temperature of 14.7°C (58.5°F) was the sixth-warmest January-through-September period on record. This value is 0.55°C (0.99°F) above the 20th Century average.
* A weak El Niño persisted across the equatorial Pacific Ocean during September. Sea surface temperature observations in the equatorial Pacific Ocean during the month remained above average. According to NOAA's Climate Prediction Center, El Niño is expected to strengthen and last through the Northern Hemisphere winter of 2009-2010.
 
^^ Nope. Really, month to month variability, or even year to variability, is next to useless for tracking global warming (something that those pushing the 'no warming since 1998' meme could do well to think about) but the deniers just love pointing to monthly data that supposedly supports their contentions, but ignore that same data when it shows something they want to deny. What's good for the goose...

As for the rest of the thread, I got an email from Pieter Tans at NOAA, he explains a bit further of the con artist that is Ian Plimer

Anybody, including Plimer, can download the
actual measurement records, complete, warts and all, from our web site
www.esrl.noaa.gov/gmd/iadv/, or www.esrl.noaa.gov/gmd/trends/
by clicking on the appropriate places. To illustrate how misleading
Plimer is I made a plot of 3 years of all hourly data, with 2004 in the
middle because Plimer discussed 2004. I have also attached a
description of our MLO measurements, which Plimer and anybody else can
download from the second web page mentioned above.
In the plot, "selected" data means that we have used it in constructing
the published monthly mean because those hours satisfy the conditions
for "background" measurements. The red stripes are extremely close to
the published monthly means. The published data has another step, first
from hourly to daily averages, then to monthly, which I did not do here.
Also plotted in purple-blue are all non-background data. If one
constructs monthly means from ALL data, incl. non-background, one
obtains the purple-blue stripes. The differences are only slight, with
the seasonal cycle becoming a bit larger due to upslope winds, esp.
during the summer. Neither difference affects the conclusions we can
draw about the continuing build up of CO2.

plimer-379.jpg
 
Thanks BP, They could have saved themselves the trouble by just using all the data by the looks of it.

Discarding the upwind measurements is contradictory as the history points have been calculated from ice cores at the poles which did not care which way the wind blew, so to be consistent apples should be compared to apples.

Although the trend does not change much like everything everything else the absolute measurements have been overstated.
 

Remove this Banner Ad

Back
Top