

Absolutely. It's all about what happens in each game from here.We are currently on the same % as Geelong
Navigation
Install the app
How to install the app on iOS
Follow along with the video below to see how to install our site as a web app on your home screen.
Note: This feature may not be available in some browsers.
More options
-


LIVE: Richmond v Melbourne - 7:25PM Wed
Squiggle tips Demons at 77% chance -- What's your tip? -- Team line-ups »
You are using an out of date browser. It may not display this or other websites correctly.
You should upgrade or use an alternative browser.
You should upgrade or use an alternative browser.
Lowest % to finish top 4 in AFL era?
- Thread starter PerthBoy86
- Start date
- Tagged users None
- Aug 18, 2009
- 1,736
- 4,867
- AFL Club
- Richmond
conversely, I wonder if Richmond have one of the highest %'s for a 13 win season. Irritatingly the tigs are 4th on %
Putting aside the fact that your figures are incorrect and misleading - there is a 7 point loss in there as well as two 13 point losses which were deliberately omitted -Long story short, close wins are 50/50 toss ups. Good teams win more close games, but they win more not close games too.
There is no correlation apparent in VFL/AFL history between a team that wins a lot of close games for years running. It oscillates wildly - as in it's random.
There's footy romance in the "clutch" team. Hawthorn in their premiership years were either terrible or good in close games during the threepeat. In 2016 they were perfect in close games, in the H&A at least. Lost the QF by under a goal after the siren. Out the next week.
Brisbane 01-03 weren't good in close games - 21% I believe. Premiers every year.
Geelong won 7 by 2 goals or less in 2014. Straight sets exit in finals.
Basically there is a high correlation or good teams having consecutive good seasons and vice versa, all regressing to the mean.
But no correlation between a team winning the close ones in consecutive years.
So in Collingwoods case - they have won 11 and lost 0 in games of 2 goals or less. As good as 50/50 odds in each. That's a 1 in more than 100,000 outcome.
Ultimately, your record is your record.
So I'm by no means saying Collingwood are actually a bottom 10 team. They won 16 games and are in the top 4 accordingly. I'm also not overly confident about the QF as a Geelong supporter.
But Collingwood could literally play this season 100,000 times and never win all eleven close ones again.
In that sense, the % of 104 is probably more reflective than the 16 wins.
Collingwood were a bottom 2 team last season. And it seems what took them above being a slightly better average team is a freakish run of eleven largely 50% outcomes all falling their way.
If probability had held, they'd be a 10 / 11 win team with a 104%.
Similarly, Richmond's only losses since round 7 have been by less than a goal four times and a draw. They could be equal top with more luck in those close ones. And really, they are the team that "knows how to get it done" if the romance of it is to be believed.
Absolutely no disrespect to Collingwood, but in terms of freakish occurences - them having 16 wins, 11 of which were 2 goals or less (and NINE by single digits) is insane. It has never happened again. Most teams would never play in that many close ones, let alone win every single one. Seriously rare occurence.
Like a 0.000488% chance of happening rare.
your entire premise is that every “close game” is a 50/50. Which is demonstrably untrue.
Any statistician analysing a data set that arrives at a 1/100,000 conclusion would laugh you out of the room for accepting that.
The regression to the mean is also confounding, as every single team regresses to the mean. If you take every 16-win team then analyse how they’ve performed the following season, they will average considerably less than 16 wins (the same is true for any number >11). So you have white noise in that dataset as well.
- Mar 26, 2015
- 11,868
- 21,946
- AFL Club
- Carlton
- Other Teams
- Melbourne Tigers, Bendigo Braves, OKC
That was an interesting season for them. Only 3 games decided by 13pts or less (3-0). Some massive wins and some massive losses.Melbourne 1998, 4th 102.71%
They also finished 16th (last) in 1997 and then fell back to 14th (3rd last) in 1999.
The Bulldogs had 5 games decided by 12 points or less and went 2-3. Also a game by 14pts and one by 15pts (1W - 1L). Also sprinkled with some big wins and big losses.Western Bulldogs 1997 101.8%
(Another poster gave me this in a different thread yesterday)
Edit: To clarify, Dogs finished 3rd.
The bookend seasons for the Dogs were 15th (2nd last) in 1996, but then they stayed up the top and finished 2nd in 1998.
With Pies finishing 17th (2nd last) last year, the common theme is a poor year, followed by top 4 with a low percentage, but the way they got those low percentages were all different and with the future success the following season split with one sustained and one slipping back to the bottom, there's no real way of knowing which way it will go for the Pies next year.
It really is an interesting scenario that's hard to explain.
Fair enough - I posted links to statistical analysis that states close games are coin flips. Here is one:Putting aside the fact that your figures are incorrect and misleading - there is a 7 point loss in there as well as two 13 point losses which were deliberately omitted -
your entire premise is that every “close game” is a 50/50. Which is demonstrably untrue.
Any statistician analysing a data set that arrives at a 1/100,000 conclusion would laugh you out of the room for accepting that.
The regression to the mean is also confounding, as every single team regresses to the mean. If you take every 16-win team then analyse how they’ve performed the following season, they will average considerably less than 16 wins (the same is true for any number >11). So you have white noise in that dataset as well.
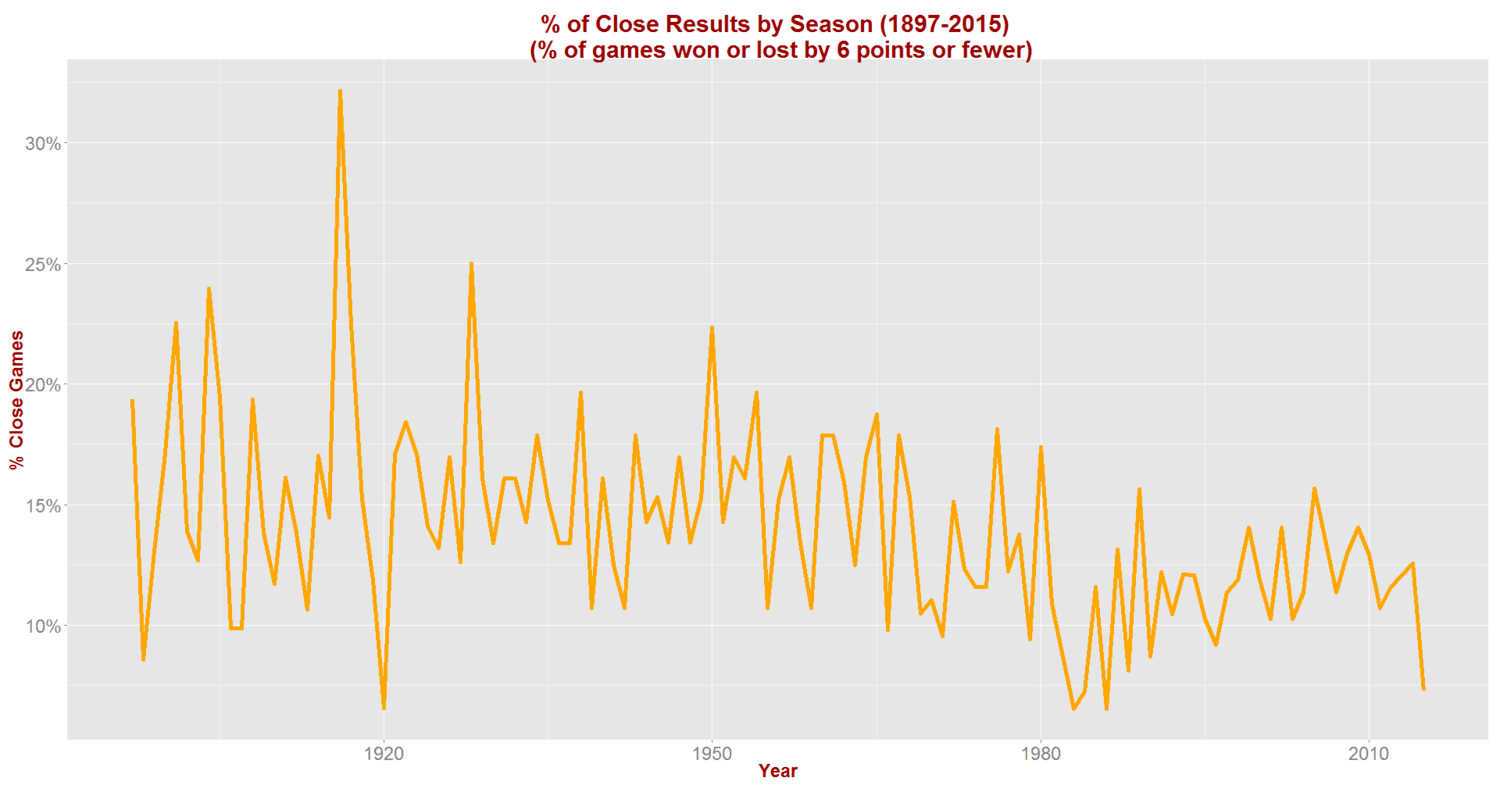
Close Games in VFL/AFL History: Do Successful Teams Win Them? — Matter of Stats
Recently, we've looked at the history of margins , of blowouts, mismatches and upsets , and the history of conversion rates . Today we'll be looking at the history of close games, which I'll define as games that are decided by a goal or less.
 www.matterofstats.com
And it makes sense - a game with a kick in it with 2 minutes left can go either way. Probably slightly favouring the better team, but at that point the outcome is largely random.
Yes, I've acknowledged I missed the Lions result and WC and Geelong are pretty close to 2 goals, so included them in a subsequent post as well.
I think I conflated an article about the 11 wins by 2 goals or less being a single season record with them being 11-0 in such games. 11-3 in them is still incredible.
The 1 / 100,000 are the odds of 10 coin flips being heads in a row (unless I miscalculated) - 50% x 50% etc 10 times = .00097%. I believe .00097% translates to about 1 in a 100,000 I believe. Obviously with my error on the 11-0 this has far less relevance and I'll retract it.
The regression to the mean holds in terms of season records, absolutely. Good teams tend to string good seasons together regressing to the mean. Bad teams string bad seasons together.l regressing to the mean.
The same isn't true of teams that win the close games one season winning them the next. It oscillates randomly.
How many of Collingwoods 11 wins could have easily gone the other way? Quite a lot.
Conversely, if the Brisbane, WC and Geelong games had also gone the other way, you'd be top!
The analysis I've read and posted suggests that all close games could basically go either way. And the myth of the "clutch" team is usually just post hoc analysis of a team that got lucky in the close ones. Like Geelong 2014 and 2017.
Don't know if you follow Final Siren or Squiggle but he covers this kind of thing better than I do. A lot of the links I've posted I followed from his blog post here:
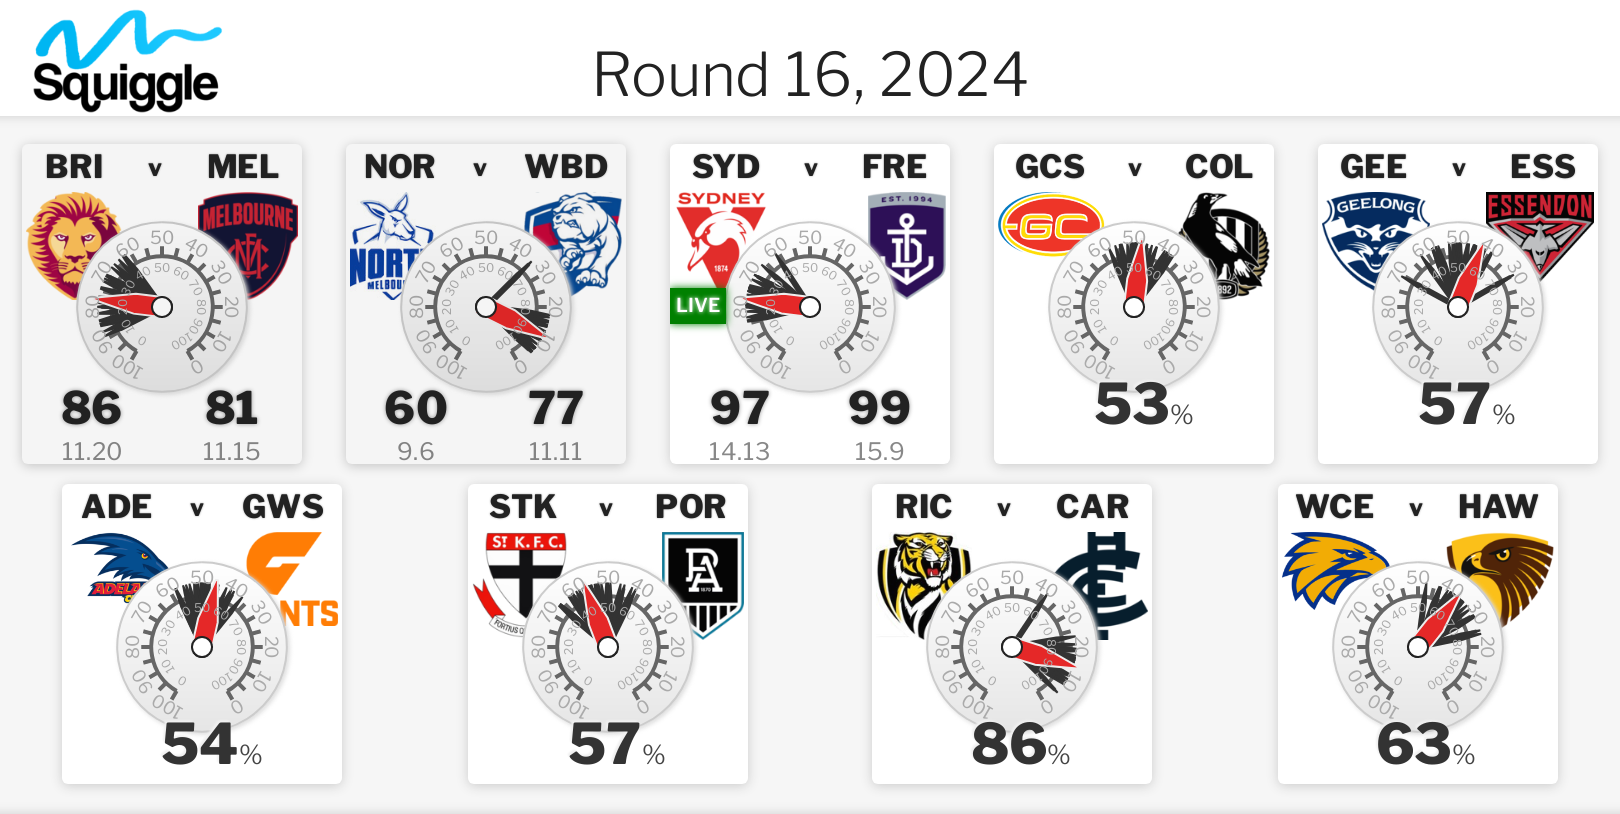
Squiggle: AFL prediction & analysis
Squiggle is the home of computer-aided AFL footy tipping

As always, I've said this same stuff about Geelong in both 2014 and 2017. Top 4 but a lot of very lucky wins on both years.
Even this year, we (being Geelong) are pretty lucky. 13 win streaks are rare, and we wouldn't be top without one.
I'm not having a go at Collingwood or trying to belittle them. I'm just interested in this, and like to try discuss it. Granted my figures are likely to be out in some instances.
It's finals now, and the season record is irrelevant.
I remember well what Collingwood did to Geelong from 4th last time we finished top.
All the best to you all and again - I was trying to discuss something that interested me (as an acknowledged statistician layperson) and meant no disrespect to Collingwood.
There is romance in sport being "all about performing on the day" etc, but probability rules all.
As a team, you wouldn't want to be basing your seasons off winning 11 games by 2 goals or less each year, because given its happened once in VFL/AFL history, it's pretty remarkable.
16 wins is terrific, 104% is pretty ordinary and speaks to their reliance on a lot of close (and more than a few quite lucky) wins. What happens in finals is dependent on the day now and Collingwood could definitely win the premiership from here.
Last edited:
- Sep 14, 2005
- 18,420
- 18,667
My initial post was my opinion for the following reasons -Seriously, there is no disrespect intended. I'm interested in probabilities.
Collingwood are a top 4 team on wins, with an ordinary %.
They also have a team with some serious talent.
Collingwood have had a statistical and probabilistic outlier season.
And they could win the premiership off the back of it!
Good luck to them if they do.
Long story short, close wins are 50/50 toss ups. Good teams win more close games, but they win more not close games too.
What’s the logic behind close games being a 50/50 toss up? It’s as if people knew Collingwood were going to win midway through the last against the Blues. That’s because they’ve shown their ability to hunt down a lead and snatch the win on the back of the quality of leadership and ball movement when they get a roll on.
Like you said, it’s completely random, so it’s unprecedented, so it can’t be compared to previous examples.There is no correlation apparent in VFL/AFL history between a team that wins a lot of close games for years running. It oscillates wildly - as in it's random.
There's footy romance in the "clutch" team. Hawthorn in their premiership years were either terrible or good in close games during the threepeat. In 2016 they were perfect in close games, in the H&A at least. Lost the QF by under a goal after the siren. Out the next week.
That Lions side was notoriously a good, but not great H&A side. They won 1 more game than Collingwood 2022 in 2001 and 2002. They won 2 less games in 2003 than Collingwood 2022. But they are probably the greatest side in the modern era. Their ability to win close H&A games goes out the window because in September they were comfortably the best team in it. 21% record in close games means SFA when looking at that Lions side holistically.Brisbane 01-03 weren't good in close games - 21% I believe. Premiers every year.
Geelong won 7 by 2 goals or less in 2014. Straight sets exit in finals.
You have almost gone 0-9 in the first week of finals since 2011. Again, the Cats 2014 side’s record in close games means nothing when trying to attribute their close games record with their September performance. The choking in first week of September was over an extended period of time.
You could argue Collingwood 2021 was an outlier considering we’ve made finals and top 4 consistently outside that 2021 season. Pies consistently make finals over the last 4-5 years - their record in close games this year doesn’t dictate whether they make it again next year. Their age profile/performance of senior players will.Basically there is a high correlation or good teams having consecutive good seasons and vice versa, all regressing to the mean.
But no correlation between a team winning the close ones in consecutive years.
As mentioned by Fadge , our record in games with a 13 point margin or less is actually something like 11-3, so that isn’t a 100,000/1 outcome. Not sure why we’ve picked 12 points or less.So in Collingwoods case - they have won 11 and lost 0 in games of 2 goals or less. As good as 50/50 odds in each. That's a 1 in more than 100,000 outcome.
Exactly right. People saying this is one of the weaker 4th placed finishes in recent times also neglect the fact this Collingwood side has won the 2nd most games of any 4th placed side in the last 20 years. Wins supersede percentage in this argument.Ultimately, your record is your record.
So I'm by no means saying Collingwood are actually a bottom 10 team. They won 16 games and are in the top 4 accordingly. I'm also not overly confident about the QF as a Geelong supporter.
Why? Again, refer to the 3 close losses the Pies had. If they’d finished 19-3 and outright first, we probably wouldn’t even be having this discussion.But Collingwood could literally play this season 100,000 times and never win all eleven close ones again.
In that sense, the % of 104 is probably more reflective than the 16 wins.
So we don’t mention finishing bottom 2 last year as an outlier, but use it to support our argument? Has this Collingwood side been a bottom 2 side in any of the prior 3-4 seasons?Collingwood were a bottom 2 team last season. And it seems what took them above being a slightly better average team is a freakish run of eleven largely 50% outcomes all falling their way.
Again, it’s fixating on the negative aspects which makes it come off as disrespectful, which was my initial point, but at the end of the day, everyone starts at 0% now, so it really means nothing heading into the finals series.If probability had held, they'd be a 10 / 11 win team with a 104%.
Similarly, Richmond's only losses since round 7 have been by less than a goal four times and a draw. They could be equal top with more luck in those close ones. And really, they are the team that "knows how to get it done" if the romance of it is to be believed.
Absolutely no disrespect to Collingwood, but in terms of freakish occurences - them having 16 wins, 11 of which were 2 goals or less (and NINE by single digits) is insane. It has never happened again. Most teams would never play in that many close ones, let alone win every single one. Seriously rare occurence.
Like a 0.000488% chance of happening rare.
Why are you getting offended? (and every other Collingwood fan in here)It's funny how people forget about the wins. Seems like a team winning 14 games for the season and finishing 4th is better than a team winning 16 games but has a lower % finishing 4th. Go figure.....
The thread isn't making commentary on Collingwood it's a legitimate statistical question. And yet the thread is littered with bitchy Collingwood fans with their knickers in a knot over non-existent criticism.
yet no one was doing this until you decided to have a little cry early in the thread.Love the whole concept of the post:
“Disrespect…
Disrespect…
More reasons why I don’t think they deserve to be top 4
Disrespect…
They’ll never do this again.
But no disrespect intended and I’m not overly confident of beating them.”
Similarly, Richmond's only losses since round 7 have been by less than a goal four times and a draw.
And really, they are the team that "knows how to get it done"
I would argue these 2 statements are contradictory.
- Sep 14, 2005
- 18,420
- 18,667
Huhyet no one was doing this until you decided to have a little cry early in the thread.
Yes, that was my point... if any team is going to be the clutch team that "knows how to get it done" it would ve the one packed with multi premiership players who have won 3 of the last 5 flags.I would argue these 2 statements are contradictory.
Yet Richmond went at about 20% in 7 close ones, and Collingwood went 80% in 14.
So possibly more randomness than experience and being "clutch".
My initial post was my opinion for the following reasons -
I'm stating at the outset I am not (and if you wanted to check, my posting history supports) on this site to inflame or provoke. Not into that.
This isn't (on my part, anyway) Collingwood bashing. I would say this about any team that went 16-6 with 104%. I would (and indeed have) say it about my own team.
I get that after 22 games and top 4, coming on here to read people saying your team doesn't deserve it is irritating. Not my intent, again.
Let's anonymise it - "AFL Team" finishes a 22 game season with a 104%. Someone tells you to guess how many games they win - if you are wrong, you owe $100,000. Would you honestly guess 16 - 6 as their record? You'd probably go 12-10.
That is the point. In all professional comps, the teams that win a lot of games usually outscore their opponents pretty significantly. MLB, NFL, EPL, NBA, etc - the teams that win a lot usually score far more than they concede.
Collingwood scored 1.04 points for every 1 point they conceded. Their pathway to 16 wins was seriously narrow. They needed a lot of close results to fall their way. And they did. It was a seriously unique season!
Forget the 50/50 thing - no one can actually say. I believe, and I've posted articles that I base this belief on, that there is really no such thing as a "clutch team". To get to 16 wins at 104% Collingwood had to win a VFL/AFL record number of games by 12 points or less, and a VFL/AFL record number of games by single digits. Records dating back to 1897.
But ultimately, they did it. They are now top 4, and only need three good days to win the flag. They could achieve that, for sure. The argument about if their record flattered them (and I do think it does to some extent - but I'd say that about any team that had a season like this) is now largely for interest sake, because they are without doubt in the top 4.
So now to address your questions (hopefully I get the reply edit right and don't wreck the formatting):
What’s the logic behind close games being a 50/50 toss up? It’s as if people knew Collingwood were going to win midway through the last against the Blues. That’s because they’ve shown their ability to hunt down a lead and snatch the win on the back of the quality of leadership and ball movement when they get a roll on.
The articles I've posted. They haven't necessarily shown their ability to, they more just have. Is it because they are a clutch 4th quarter team? Maybe. Is it because they had a remarkable string of lucky wins? Maybe.
Based on the articles I've read, a team that wins the most close games ever in 125 odd years got lucky.
Doesn't mean they aren't a good team or a bunch of talented players, all well coached as well.
With 2 minutes to go and a goal in it, anything can happen. The bounce of the ball, the fact both teams have kicked about the same all game. A single clearance can decide it. Being about 50/50 makes sense.
Like you said, it’s completely random, so it’s unprecedented, so it can’t be compared to previous examples.
I suppose - but all sport is subject to randomness. We routinely compare seasons past and present anyway. And we often think what our team did 50 years ago is somehow relevant to what they might do next week.
Some Geelong fans still worry about our EF from 2012 somehow mattering this week.
That Lions side was notoriously a good, but not great H&A side. They won 1 more game than Collingwood 2022 in 2001 and 2002. They won 2 less games in 2003 than Collingwood 2022. But they are probably the greatest side in the modern era. Their ability to win close H&A games goes out the window because in September they were comfortably the best team in it. 21% record in close games means SFA when looking at that Lions side holistically.
Exactly. What is more important here: 16 wins (very good), or scoring 1.04 points for every 1 point conceded across a season (pretty average).
Some people here think this Collingwood side, holistically, have maybe won more games than you'd expect a 104% side to win. Whether that is true or not is now also kind of irrelevant. They did, and they are top 4. That's what you aim for, so the way they got there is of academic interest now, really.
You have almost gone 0-9 in the first week of finals since 2011. Again, the Cats 2014 side’s record in close games means nothing when trying to attribute their close games record with their September performance. The choking in first week of September was over an extended period of time.
Agreed - I'm not extrapolating Geelong's 2014 finals to suggest straigth sets for this Collingwood side. My point was Geelong won 7 close games and lost 0. Their 110% was probably more reflective of their quality that year than their 17 wins.
You could argue Collingwood 2021 was an outlier considering we’ve made finals and top 4 consistently outside that 2021 season. Pies consistently make finals over the last 4-5 years - their record in close games this year doesn’t dictate whether they make it again next year. Their age profile/performance of senior players will.
Yes, you could. And I agree. I think they were better than bottom 2 last year.
As mentioned by Fadge , our record in games with a 13 point margin or less is actually something like 11-3, so that isn’t a 100,000/1 outcome. Not sure why we’ve picked 12 points or less.
Yes, and I acknowledged my mistake on the 11-0. And yeah, based on the correct win / loss I retracted that 1 in a 100,000 thing and explained how I got it.
I picked 12 points or less because of this article, particularly the bolded part: Don't ever write 'em off! Pies smash record for close wins
"With Jamie Elliott sinking a second enemy in the space of a month – having kicked the winner after the siren against Essendon in round 19 – the Magpies banked an 11th win by less than 12 points this year.
Melbourne did it eight times in 1989, while only nine teams have done it seven times in a single season.
In fact, nine of Collingwood's 11 wins have been by single digits, and six have been by less than a straight kick, including twice against the Blues and once against Essendon.
No one has won more than seven games in a single season by less than 10 points. Port Adelaide did it in 2002, Footscray in 1944 and Carlton in 1914.
It means Collingwood's percentage of just 104.3 per cent is the lowest by a top-four side since Melbourne in 1998 and the third-lowest of the AFL era."
12 points was in my mind because of that AFL.com.au article - it wasn't arbitrarily chosen to make try Collingwood look bad by any means.
I acknowledged I incorrectly conflated the 11 wins record with them being 11-0.
Exactly right. People saying this is one of the weaker 4th placed finishes in recent times also neglect the fact this Collingwood side has won the 2nd most games of any 4th placed side in the last 20 years. Wins supersede percentage in this argument.
Well, yeah maybe they do. I'm not arguing I have the gospel truth. Maybe 16 wins will ultimately prove to be more important. Ultimately, win enough games and % becomes irrelavant, so Collingwood achieved that. I've noted they could win the flag from here, and are a good chance to win the QF next weekend. I wanted Carlton to win so we didn't face Collingwood. They make me very nervous, you guys play us well.
Why? Again, refer to the 3 close losses the Pies had. If they’d finished 19-3 and outright first, we probably wouldn’t even be having this discussion.
Completely true! I actually made that very point in the post immediately above yours:
Conversely, if the Brisbane, WC and Geelong games had also gone the other way, you'd be top!
So we don’t mention finishing bottom 2 last year as an outlier, but use it to support our argument? Has this Collingwood side been a bottom 2 side in any of the prior 3-4 seasons?
No, Collingwood were better than a bottom 2 team last year in my opinion. The Buckley situation wouldn't have helped things.
Again, it’s fixating on the negative aspects which makes it come off as disrespectful, which was my initial point, but at the end of the day, everyone starts at 0% now, so it really means nothing heading into the finals series.
Agree - and I say again, I am not trying to be disrespectful.
Again, I would say imagine Carlton finished top 4 with a VFL/AFL record number of close wins and a 16-6 record with 104%. Would a part of you not be surprised at those numbers?
Or just seeing a totally anonymous 16-6 and 104%. Surely you would double take at that combination?
The uniqueness of it makes what is more important or indicative of Collingwoods quality this year - wins or % - a live question.
I don't have the answer, I'm just interested in it.
And again, you only need 3 good days from here and you are premiers. You have a lot of seriously good footballers and what looks to be a good coach, so it could definitely happen.
Best of luck next week.
Last edited:
This is the important question though - are we asking what the odds are if we were to replay the last few minutes?Fair enough - I posted links to statistical analysis that states close games are coin flips. Here is one:
Close Games in VFL/AFL History: Do Successful Teams Win Them? — Matter of Stats
Recently, we've looked at the history of margins , of blowouts, mismatches and upsets , and the history of conversion rates . Today we'll be looking at the history of close games, which I'll define as games that are decided by a goal or less.
And it makes sense - a game with a kick in it with 2 minutes left can go either way. Probably slightly favouring the better team, but at that point the outcome is largely random.
Because a lot of Collingwood’s close wins have been defending leads, which places them as the favourite due to having the lead in the first place. Only two of Collingwood’s close wins - Essendon and Carlton - did they take the lead inside the last 5 minutes. And in both games they were thundering home with momentum which changes the dynamic completely.
I think this is the crux of my point.Yes, I've acknowledged I missed the Lions result and WC and Geelong are pretty close to 2 goals, so included them in a subsequent post as well.
I think I conflated an article about the 11 wins by 2 goals or less being a single season record with them being 11-0 in such games. 11-3 in them is still incredible.
The 1 / 100,000 are the odds of 10 coin flips being heads in a row (unless I miscalculated) - 50% x 50% etc 10 times = .00097%. I believe .00097% translates to about 1 in a 100,000 I believe. Obviously with my error on the 11-0 this has far less relevance and I'll retract it.
If someone flips a coin in front of you 100 times and it lands on heads 100 times, why is that the case?
Was each flip a 50/50 and it ended in a 1 in bajillion random chance? Or was it more likely a fake that had two heads on it?
Not all close games are created equal. And indeed, the margin we pick to define them will always be arbitrary. A team that has a 5 goal lead all day and concedes 3 goals in the last minute has won much more comfortably than a team who has been a goal down all day then kicks 3 in the final minute. Yet they both show 2 goals as the final margin.
This is the issue that exists with this analysis though: teams’ form will always change from one season to another.The regression to the mean holds in terms of season records, absolutely. Good teams tend to string good seasons together regressing to the mean. Bad teams string bad seasons together.l regressing to the mean.
The same isn't true of teams that win the close games one season winning them the next. It oscillates randomly.
I remember Hawthorn 2016 being discussed at the time after they won all those close games - and it was pointed out that they didn’t in 2015. What that ignores however is the clumping of games. All their close losses in ‘15 were in the first 8 rounds, before they’d hit top form. They lost to a very young GWS team along with Essendon who went on to finish bottom 4. Their form line and style an entire year later was very different, to the point where it can confound results like that. But simply stating one year was bad and one year was good isn’t actually proof until you can eliminate the other variables in between - which is practically impossible to do.
Absolutely, I love the Squiggle and final siren’s work. There’s always an important question to ask though: is the sample you’ve chosen representative of the entire population?How many of Collingwoods 11 wins could have easily gone the other way? Quite a lot.
Conversely, if the Brisbane, WC and Geelong games had also gone the other way, you'd be top!
The analysis I've read and posted suggests that all close games could basically go either way. And the myth of the "clutch" team is usually just post hoc analysis of a team that got lucky in the close ones. Like Geelong 2014 and 2017.
Don't know if you follow Final Siren or Squiggle but he covers this kind of thing better than I do. A lot of the links I've posted I followed from his blog post here:
Squiggle: AFL prediction & analysis
Squiggle is the home of computer-aided AFL footy tippingsquiggle.com.au
View attachment 1491526
There’s a fair case to be made that Collingwood is better than average in these scenarios (having to take the lead late) given their rebound power this season. But they’ve also demonstrated a great ability to lock down and defend a lead. I don’t think it’s unreasonable to say they have many other teams covered in this area - at least at present. Who knows what it will look like next year though.
As always, I've said this same stuff about Geelong in both 2014 and 2017. Top 4 but a lot of very lucky wins on both years.
Geelong in recent years have performed poorly in finals. They crumbled in 2014 simply because they didn’t show up in the first half against North. This is a team who they beat very soundly twice previously in the year.
17 they ran into a far superior opponent who blew them off the park.
I think what keeps Pies supporters optimistic is that they’ve shown they have weapons that can trouble the best teams. Beating Melbourne twice is a testament to that. And at the end of the day, if we find ourselves in a close finish, there’s no doubt the group will believe in their ability to get it done - which is a big hurdle in itself.Even this year, we (being Geelong) are pretty lucky. 13 win streaks are rare, and we wouldn't be top without one.
I'm not having a go at Collingwood or trying to belittle them. I'm just interested in this, and like to try discuss it. Granted my figures are likely to be out in some instances.
It's finals now, and the season record is irrelevant.
I remember well what Collingwood did to Geelong from 4th last time we finished top.
All the best to you all and again - I was trying to discuss something that interested me (as an acknowledged statistician layperson) and meant no disrespect to Collingwood.
There is romance in sport being "all about performing on the day" etc, but probability rules all.
As a team, you wouldn't want to be basing your seasons off winning 11 games by 2 goals or less each year, because given its happened once in VFL/AFL history, it's pretty remarkable.
16 wins is terrific, 104% is pretty ordinary and speaks to their reliance on a lot of close (and more than a few quite lucky) wins. What happens in finals is dependent on the day now and Collingwood could definitely win the premiership from here.
Anyway it certainly is a very interesting discussion and a curious anomaly!
- Sep 14, 2005
- 18,420
- 18,667
Thank you for clarifying and apologies, I wasn’t having a direct dig at you.
Can’t subscribe to this. 104% doesn’t necessarily mean 1.04 for every 1. Look at GCS’s 102.8% - they had 13 of 22 games decided by a margin above 4 goals (7W, 6L) and were unfortunate to finish 6 wins less and 8 positions lower than Collingwood.
Melbourne, for example, lost the same amount of games as the Pies this year and had 3 losses above 4 goals, same as Collingwood.
They also had 7 wins by 5 goals or more against bottom 10 sides vs Collingwood’s 1 which attributed to their 130%. Outside the Lions, whom they bullied twice, they had just one win against a top 8 side by 5 goals or more (against Freo), just like we did, also against Freo.
Would it not be the same argument that Melbourne, and other top 4/8 sides are flat track bullies then? It’s just a rhetorical question, but I’m looking at the situation from a different lense as Melbourne’s percentage was 130% v Collingwood’s 104% from effectively the same win/loss situations.
If the Pies have won so many close ones, it means they kept themselves in just as many contests and turned the tide in their favour. You’re not within 3-4 goals at 3QT unless you’ve played the game on your terms at stages in the first 3 quarters.
I'm stating at the outset I am not (and if you wanted to check, my posting history supports) on this site to inflame or provoke. Not into that.
This isn't (on my part, anyway) Collingwood bashing. I would say this about any team that went 16-6 with 104%. I would (and indeed have) say it about my own team.
I get that after 22 games and top 4, coming on here to read people saying your team doesn't deserve it is irritating. Not my intent, again.
Let's anonymise it - "AFL Team" finishes a 22 game season with a 104%. Someone tells you to guess how many games they win - if you are wrong, you owe $100,000. Would you honestly guess 16 - 6 as their record? You'd probably go 12-10.
That is the point. In all professional comps, the teams that win a lot of games usually outscore their opponents pretty significantly. MLB, NFL, EPL, NBA, etc - the teams that win a lot usually score far more than they concede.
Collingwood scored 1.04 points for every 1 point they conceded. Their pathway to 16 wins was seriously narrow. They needed a lot of close results to fall their way. And they did. It was a seriously unique season!
Can’t subscribe to this. 104% doesn’t necessarily mean 1.04 for every 1. Look at GCS’s 102.8% - they had 13 of 22 games decided by a margin above 4 goals (7W, 6L) and were unfortunate to finish 6 wins less and 8 positions lower than Collingwood.
Melbourne, for example, lost the same amount of games as the Pies this year and had 3 losses above 4 goals, same as Collingwood.
They also had 7 wins by 5 goals or more against bottom 10 sides vs Collingwood’s 1 which attributed to their 130%. Outside the Lions, whom they bullied twice, they had just one win against a top 8 side by 5 goals or more (against Freo), just like we did, also against Freo.
Would it not be the same argument that Melbourne, and other top 4/8 sides are flat track bullies then? It’s just a rhetorical question, but I’m looking at the situation from a different lense as Melbourne’s percentage was 130% v Collingwood’s 104% from effectively the same win/loss situations.
First few wins, you could initially argue was luck/fluke, but when it become a habit, and we started studying what the Pies were doing, it became evident it had been trained, and the Magpie senior players were leading this late in games with tactics. It became less luck/bounce of a footy, and more of the former. It’s effectively the definition of clutch IMO, as smug as that may sound.Forget the 50/50 thing - no one can actually say. I believe, and I've posted articles that I base this belief on, that there is really no such thing as a "clutch team". To get to 16 wins at 104% Collingwood had to win a VFL/AFL record number of games by 12 points or less, and a VFL/AFL record number of games by single digits. Records dating back to 1897.
Manner of wins, with only really 2-3 (Dons, Blues mk2, Kangas) were proper Collingwood wins. Only those 3 could be argued as having flattered them, but as per above, they did what was required vs the opposition faltering.But ultimately, they did it. They are now top 4, and only need three good days to win the flag. They could achieve that, for sure. The argument about if their record flattered them (and I think it does - but I'd say that about any team)
We can say this about any game when talking momentum. Another AFL team’s 5 goal win could be attributed to moments and 50/50 contests going their way, which then allowed them to put a result beyond reasonable doubt. An umpiring call which creates a 12 point turnaround in the third turning a margin from 18 points to 30 points at 3QT could be the definitive moment where AFL Team B subconsciously turns off.So now to address your questions (hopefully I get the reply edit right and don't wreck the formatting):
The articles I've posted. They haven't necessarily shown their ability to, they more just have. Is it because they are a clutch 4th quarter team? Maybe. Is it because they had a remarkable string of lucky wins? Maybe.
Based on the articles I've read, a team that wins the most close games ever in 125 odd years got lucky.
Doesn't mean they aren't a good team or a bunch of talented players, all well coached as well.
With 2 minutes to go and a goal in it, anything can happen. The bounce of the ball, the fact both teams have kicked about the same all game. A single clearance can decide it. Being about 50/50 makes sense.
If the Pies have won so many close ones, it means they kept themselves in just as many contests and turned the tide in their favour. You’re not within 3-4 goals at 3QT unless you’ve played the game on your terms at stages in the first 3 quarters.
Supporters yes, but players? Nah.I suppose - but all sport is subject to randomness. We routinely compare seasons past and present anyway. And we often think what our team did 50 years ago is somehow relevant to what they might do next week.
Some Geelong fans still worry about our EF from 2012 somehow mattering this week.
You’re not saying anything wrong and people would question a percentage of 104%, but doesn’t mean it’s right is all I’m arguing. What people think of a percentage of 104% v Geelong’s 144% will obviously mean nothing next Saturday to the 36 players out there. That’s all I’m saying. It won’t cheapen Collingwood’s position to the 18 in the hoops, as rare as it may be. It won’t give them an extra 5% effort - thus it means nothing because the 16 wins was enough to have the 18 in B&W stripes to be out there playing against them.Exactly. What is more important here: 16 wins (very good), or scoring 1.04 points for every 1 point conceded across a season (pretty average).
Some people here think this Collingwood side, holistically, have maybe won more games than you'd expect a 104% side to win. Whether that is true or not is now also kind of irrelevant. They did, and they are top 4. That's what you aim for, so the way they got there is of academic interest now, really.
I wasn’t potting Geelong’s first week final’s record. I was merely attributing it to why Geelong may’ve faltered in 2014. Not their 110%. It can equally be argued as the reason they didn’t win.Agreed - I'm not extrapolating Geelong's 2014 finals to suggest straigth sets for this Collingwood side. My point was Geelong won 7 close games and lost 0. Their 110% was probably more reflective of their quality that year than their 17 wins.
Again, not a pot at your argument, but as mentioned, it’s equally 11-3 from 13 points as it is 11-0 from 12 points. Arbitrary figures can push/pull any argument in any direction for the narrator.Yes, you could. And I agree. I think they were better than bottom 2 last year.
Yes, and I acknowledged my mistake on the 11-0. And yeah, based on the correct win / loss I retracted that 1 in a 100,000 thing and explained how I got it.
That’s it at the end of the day. Any side from here on in needs to play a few more games of quality footy, and they win the ultimate reward. What’s transpired previously has no bearing on that.I picked 12 points or less because of this article, particularly the bolded part: Don't ever write 'em off! Pies smash record for close wins
"With Jamie Elliott sinking a second enemy in the space of a month – having kicked the winner after the siren against Essendon in round 19 – the Magpies banked an 11th win by less than 12 points this year.
Melbourne did it eight times in 1989, while only nine teams have done it seven times in a single season.
In fact, nine of Collingwood's 11 wins have been by single digits, and six have been by less than a straight kick, including twice against the Blues and once against Essendon.
No one has won more than seven games in a single season by less than 10 points. Port Adelaide did it in 2002, Footscray in 1944 and Carlton in 1914.
It means Collingwood's percentage of just 104.3 per cent is the lowest by a top-four side since Melbourne in 1998 and the third-lowest of the AFL era."
12 points was in my mind because of that AFL.com.au article - it wasn't arbitrarily chosen to make try Collingwood look bad by any means.
I acknowledged I incorrectly conflated the 11 wins record with them being 11-0.
Well, yeah maybe they do. I'm not arguing I have the gospel truth. Maybe 16 wins will ultimately prove to be more important. Ultimately, win enough games and % becomes irrelavant, so Collingwood achieved that. I've noted they could win the flag from here, and are a good chance to win the QF next weekend. I wanted Carlton to win so we didn't face Collingwood. They make me very nervous, you guys play us well.
Completely true! I actually made that very point in the post immediately above yours:
No, Collingwood were better than a bottom 2 team last year in my opinion. The Buckley situation wouldn't have helped things.
Agree - and I say again, I am not trying to be disrespectful.
Again, I would say imagine Carlton finished top 4 with a VFL/AFL record number of close wins and a 16-6 record with 104%. Would a part of you not be surprised at those numbers?
Or just seeing a totally anonymous 16-6 and 104%. Surely you would double take at that combination?
The uniqueness of it makes what is more important or indicative of Collingwoods quality this year - wins or % - a live question.
I don't have the answer, I'm just interested in it.
And again, you only need 3 good days from here and you are premiers. You have a lot of seriously good footballers and what looks to be a good coach, so it could definitely happen.
Best of luck next week.
Last edited:
This is the important question though - are we asking what the odds are if we were to replay the last few minutes?
Because a lot of Collingwood’s close wins have been defending leads, which places them as the favourite due to having the lead in the first place. Only two of Collingwood’s close wins - Essendon and Carlton - did they take the lead inside the last 5 minutes. And in both games they were thundering home with momentum which changes the dynamic completely.
I think this is the crux of my point.
If someone flips a coin in front of you 100 times and it lands on heads 100 times, why is that the case?
Was each flip a 50/50 and it ended in a 1 in bajillion random chance? Or was it more likely a fake that had two heads on it?
Not all close games are created equal. And indeed, the margin we pick to define them will always be arbitrary. A team that has a 5 goal lead all day and concedes 3 goals in the last minute has won much more comfortably than a team who has been a goal down all day then kicks 3 in the final minute. Yet they both show 2 goals as the final margin.
This is the issue that exists with this analysis though: teams’ form will always change from one season to another.
I remember Hawthorn 2016 being discussed at the time after they won all those close games - and it was pointed out that they didn’t in 2015. What that ignores however is the clumping of games. All their close losses in ‘15 were in the first 8 rounds, before they’d hit top form. They lost to a very young GWS team along with Essendon who went on to finish bottom 4. Their form line and style an entire year later was very different, to the point where it can confound results like that. But simply stating one year was bad and one year was good isn’t actually proof until you can eliminate the other variables in between - which is practically impossible to do.
Absolutely, I love the Squiggle and final siren’s work. There’s always an important question to ask though: is the sample you’ve chosen representative of the entire population?
There’s a fair case to be made that Collingwood is better than average in these scenarios (having to take the lead late) given their rebound power this season. But they’ve also demonstrated a great ability to lock down and defend a lead. I don’t think it’s unreasonable to say they have many other teams covered in this area - at least at present. Who knows what it will look like next year though.
Geelong in recent years have performed poorly in finals. They crumbled in 2014 simply because they didn’t show up in the first half against North. This is a team who they beat very soundly twice previously in the year.
17 they ran into a far superior opponent who blew them off the park.
I think what keeps Pies supporters optimistic is that they’ve shown they have weapons that can trouble the best teams. Beating Melbourne twice is a testament to that. And at the end of the day, if we find ourselves in a close finish, there’s no doubt the group will believe in their ability to get it done - which is a big hurdle in itself.
Anyway it certainly is a very interesting discussion and a curious anomaly!
All fair, and I don't challenge the different interpretation. It's largely guess work and different interpretations of data.
I think we are talking around each other on a few points - I guess my Hawthrlorn point was from 2012 - 2016 they were always a good team. But their record in close games fluctuated. So while they were broadly "good" for the whole period, their close game record was both good and bad in individual years. Suggests overall ability carries across, but luck doesn't? Different conclusions can be drawn, I guess.
Otherwise on Geelong 2014 and 2017, I was just talking H&A. Forget how finals went for them and why...
2017 especially Geelong won 5 games they probably shouldn't have, including two where their opponents missed match winners after the siren.
If two events outnof their control had happened, they were 7th. Lose all 5 they aren't even in the finals.
Instead 2nd after H&A (and beaten by better teams in two finals).
I'd say 2nd after H&A flattered then due to some lucky wins.
2014, same deal. And as in another post of mine, I think 110% (indicates pretty average) was probably more reflective of their season that year than 17 wins (indicates pretty exceptional)...
But yeah, 16-6 and 104% is highly unusual.
But win enough to be top 4 and you'll be top 4. Collingwood did, so it's all about the next month now.
I've enjoyed reading your challenges to my thoughts though, thanks for putting in the time.
I by no means think I'm a guru with all the answers!
And again, definitely not trying to belittle Collingwood or their efforts this year.
- Aug 11, 2008
- 8,962
- 12,263
- AFL Club
- Collingwood

Fair enough - I posted links to statistical analysis that states close games are coin flips. Here is one:
Close Games in VFL/AFL History: Do Successful Teams Win Them? — Matter of Stats
Recently, we've looked at the history of margins , of blowouts, mismatches and upsets , and the history of conversion rates . Today we'll be looking at the history of close games, which I'll define as games that are decided by a goal or less.
And it makes sense - a game with a kick in it with 2 minutes left can go either way. Probably slightly favouring the better team, but at that point the outcome is largely random.
Yes, I've acknowledged I missed the Lions result and WC and Geelong are pretty close to 2 goals, so included them in a subsequent post as well.
I think I conflated an article about the 11 wins by 2 goals or less being a single season record with them being 11-0 in such games. 11-3 in them is still incredible.
The 1 / 100,000 are the odds of 10 coin flips being heads in a row (unless I miscalculated) - 50% x 50% etc 10 times = .00097%. I believe .00097% translates to about 1 in a 100,000 I believe. Obviously with my error on the 11-0 this has far less relevance and I'll retract it.
The regression to the mean holds in terms of season records, absolutely. Good teams tend to string good seasons together regressing to the mean. Bad teams string bad seasons together.l regressing to the mean.
The same isn't true of teams that win the close games one season winning them the next. It oscillates randomly.
How many of Collingwoods 11 wins could have easily gone the other way? Quite a lot.
Conversely, if the Brisbane, WC and Geelong games had also gone the other way, you'd be top!
The analysis I've read and posted suggests that all close games could basically go either way. And the myth of the "clutch" team is usually just post hoc analysis of a team that got lucky in the close ones. Like Geelong 2014 and 2017.
Don't know if you follow Final Siren or Squiggle but he covers this kind of thing better than I do. A lot of the links I've posted I followed from his blog post here:
Squiggle: AFL prediction & analysis
Squiggle is the home of computer-aided AFL footy tipping
View attachment 1491526
As always, I've said this same stuff about Geelong in both 2014 and 2017. Top 4 but a lot of very lucky wins on both years.
Even this year, we (being Geelong) are pretty lucky. 13 win streaks are rare, and we wouldn't be top without one.
I'm not having a go at Collingwood or trying to belittle them. I'm just interested in this, and like to try discuss it. Granted my figures are likely to be out in some instances.
It's finals now, and the season record is irrelevant.
I remember well what Collingwood did to Geelong from 4th last time we finished top.
All the best to you all and again - I was trying to discuss something that interested me (as an acknowledged statistician layperson) and meant no disrespect to Collingwood.
There is romance in sport being "all about performing on the day" etc, but probability rules all.
As a team, you wouldn't want to be basing your seasons off winning 11 games by 2 goals or less each year, because given its happened once in VFL/AFL history, it's pretty remarkable.
16 wins is terrific, 104% is pretty ordinary and speaks to their reliance on a lot of close (and more than a few quite lucky) wins. What happens in finals is dependent on the day now and Collingwood could definitely win the premiership from here.
I think its more about Pies play freely and on instinct when they have nothing to lose and are behind on the scoreboard.
Conversely when they're in front, they lock up and play slow and usually give up 4-6 goal leads as evidenced in most games including Geelong earlier in the year.
Pressure around the carrier is another huge part to their gsmeplan which might also explain the intensity lifts when they're behind and in the dying minutes of the game.
I guess its more about momentum than luck.
But hey, I'm no statistician.
Thank you for clarifying and apologies, I wasn’t having a direct dig at you.
Can’t subscribe to this. 104% doesn’t necessarily mean 1.04 for every 1. Look at GCS’s 102.8% - they had 13 of 22 games decided by a margin above 4 goals (7W, 6L) and were unfortunate to finish 6 wins less and 8 positions lower than Collingwood.
Melbourne, for example, lost the same amount of games as the Pies this year and had 3 losses above 4 goals, same as Collingwood.
They also had 7 wins by 5 goals or more against bottom 10 sides vs Collingwood’s 1 which attributed to their 130%. Outside the Lions, whom they bullied twice, they had just one win against a top 8 side by 5 goals or more (against Freo), just like we did, also against Freo.
Would it not be the same argument that Melbourne, and other top 4/8 sides are flat track bullies then? It’s just a rhetorical question, but I’m looking at the situation from a different lense as Melbourne’s percentage was 130% v Collingwood’s 104% from effectively the same win/loss situations.
First few, you say was luck/fluke, but when it become a habit, and we started studying what the Pies were doing, it became evident it’s been trained, and the Magpie senior players were leading this late in games with tactics. It became less luck/bounce of a footy, and of the former. It’s effectively the definition of clutch IMO, as smug as that may sound.
Manner of wins, with only really 2-3 (Dons, Blues mk2, Kangas) were proper Collingwood wins. Only those 3 could be argued as having flattered them, but as per above, they did what was required vs the opposition faltering.
We can say this about any game when talking momentum. Another AFL team’s 5 goal win could be attributed to moments and 50/50 contests going their way, which then allowed them to put a result beyond reasonable doubt. An umpiring call which creates a 12 point turnaround in the third turning a margin from 18 points to 30 points at 3QT could be the definitive moment where AFL Team B subconsciously turns off.
If the Pies have won so many close ones, it means they kept themselves in just as many contests and turned the tide in their favour. You’re not within 3-4 goals at 3QT unless you’ve played the game on your terms at stages in the first 3 quarters.
Supporters yes, but players? Nah.
You’re not saying anything wrong and people would question a percentage of 104%, but doesn’t mean it’s right is all I’m arguing. What people think of a percentage of 104% v Geelong’s 144% will obviously mean nothing next Saturday to the 36 players out there. That’s all I’m saying. It won’t cheapen Collingwood’s position to the 18 in the hoops, as rare as it may be. It won’t give them an extra 5% effort - thus it means nothing because the 16 wins was enough to have the 18 in B&W stripes to be out there playing against them.
I wasn’t potting Geelong’s first week final’s record. I was merely attributing it to why Geelong may’ve faltered in 2014. Not their 110%. It can equally be argued as the reason they didn’t win.
Again, not a pot at your argument, but as mentioned, it’s equally 11-3 from 13 points as it is 11-0 from 12 points. Arbitrary figures can push/pull any argument in any direction for the narrator.
That’s it at the end of the day. Any side from here on in needs to play a few more games of quality footy, and they win the ultimate reward. What’s transpired previously has no bearing on that.
All good - to be honest, I do disagree with you generally, but who is to say who is correct!
I think Collingwood won more than they "should" have, you think they trained and prepared to win close ones and did.
Totally fine to disagree!
But we do both agree that it's now about winning at least 3 finals.
One thing I will correct you on is the % representing points for and against - that's exactly how it works. 200% means you scored double what your opponents did - or 2 points for every 1 point against. 150% means you scored 1.5 points for every point conceded.
As always, with that many close results and such neutral for and against, it is hard to either win 16 or lose 16 games.
However Collingwood did it, they did it! And that is ultimately all that matters now.
And again, best of luck next week. Despite how I might view the luck inherent in their season, I'm not thrilled to be facing Collingwood in the QF. You guys got us from 4th not very long ago.
Similar threads
- Replies
- 55
- Views
- 3K
- Replies
- 28
- Views
- 1K
