


Of course, umpires are prone to making poor decisions and when more rules get introduced there is more for them to be thinking about, and they will make more poor decisions.The problem is they are calling play on when a player even feigns a handball... or even looks to kick it somewhere... some of the play on calls have been absolutely ridiculous.
Navigation
Install the app
How to install the app on iOS
Follow along with the video below to see how to install our site as a web app on your home screen.
Note: This feature may not be available in some browsers.
More options
You are using an out of date browser. It may not display this or other websites correctly.
You should upgrade or use an alternative browser.
You should upgrade or use an alternative browser.
Analysis New Rules Stats
- Thread starter CaptchaProofBot
- Start date
- Tagged users None
Round 10 scoring update
| Year | 2021 | 2020 | 2019 | 2018 | 2017 | 2016 | 2015 | 2014 | 2013 | 2012 |
| Round 10 average | 83.8 | 75.8 | 75.2 | 74.8 | 89.3 | 89.4 | 85.9 | 95.3 | 85.4 | 93.1 |
| Round 10 2021 - % above or below | +10.5% | +11.5% | +12.1% | -6.2% | -6.3% | -2.5% | -12.0% | -1.9% | -10.0% | |
| Round 10 - lowest since | 2020 | 2019 | 2018 | 1968 | 2015 | 2015 | 2013 | 2013 | 2011 | 2011 |
| Round 10 - highest since | 2017 | 2017 | 2017 | 2017 | 2016 | 2014 | 2014 | 2008 | 2012 | 2009 |
| Season average to Round 10 | 82.4 | 77.4 | 80.4 | 83 | 92.4 | 92.2 | 86.8 | 86.6 | 94.8 | 90.1 |
| Season to Round 10 2021 - % above or below | +6.4% | +2.5% | -0.8% | -10.8% | -10.6% | -5.0% | -4.9% | -13.1% | -8.5% | |
| Season to Round 10 - lowest since | 2020 | 1966 | 1966 | 1968 | 2016 | 2015 | 2014 | 1968 | 2012 | 1974 |
| Season to Round 10 - highest since | 2018 | 2019 | 2018 | 2017 | 2013 | 2013 | 2013 | 2013 | 2008 | 2011 |
Round 11 scoring update
| Year | 2021 | 2020 | 2019 | 2018 | 2017 | 2016 | 2015 | 2014 | 2013 | 2012 |
| Round 11 average | 83.9 | 80.9 | 82.3 | 86.2 | 87.3 | 82.7 | 77.7 | 85.0 | 85.3 | 89.4 |
| Round 11 2021 - % above or below | +3.8% | +2.0% | -2.6% | -3.8% | -1.5% | +8.1% | -1.2% | -1.5% | -6.1% | |
| Round 11 - lowest since | 2020 | 2015 | 2015 | 2016 | 2016 | 2015 | 1989 | 1999 | 1999 | 2011 |
| Round 11 - highest since | 2018 | 2019 | 2018 | 2017 | 2012 | 2014 | 2014 | 2013 | 2012 | 2009 |
| Season average to Round 11 | 82.5 | 77.7 | 80.6 | 83.3 | 92 | 91.3 | 86.2 | 86.5 | 94.2 | 90 |
| Season to Round 11 2021 - % above or below | +6.2% | +2.5% | -1.0% | -10.3% | -9.6% | -4.3% | -4.6% | -12.4% | -8.3% | |
| Season to Round 11 - lowest since | 2020 | 1966 | 1966 | 1968 | 2016 | 2015 | 1968 | 1968 | 2012 | 1968 |
| Season to Round 11 - highest since | 2018 | 2019 | 2018 | 2017 | 2013 | 2013 | 2014 | 2013 | 2008 | 2011 |
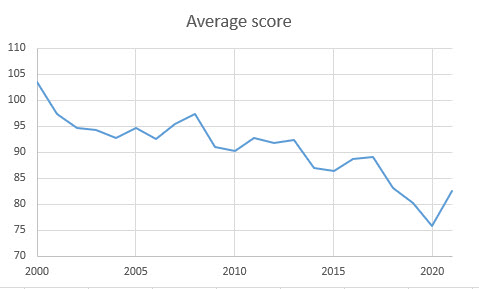
Average scores since 2000 (2020 scores multiplied by 1.25)

Recent rule changes... success, or just perpetuating the downward trend with added angst?
Recent rule changes... success, or just perpetuating the downward trend with added angst?
- Nov 26, 2015
- 6,502
- 14,617
- AFL Club
- Richmond
- Thread starter
- #55
so I'm just looking at say 2000 - 2015....it's been going down fine on its own...without any recent rule changes ?Average scores since 2000 (2020 scores multiplied by 1.25)
Recent rule changes... success, or just perpetuating the downward trend with added angst?
RichLeMonde
Club Legend
That is a very stark graph!Average scores since 2000 (2020 scores multiplied by 1.25)
Recent rule changes... success, or just perpetuating the downward trend with added angst?
Round 12 scoring update
Healthy scoring round, albeit from a sample of only six games.
| Year | 2021 | 2020* | 2019 | 2018 | 2017 | 2016 | 2015 | 2014 | 2013 | 2012 |
| Round 12 average | 85.9 | 70.8 | 78.2 | 81.1 | 85.1 | 93.9 | 97.9 | 85.8 | 85.8 | 88.2 |
| Round 12 2021 - % above or below | +21.4% | +9.9% | +6.0% | +1.0% | -8.5% | -12.3% | +0.2% | +0.2% | -2.6% | |
| Round 12 - lowest since | 2020 | 1988 | 1989 | 1991 | 2011 | 2014 | 2014 | 2013 | 2011 | 2011 |
| Round 12 - highest since | 2016 | 2019 | 2018 | 2017 | 2016 | 2015 | 2001 | 2012 | 2012 | 2010 |
| Season average to Round 12 | 82.7 | 77.1 | 80.4 | 83.2 | 91.6 | 91.5 | 86.9 | 86.4 | 93.7 | 89.9 |
| Season to Round 12 2021 - % above or below | +7.2% | +2.9% | -0.5% | -9.6% | -9.6% | -4.8% | -4.3% | -11.7% | -8.0% | |
| Season to Round 12 - lowest since | 2020 | 1966 | 1966 | 1968 | 2016 | 2015 | 2014 | 1968 | 2012 | 1970 |
| Season to Round 12 - highest since | 2018 | 2019 | 2018 | 2017 | 2013 | 2013 | 2013 | 2013 | 2008 | 2011 |
Healthy scoring round, albeit from a sample of only six games.
- Nov 26, 2015
- 6,502
- 14,617
- AFL Club
- Richmond
- Thread starter
- #58
The stats don't lie: How has footy changed in 2021?
Key stats reveal just how different footy looks this year
interesting that the STAND rule hasn't encouraged more corridor use:
"Corridor use, meanwhile, has remained relatively unchanged compared to the past two seasons at 27.8 per cent, an increase of 0.3 per cent compared to 2019."
Swanks McSwankserton
Senior List
The stats don't lie: How has footy changed in 2021?
Key stats reveal just how different footy looks this yearwww.afl.com.au
interesting that the STAND rule hasn't encouraged more corridor use:
"Corridor use, meanwhile, has remained relatively unchanged compared to the past two seasons at 27.8 per cent, an increase of 0.3 per cent compared to 2019."
LOL this propaganda piece ticked me off
 ,
," the higher scoring the AFL craved has held after more than 100 games this season "
" The result is a slight increase on 2019 scoring levels (80.9) but well up on the adjusted averaged of 75.7 in 2020."
" Steve Hocking said ... rule adjustments in 2021 had provided a better balance between attack and defence overall."
Surely the omission of any pre-2019 stat is deliberate? No meniton of the fact that 2019 itself was the lowest scoring season in 50 years, and 100% definitely not the end goal they were trying to reach with the rule changes. There's zippity doo dah proof that the rule changes have had any iota of impact on the scoreboards at all; the jump up back to 2019 levels is the simple result of regular quarter lengths again.
On another note it is interesting how big of a dip 2020 is even after adjusting for shorter times, seems footy doesn't scale down well, which I am thankful for cos the league'll be less inclined to try and reduce game time in the future.
What are the stats on goals from free kicks compared with previous years? Seems to be easier to get a kick from the umpires in scoring range this year.
It'd be fantastic if the league gave us some basic stats on scoring sourcesWhat are the stats on goals from free kicks compared with previous years? Seems to be easier to get a kick from the umpires in scoring range this year.
But that seems beyond them
Gave you a 'like' but I'll add that no-one cares if scores average 89 or 90. If the rule changes have only added 1 point to the overall average they've failed.LOL this propaganda piece ticked me off
" the higher scoring the AFL craved has held after more than 100 games this season "
" The result is a slight increase on 2019 scoring levels (80.9) but well up on the adjusted averaged of 75.7 in 2020."
" Steve Hocking said ... rule adjustments in 2021 had provided a better balance between attack and defence overall."
Surely the omission of any pre-2019 stat is deliberate? No meniton of the fact that 2019 itself was the lowest scoring season in 50 years, and 100% definitely not the end goal they were trying to reach with the rule changes. There's zippity doo dah proof that the rule changes have had any iota of impact on the scoreboards at all; the jump up back to 2019 levels is the simple result of regular quarter lengths again.
On another note it is interesting how big of a dip 2020 is even after adjusting for shorter times, seems footy doesn't scale down well, which I am thankful for cos the league'll be less inclined to try and reduce game time in the future.
PS. I'll also say that people want to watch good play rather than guys having shots at goal. If a side plays well usually they'll score well anyway.
A dire day of footy for spectators. But the usual suspects in the media will ignore what doesn't suit their narrative.
Swanks McSwankserton
Senior List
Gave you a 'like' but I'll add that no-one cares if scores average 89 or 90. If the rule changes have only added 1 point to the overall average they've failed.
PS. I'll also say that people want to watch good play rather than guys having shots at goal. If a side plays well usually they'll score well anyway.
I agree on the large scores are not related to good games and good play being most important (although personally I've found games where winner <60-70 are just slogs to get through. Even the tight ones only the last 5-10 minutes are usually rewatchable).
I'm just mad at the nature of the article that insinuates something that isn't true, while pretending like its unbiased fact. There's no end of media flogs willing to speculate wildly and horrendously about things they couldn't possibly know, but at least we alwaus know they don't know and that it's just their opinions. There's also a number who look at stats and use them to backwards engineer (take stab in the dark guesses really on) a team's tactics, but again we know they don't know and that those stats add little credence to their theories. But this is just blatant cherry picking to support a foregone position and make the AFL look good, pesented as if it were an unbiased full "the stats don't lie" story.
threenewpadlocks
Brownlow Medallist
2020 lower-scoring (quarters adjusted even) simply because a) more games were at night, and night games are typically lower scoring even when accounting for other factors and b) the venues used are typically more lower-scoring - minimal games under the Dome where no wind and rain means games are higher scoring.
It's impossible to know whether this year is higher scoring than what last year would have been, given those factors.
It's impossible to know whether this year is higher scoring than what last year would have been, given those factors.
queensberryrules
Club Legend
- Aug 16, 2019
- 2,670
- 3,722
- AFL Club
- Collingwood

Gee wizz, did RFC not just destroy Pies as a club, but football itself, since 2017?That is a very stark graph!
Round 13 scoring update
| Year | 2021 | 2020* | 2019 | 2018 | 2017 | 2016 | 2015 | 2014 | 2013 | 2012 |
| Round 13 average | 77.9 | 66.5 | 86.6 | 75.9 | 82.7 | 84.3 | 79.7 | 94.9 | 83.7 | 91.3 |
| Round 13 2021 - % above or below | +17.1% | -10.0% | +2.7% | -5.7% | -7.6% | -2.2% | -17.9% | -6.9% | -14.6% | |
| Round 13 - lowest since | 2020 | 1987 | 2018 | 1989 | 2015 | 2015 | 1997 | 2013 | 2006 | 2010 |
| Round 13 - highest since | 2019 | 2019 | 2014 | 2017 | 2016 | 2014 | 2014 | 2011 | 2012 | 2011 |
| Season average to Round 13 | 82.4 | 76.3 | 80.7 | 82.8 | 91.1 | 91.2 | 86.5 | 87.1 | 93.2 | 90 |
| Season to Round 13 2021 - % above or below | +8.0% | +2.1% | -0.4% | -9.5% | -9.6% | -4.7% | -5.4% | -11.5% | -8.4% | |
| Season to Round 13 - lowest since | 2020 | 1966 | 1966 | 1968 | 2015 | 2015 | 1968 | 1968 | 2012 | 1970 |
| Season to Round 13 - highest since | 2018 | 2019 | 2018 | 2017 | 2016 | 2013 | 2014 | 2013 | 2008 | 2011 |
Round 14 scoring update
After three healthy rounds (10-12), the shortened Round 14 produced the lowest average score for that round since the wet Saturday in 1980.
| Year | 2021 | 2020* | 2019 | 2018 | 2017 | 2016 | 2015 | 2014 | 2013 | 2012 |
| Round 14 average | 71.3 | 81.6 | 77.5 | 74.3 | 89.3 | 83.5 | 84.3 | 86.2 | 85.3 | 95.7 |
| Round 14 2021 - % above or below | -12.6% | -8.0% | -4.1% | -20.1% | -14.6% | -15.4% | -17.3% | -16.4% | -25.5% | |
| Round 14 - lowest since | 1980 | 2019 | 2018 | 1980 | 2016 | 1997 | 2003 | 2013 | 2010 | 2010 |
| Round 14 - highest since | 2020 | 2017 | 2017 | 2017 | 2012 | 2015 | 2014 | 2012 | 2012 | 2011 |
| Season average to Round 14 | 81.9 | 76.6 | 80.6 | 82.4 | 90.9 | 90.8 | 86.3 | 87.1 | 92.6 | 90.4 |
| Season to Round 14 2021 - % above or below | +6.9% | +1.7% | -0.5% | -9.9% | -9.7% | -5.1% | -5.9% | -11.5% | -9.4% | |
| Season to Round 14 - lowest since | 2020 | 1966 | 1967 | 1968 | 2016 | 2015 | 1968 | 1968 | 2012 | 2010 |
| Season to Round 14 - highest since | 2018 | 2019 | 2018 | 2017 | 2013 | 2013 | 2014 | 2013 | 2008 | 2011 |
After three healthy rounds (10-12), the shortened Round 14 produced the lowest average score for that round since the wet Saturday in 1980.
Lynchy04
Cancelled
- Apr 20, 2017
- 2,532
- 3,150
- AFL Club
- Richmond
With all the rule changes that came in this year I expected a lot more free flowing footy with a lot of goals but coaches find a way to make it dour.
The stand rule is embarrassing it looks shocking to watch players just stand there giving up letting a play just jolt away.
Found the quality of footy has gone down a lot. The “big” games have been let downs which hasn’t helped and outside of Tigers games I’ve found it really hard to sit down and enjoy a game of footy that is a neutral game for me.
Seems like teams are trying to cover more ground to defend the quick play on due to stand , the players are spent and there has been a lot of skill errors which could be due to the amount of ground they are covering?
It’s funny I’ve seen bits and pieces of VFL games this year and there’s a lot of VFL listed players that have more footy smarts and better skills than AFL listed players.
The AFL has been so hellbent on changing the rules because of the Roos era of flooding probably trying to get back to the best days when you had huge scores and stars kicking bags that now everyone has to be an athlete first and foremost before having footy IQ and skills.
Significantly less contested footy as teams move forward incrementally through short passing. Initially felt like an improvement, but like souped-up hi-fi it becomes fatiguing before long. Many goals seem to be coming from free kicks which is keeping 2021’s nose in front of 2019 on scoring.
Yeah it was a shitty evening and a vague threat of COVID lingers, but sub-15K to a Richmond game at the MCG after Melbourne’s been starved of footy for a month? Does the public smell a rat?
Yeah it was a shitty evening and a vague threat of COVID lingers, but sub-15K to a Richmond game at the MCG after Melbourne’s been starved of footy for a month? Does the public smell a rat?
2020 should be taken out of the equation. Even with weighting the quarters were so short some teams didn't even score . There was some stat where there were 22 games where teams didn't score in a quarter when the season average was normally about 3.
Maybe Ron the Bear has that info?
Maybe Ron the Bear has that info?
2020 should be taken out of the equation. Even with weighting the quarters were so short some teams didn't even score . There was some stat where there were 22 games where teams didn't score in a quarter when the season average was normally about 3.
Maybe Ron the Bear has that info?
There were 22 scoreless quarters last year. Average for the previous decade was 6.
149 goalless quarters, last decade average 77.3.
Obviously extrapolating by time is only a simulation, and no substitute for actual data. Shorter quarters made it easier to keep up defensive intensity. That's why 2020 is asterisked in the preceding tables.
Round 15 scoring update
This round somewhat dented Steve Hocking's "genius" reputation, and the season's gains over 2019 fell to a solitary point per team, per match.
Excluding last season's approximation achieved by extrapolating for shortened quarters, this was the lowest-scoring Round 15 since 1968.
| Year | 2021 | 2020* | 2019 | 2018 | 2017 | 2016 | 2015 | 2014 | 2013 | 2012 |
| Round 15 average | 70.5 | 62.2 | 74.3 | 93.3 | 84.1 | 82.5 | 76.9 | 84.8 | 90.7 | 90.0 |
| Round 15 2021 - % above or below | +13.4% | -5.2% | -24.4% | -16.1% | -14.5% | -8.4% | -16.9% | -22.3% | -21.7% | |
| Round 15 - lowest since | 2020 | 1965 | 1981 | 2017 | 2016 | 2015 | 1981 | 2006 | 2012 | 2010 |
| Round 15 - highest since | 2019 | 2019 | 2018 | 2008 | 2014 | 2014 | 2014 | 2013 | 2011 | 2011 |
| Season average to Round 15 | 81.1 | 76 | 80.1 | 83.1 | 90.4 | 90.4 | 85.7 | 86.9 | 92.4 | 90.4 |
| Season to Round 15 2021 - % above or below | +6.8% | +1.2% | -2.4% | -10.3% | -10.2% | -5.3% | -6.6% | -12.2% | -10.2% | |
| Season to Round 15 - lowest since | 2020 | 1966 | 1967 | 1968 | 2016 | 2015 | 1968 | 1968 | 2012 | 2010 |
| Season to Round 15 - highest since | 2018 | 2019 | 2018 | 2017 | 2013 | 2013 | 2014 | 2013 | 2008 | 2011 |
This round somewhat dented Steve Hocking's "genius" reputation, and the season's gains over 2019 fell to a solitary point per team, per match.
Excluding last season's approximation achieved by extrapolating for shortened quarters, this was the lowest-scoring Round 15 since 1968.
- Jul 16, 2013
- 13,447
- 17,168
- AFL Club
- Essendon
It is time to go back to 16 on the field only.
Create more space and the scoring will go up.
Create more space and the scoring will go up.
Agree, its simple and it worked in the AFLW in increasing score and reducing congestion.It is time to go back to 16 on the field only.
Create more space and the scoring will go up.
