Not Worth A Thread - Random Bulldog Discussion

Remove this Banner Ad

Status
Not open for further replies.
If you mean the best twenty two bit it is just the best top disposal getter from each team competing against each other
and then the second ranked player competing against all the other second ranked players and so on down to number
twenty two. To use an example of average being greater than the total we can measure the second ranked player
Scott Pendlebury who had 670 Disposals off 25 Games which equates to an average of 26.8, our second ranked
player was Jackson Macrae who had 623 Disposals off 19 Games which equates to an average of 32.79 therefore
the total is greater for Pendlebury, but Macrae has the better per game average. As per usual Fossie 32 I don't
post all the good stuff as it takes up eight pages in the book.
1547979810844.png
 

Log in to remove this ad.

Average Disposals Per Game (Plus) Average Disposals Per Goal (Ladder)

Collingwood 399.12 per game, (30.08) per goal.
St Kilda 388.73 per game, (38.01) per goal.
Western Bulldogs 387.59 per game, (38.07) per goal.
Melbourne 386.24 per game, (26.17) per goal.
Adelaide 382.95 per game, (30.20) per goal.
Essendon 381.64 per game, (29.99) per goal.
Geelong 380.83 per game, (28.81) per goal.
GWS 377.88 per game, (31.60) per goal.

Hawthorn 376.46 per game, (29.24) per goal.
Port Adelaide 375.55 per game, (31.90) per goal.
Brisbane 373.45 per game, (30.89) per goal.
Sydney 371.70 per game, (31.43) per goal.
North Melbourne 367.86 per game, (28.40) per goal.
Richmond 366.79 per game, (26.52) per goal.
Fremantle 363.14 per game, (35.67) per goal.
West Coast 356.08 per game, (26.49) per goal.
Carlton 347.05 per game, (39.76) per goal.
Gold Coast 339.91 per game, (41.31) per goal.

Rounded up to two decimal places to reduce typing, but hey we made the top four on the
ladder and yet finished 16th on the second measure sums up the year pretty well. It
would be interesting to do a similar study of 2016 for the season versus the finals series
in isolation.

Bonus 2016 Season:
Western Bulldogs 410.81 per game, (32.97) per goal.

Bonus 2016 Finals:
Western Bulldogs 392.75 per game, (28.05) per goal.
 
Last edited:
The Premier Versus The Bulldogs (Disposals, Goals, Disposal Per Goal Average) 2001 to 2018.

2018: Eagles, 8,902 Disposals, 336 Goals, (26.49) Per Goal. Dogs, 8,527, 224, (38.07)
2017: Tigers, 9,118 Disposals, 331 Goals, (27.55) Per Goal. Dogs, 8,634, 260, (33.21)
2016: Dogs, 10,681 Disposals, 324 Goals, (32.97) Per Goal. It was us silly.
2015: Hawks, 10,273 Disposals, 426 Goals, (24.12) Per Goal. Dogs, 8,470, 324, (26.14)
2014: Hawks, 9,909 Disposals, 418 Goals, (23.71) Per Goal. Dogs, 7,963, 257, (30.98)
2013: Hawks, 9,339 Disposals, 414 Goals, (22.56) Per Goal. Dogs, 8,090, 283, (28.59)
2012: Swans, 9,233 Disposals, 376 Goals, (24.56) Per Goal. Dogs, 8,131, 218, (37.30)
2011: Cats, 9,568 Disposals, 426 Goals, (22.46) Per Goal. Dogs, 7,831, 306, (25.59)
2010: Magpies, 9,892 Disposals, 395 Goals, (25.04) Per Goal. Dogs, 9,758, 348, (28.04)
2009: Cats, 10,438 Disposals, 380 Goals, (27.47) Per Goal. Dogs, 10,048, 386, (26.03)
2008: Hawks, 9,377 Disposals, 408 Goals, (22.98) Per Goal. Dogs, 9,386, 405, (23.18)
2007: Cats, 9,591 Disposals, 430 Goals, (22.30) Per Goal. Dogs, 7,658, 308, (24.86)
2006: Eagles: 9,482 Disposals, 375 Goals, (25.29) Per Goal. Dogs, 8,331, 363, (22.95)
2005: Swans: 7,396 Disposals, 327 Goals, (22.62) Per Goal. Dogs, 7,352, 352, (20.89)
2004: Power: 7,750 Disposals, 406 Goals, (19.09) Per Goal. Dogs, 6,509, 280, (23.25)
2003: Lions, 7,783 Disposals, 394 Goals, (19.98) Per Goal. Dogs, 6,810, 295, (23.08)
2002: Lions, 7,491 Disposals, 416 Goals, (18.01) Per Goal. Dogs, 6,782, 342, (19.83)
2001: Lions, 7,761 Disposals, 415 Goals, (18.70) Per Goal. Dogs, 6,566, 337, (19.48)

What an epic journey through time to witness the changing face of football over the years,
it is hard not to notice that the 2016 Bulldogs had the most Disposals (10,681) of any of
the premiers since 2001 making them Numero Uno, Number One, Top Of The Tree, the
Big Cheese the Mac Daddy. Failed to mention that we had the worst Disposal to Goal
ratio since 2001, but what the hell praise the "Handball Club".
 
Being footy deprived I've recently been catching up with a few 2018 Footscray VFL games on Youtube. I tried to focus on both Young and English because these two players are the ones we really need to improve this year and start pushing for more regular games.
With Young, no doubt the talent is there. When he first appeared on the scene, he looked so impressive I thought we had another Chris Grant on our hands. Playing VFL last year he was very good at spoiling from behind and his delivery was generally very sound but it's the body contact aspect of his game that he needs to improve. He was often beaten man on man by stronger opponents and sometimes had a tendency to lose his man altogether. Hopefully, he has been in the gym to build up his upper body and has been practising body contact in contests at training. Without this development he may find himself another year mostly at VFL level.
English's situation is similar, plenty to like about his ruck work but again needs more bulk to compete against the bigger bodies. It's pretty obvious that his body shape and size is not fully formed yet and hopefully he too has been doing strengthening work in the gym.
We don't have many tall options on our list so it's very important that these two step up and push for regular selection.
PS Fletcher Roberts is very lucky he had another year on his contract because he is just marking time on the list.
 
The Premier Versus The Bulldogs (Disposals, Goals, Disposal Per Goal Average) 2001 to 2018.

2018: Eagles, 8,902 Disposals, 336 Goals, (26.49) Per Goal. Dogs, 8,527, 224, (38.07)
2017: Tigers, 9,118 Disposals, 331 Goals, (27.55) Per Goal. Dogs, 8,634, 260, (33.21)
2016: Dogs, 10,681 Disposals, 324 Goals, (32.97) Per Goal. It was us silly.
2015: Hawks, 10,273 Disposals, 426 Goals, (24.12) Per Goal. Dogs, 8,470, 324, (26.14)
2014: Hawks, 9,909 Disposals, 418 Goals, (23.71) Per Goal. Dogs, 7,963, 257, (30.98)
2013: Hawks, 9,339 Disposals, 414 Goals, (22.56) Per Goal. Dogs, 8,090, 283, (28.59)
2012: Swans, 9,233 Disposals, 376 Goals, (24.56) Per Goal. Dogs, 8,131, 218, (37.30)
2011: Cats, 9,568 Disposals, 426 Goals, (22.46) Per Goal. Dogs, 7,831, 306, (25.59)
2010: Magpies, 9,892 Disposals, 395 Goals, (25.04) Per Goal. Dogs, 9,758, 348, (28.04)
2009: Cats, 10,438 Disposals, 380 Goals, (27.47) Per Goal. Dogs, 10,048, 386, (26.03)
2008: Hawks, 9,377 Disposals, 408 Goals, (22.98) Per Goal. Dogs, 9,386, 405, (23.18)
2007: Cats, 9,591 Disposals, 430 Goals, (22.30) Per Goal. Dogs, 7,658, 308, (24.86)
2006: Eagles: 9,482 Disposals, 375 Goals, (25.29) Per Goal. Dogs, 8,331, 363, (22.95)
2005: Swans: 7,396 Disposals, 327 Goals, (22.62) Per Goal. Dogs, 7,352, 352, (20.89)
2004: Power: 7,750 Disposals, 406 Goals, (19.09) Per Goal. Dogs, 6,509, 280, (23.25)
2003: Lions, 7,783 Disposals, 394 Goals, (19.98) Per Goal. Dogs, 6,810, 295, (23.08)
2002: Lions, 7,491 Disposals, 416 Goals, (18.01) Per Goal. Dogs, 6,782, 342, (19.83)
2001: Lions, 7,761 Disposals, 415 Goals, (18.70) Per Goal. Dogs, 6,566, 337, (19.48)

What an epic journey through time to witness the changing face of football over the years,
it is hard not to notice that the 2016 Bulldogs had the most Disposals (10,681) of any of
the premiers since 2001 making them Numero Uno, Number One, Top Of The Tree, the
Big Cheese the Mac Daddy. Failed to mention that we had the worst Disposal to Goal
ratio since 2001, but what the hell praise the "Handball Club".
Yes, the most disposals and fewest goals for any premier in that period.

I'd expect that we were the only premier to play 26 games in a season too, except perhaps Collingwood in 2010 when they replayed the GF after the drawn game against the Saints.

What's also of interest is the sharp jump in premiership side disposals after 2005. After averaging around 7600 from 2001-2005 it has been averaging well over 9000 ever since. That's an abrupt 20% increase. I assume that would be reflected across all clubs for that period.

Pretty alarming that our 2018 goal tally (224) was our second worst over the whole period. The only worse year was 2012 when we kicked 218 goals under Brendan "crack in and the goals will take care of themselves" McCarthy. Even in the dark Rohde years we kicked a lot more goals than in 2018.
 
Yes, the most disposals and fewest goals for any premier in that period.

I'd expect that we were the only premier to play 26 games in a season too, except perhaps Collingwood in 2010 when they replayed the GF after the drawn game against the Saints.
No, the Lions (2003), Swans (2005), Eagles (2006) and Hawks (2015) played 26 games too.

Pretty alarming that our 2018 goal tally (224) was our second worst over the whole period. The only worse year was 2012 when we kicked 218 goals under Brendan "crack in and the goals will take care of themselves" McCarthy. Even in the dark Rohde years we kicked a lot more goals than in 2018.
McCartney was better than Rohde, only because he didn't trade away heaps of draft picks for recycled players :mad:
 
I rewatched the 2016 grand final last night for the first time in a while. On the day, I remember believing the Norm Smith order would be JJ - Boyd - Kennedy, then daylight to the rest.

Watching it again last night, I honestly couldn't believe how much impact Picken had up forward as a lot of people have always said. Guess I just didn't see it as much on the first few watches, but the number of moments of absolute desperation really shows why we've missed him so much.

Then as an outside pick, I genuinely feel Wood could have been a rightful winner too. He was just ruthless in defence all day
 
Is anyone here a member of Superbru?

I joined a couple of months ago. It's a website that focuses on mainstream sports that runs unique tipping and fantasy competitions.

They do AFL Tipping with a difference.

It has taken me a couple of months to get the hang of everything, but now that I'm used to it I'm hooked.

Its the platform Bigfooty Tipping used last year - yep took a while to get my head around it
 
Its the platform Bigfooty Tipping used last year - yep took a while to get my head around it
Now that you mention it, I do recall hearing about a BigFooty league on Superbru.

I just finished 7th in Australia in the Australian Open competition. So much fun.

Coincidentally I was also 7th in Australia in the Hamilton Playoffs in the Rugby Sevens yesterday.
 

(Log in to remove this ad.)

Hey all,

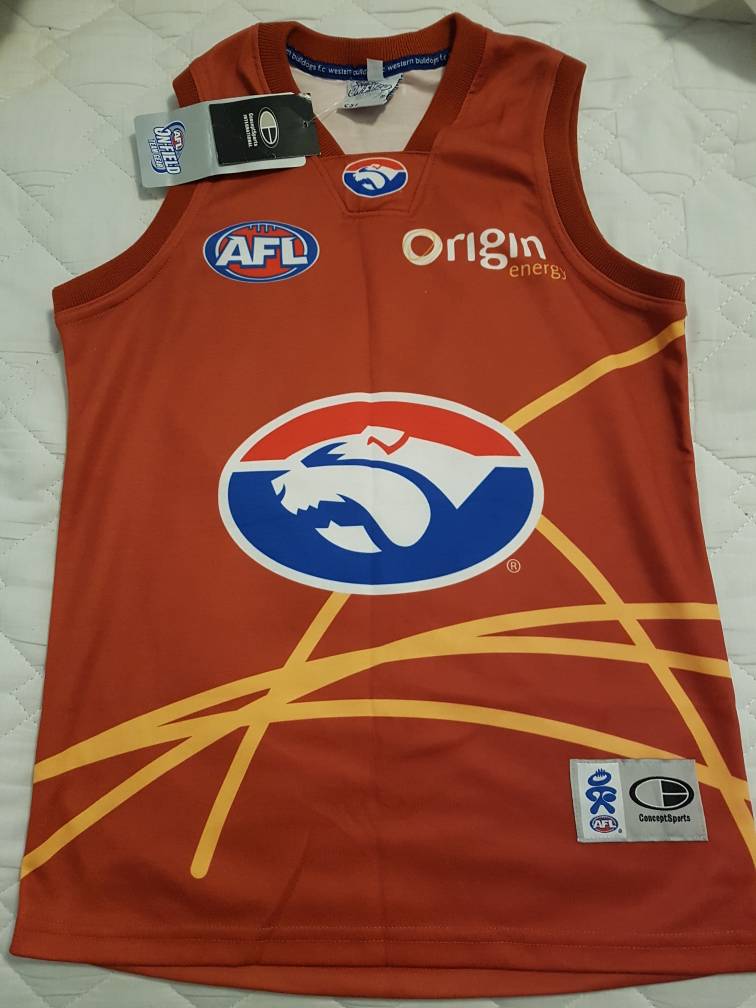
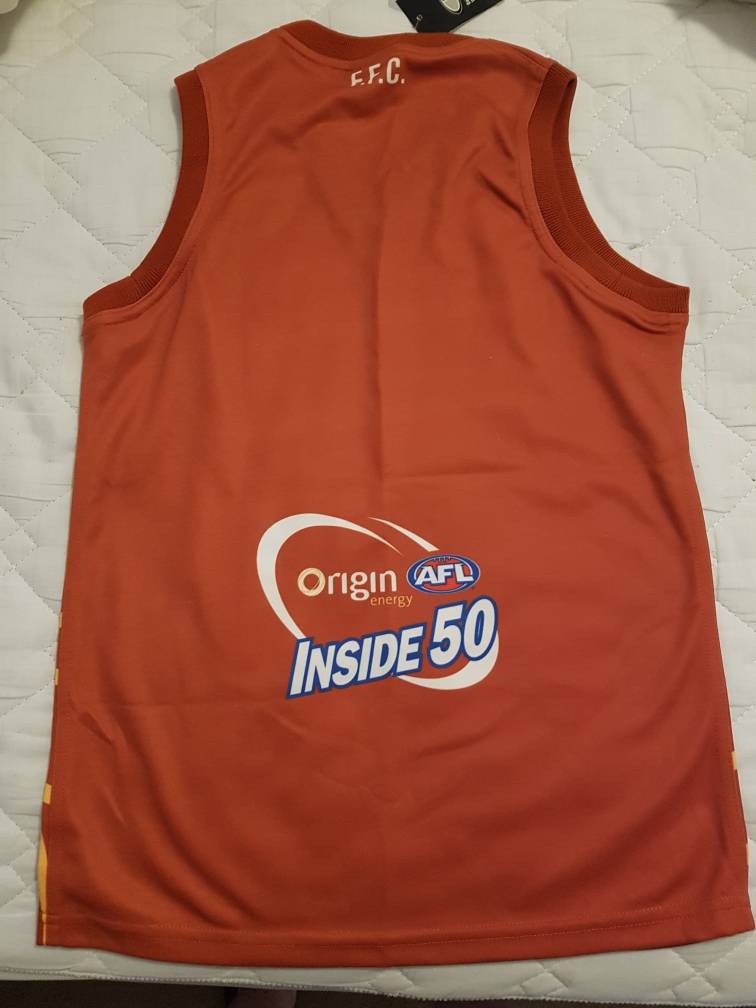
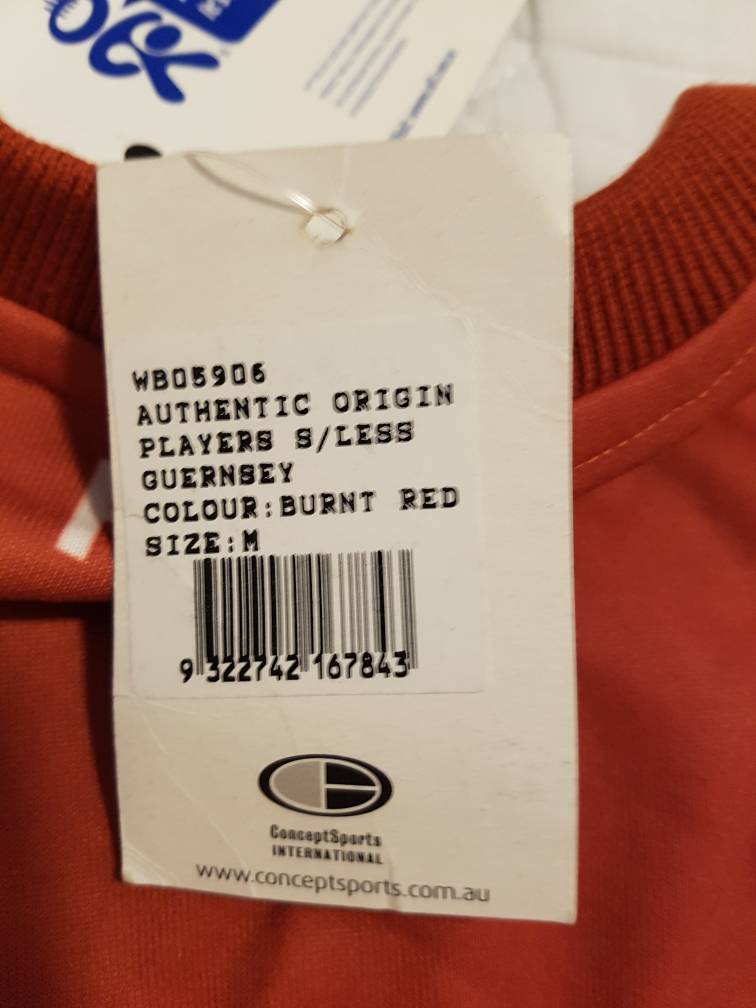
I was digging through my space saver bags and come across this bad boy.

I'm considering selling it. Any idea of market value?

Cheers
ac4527a65ce22319163eb3a84aa6b7a6.jpg
7ba2591171efbd2032504b8d3a82773b.jpg
196cb927a96764a0ac4734e45acf3652.jpg


Sent from my SM-G935F using Tapatalk
 
Kick to Handball Ratios

Round 1: (Loss) 196K; 151H; 347D; 56.48%K; 43.52%H.
Round 2: (Loss) 219K; 134H; 353D; 62.04%K; 37.96%H.
Round 3: (Win) 254K; 163H; 417D; 60.91%K; 39.09%H. (Perfect)
Round 4: (Loss) 235K; 162H; 397D; 59.19%K; 40.81&H.
Round 5: (Loss) 215K; 152H; 367D; 58.58%K; 41.42%H.
Round 6: (Win) 187K; 208H; 395D; 47.34%K; 52.66%H.
Round 7: (Win) 212K; 201H; 413D; 51.33%K; 48.67%H.
Round 8: (Win) 208K; 231H; 439D; 47.38%K; 52.62%H.
Round 9: (Loss) 212K; 186H; 398D; 53.27%K; 46.73%H.
Round 10: (Loss) 216K; 158H; 374D; 57.75%K; 42.25%H.
Round 11: (Loss) 195K; 191H; 386D; 50.52%K; 49.48%H.

Round 12: "BYE"

Round 13: (Loss) 181K; 124H; 305D; 59.34%K; 40.66%H.
Round 14: (Loss) 207K; 178H; 385D; 53.77%K; 46.23%H.
Round 15: (Win) 201K; 194H; 395D; 50.89%K; 49.11%H.
Round 16: (Loss) 203K; 172H; 375D; 54.13%K; 45.87%H.
Round 17: (Loss) 202K; 221H; 423D; 47.75%K; 52.25%H.
Round 18: (Loss) 168K; 183H; 351D; 47.86%K; 52.14%H.
Round 19: (Loss) 191K; 147H; 338D; 56.51%K; 43.49%H.
Round 20: (Win) 198K; 226H; 424D; 46.70%K; 53.30%H.
Round 21: (Win) 216K; 228H; 444D; 48.65%K; 51.35%H.
Round 22: (Win) 216K; 172H; 388D; 55.67%K; 44.33%H.
Round 23: (Loss) 233K; 180H; 413D; 56.42%K; 43.58%H. (Almost Perfect)

Kick to Handball Ratios Ladder (2018 season)

Rank 1: West Coast 63.80%K; 36.20%H.
Rank 2: Gold Coast 59.65%K; 40.35%H.
Rank 3: Carlton 58.47%K; 41.53%H.
Rank 4: Port Adelaide 58.47%K; 41.53%H.
Rank 5: Adelaide 58.37%K; 41.63%H.
Rank 6: Hawthorn 58.15%K; 41.85%H.
Rank 7: GWS 57.96%K; 42.04%H.
Rank 8: Brisbane 57.59%K; 42.41%H.

Rank 9: Essendon 57.03%K; 42.97%H.
Rank 10: Sydney 56.67%K; 43.33%H.
Rank 11: Richmond 56.50%K; 43.50%H.
Rank 12: Fremantle 55.89%K; 44.11%H.
Rank 13: Geelong 55.18%K; 44.82%H.
Rank 14: North Melbourne 54.74%K; 45.26%H.
Rank 15: Collingwood 54.51%K; 45.49%H.
Rank 16: Melbourne 54.27%K; 45.73%H.
Rank 17: Western Bulldogs 53.54%K; 46.46%H.
Rank 18: St Kilda 53.34%K; 46.66%H.

With the changed rules coming in for next year it is possible to foresee a competition
where most teams will aim for a 60% Kick and 40% Handball Ratio at a bare minimum.
Will these changes favour teams like West Coast and make players like Shannon Hurn
a lock for MVP we will have to wait and see.
 
The Chronicle Of The Bounce (2001 to 2018)

2018: 168 Bounces, 22 Games, 7.64 Bounces Per Game.
2017: 157 Bounces, 22 Games, 7.14 Bounces Per Game.
2016: 187 Bounces, 26 Games, 7.19 Bounces Per Game.
2015: 212 Bounces, 23 Games, 9.22 Bounces Per Game.
2014: 214 Bounces, 22 Games, 9.73 Bounces Per Game.
2013: 204 Bounces, 22 Games, 9.27 Bounces Per Game.
2012: 187 Bounces, 22 Games, 8.50 Bounces Per Game.
2011: 277 Bounces, 22 Games, 12.59 Bounces Per Game.
2010: 356 Bounces, 25 Games, 14.24 Bounces Per Game.
2009: 400 Bounces, 25 Games, 16.00 Bounces Per Game.
2008: 602 Bounces, 25 Games, 24.08 Bounces Per Game.
2007: 624 Bounces, 22 Games, 28.36 Bounces Per Game.
2006: 928 Bounces, 24 Games, 38.67 Bounces Per Game.
2005: 580 Bounces, 22 Games, 26.36 Bounces Per Game.
2004: 241 Bounces, 22 Games, 10.95 Bounces Per Game.
2003: 348 Bounces, 22 Games, 15.82 Bounces Per Game.
2002: 452 Bounces, 22 Games, 20.55 Bounces Per Game.
2001: 337 Bounces, 22 Games, 15.32 Bounces Per Game.

Ah the bounce, I fondly recall 2006 the year of the bounce for us at least when the
Bulldogs roamed the vast plains of the AFL grounds pounding the Sherrin into the
purely manicured grass surface. Perhaps the AFL and the football public long for a
return to the times of bouncing majesty to open spaces and displays of run and
carry and immense skill.
 
Winning (A simple mans guide through the 2018 wins)

Lachie Hunter: 8 x Wins from 21 x Games.
Mitch Wallis: 8 x Wins from 18 x Games.
Toby McLean: 8 x Wins from 22 x Games. (Maximus)
Jason Johannisen: 8 x Wins from 22 x Games. (Maximus)
Aaron Naughton: 8 x Wins from 18 x Games.
Ed Richards: 8 x Wins from 21 x Games.
Josh Dunkley: 8 x Wins from 19 x Games.

Jackson Macrae: 7 x Wins from 19 x Games.
Billy Gowers: 7 x Wins from 20 x Games.
Marcus Bontempelli: 7 x Wins from 19 x Games.
Caleb Daniel: 7 x Wins from 20 x Games.
Patrick Lipinski: 7 x Wins from 17 x Games.
Lin Jong: 7 x Wins from 10 x Games. 70% Ratio (Talisman)
Hayden Crozier: 7 x Wins from 17 x Games.
Zaine Cordy: 7 x Wins from 18 x Games.

Luke Dahlhaus: 5 x Wins from 17 x Games.
Bailey Williams: 5 x Wins from 14 x Games.

Bradley Lynch: 4 x Wins from 9 x Games.
Jackson Trengove: 4 x Wins from 16 x Games.
Matthew Suckling: 4 x Wins from 11 x Games.
Tom Boyd: 4 x Wins from 12 x Games.
Joshua Schache: 4 x Wins from 13 x Games.
Bailey Dale: 4 x Wins from 10 x Games.
Dale Morris: 4 x Wins from 11 x Games.
Tory Dickson: 4 x Wins from 8 x Games.

Mitch Honeychurch: 3 x Wins from 13 x Games.
Tim English: 3 x Wins from 7 x Games.
Jordan Roughead: 3 x Wins from 12 x Games.
Fergus Greene: 3 x Wins from 5 x Games. 60% Ratio (Mini Talisman)
Easton Wood: 3 x Wins from 12 x Games.

Lewis Young: 2 x Wins from 2 x Games. 100% Ratio (Mr Winning) despite the 21st ranking in both games.
Roarke Smith: 2 x Wins from 10 x Games.

Jack Redpath: 1 x Win from 2 x Games.
Lukas Webb: 1 x Win from 5 x Games.
Marcus Adams: 1 x Win from 6 x Games.

Well there it is the who is who of winning, I think Lin Jong should change his name to Win Jong to celebrate
his obvious talisman status and Fergus Greene well he should just change his name full stop.
 
Winning (A simple mans guide through the 2018 wins)

Lachie Hunter: 8 x Wins from 21 x Games.
Mitch Wallis: 8 x Wins from 18 x Games.
Toby McLean: 8 x Wins from 22 x Games. (Maximus)
Jason Johannisen: 8 x Wins from 22 x Games. (Maximus)
Aaron Naughton: 8 x Wins from 18 x Games.
Ed Richards: 8 x Wins from 21 x Games.
Josh Dunkley: 8 x Wins from 19 x Games.

Jackson Macrae: 7 x Wins from 19 x Games.
Billy Gowers: 7 x Wins from 20 x Games.
Marcus Bontempelli: 7 x Wins from 19 x Games.
Caleb Daniel: 7 x Wins from 20 x Games.
Patrick Lipinski: 7 x Wins from 17 x Games.
Lin Jong: 7 x Wins from 10 x Games. 70% Ratio (Talisman)
Hayden Crozier: 7 x Wins from 17 x Games.
Zaine Cordy: 7 x Wins from 18 x Games.


Well there it is the who is who of winning, I think Lin Jong should change his name to Win Jong to celebrate
his obvious talisman status and Fergus Greene well he should just change his name full stop.

The star of my Fun Fact series of last season.

How do you reckon he'll go on the right wing this year. I predict we'll have 80+% win where he plays 50+% on the right wing.
 
So it’ll be Bont, Hunter and Wood in AFLX. Quite surprised Macrae didn’t get picked.
 
Status
Not open for further replies.

Remove this Banner Ad

Back
Top