Certified Legendary Thread Race for the flag, in squiggly lines

Remove this Banner Ad

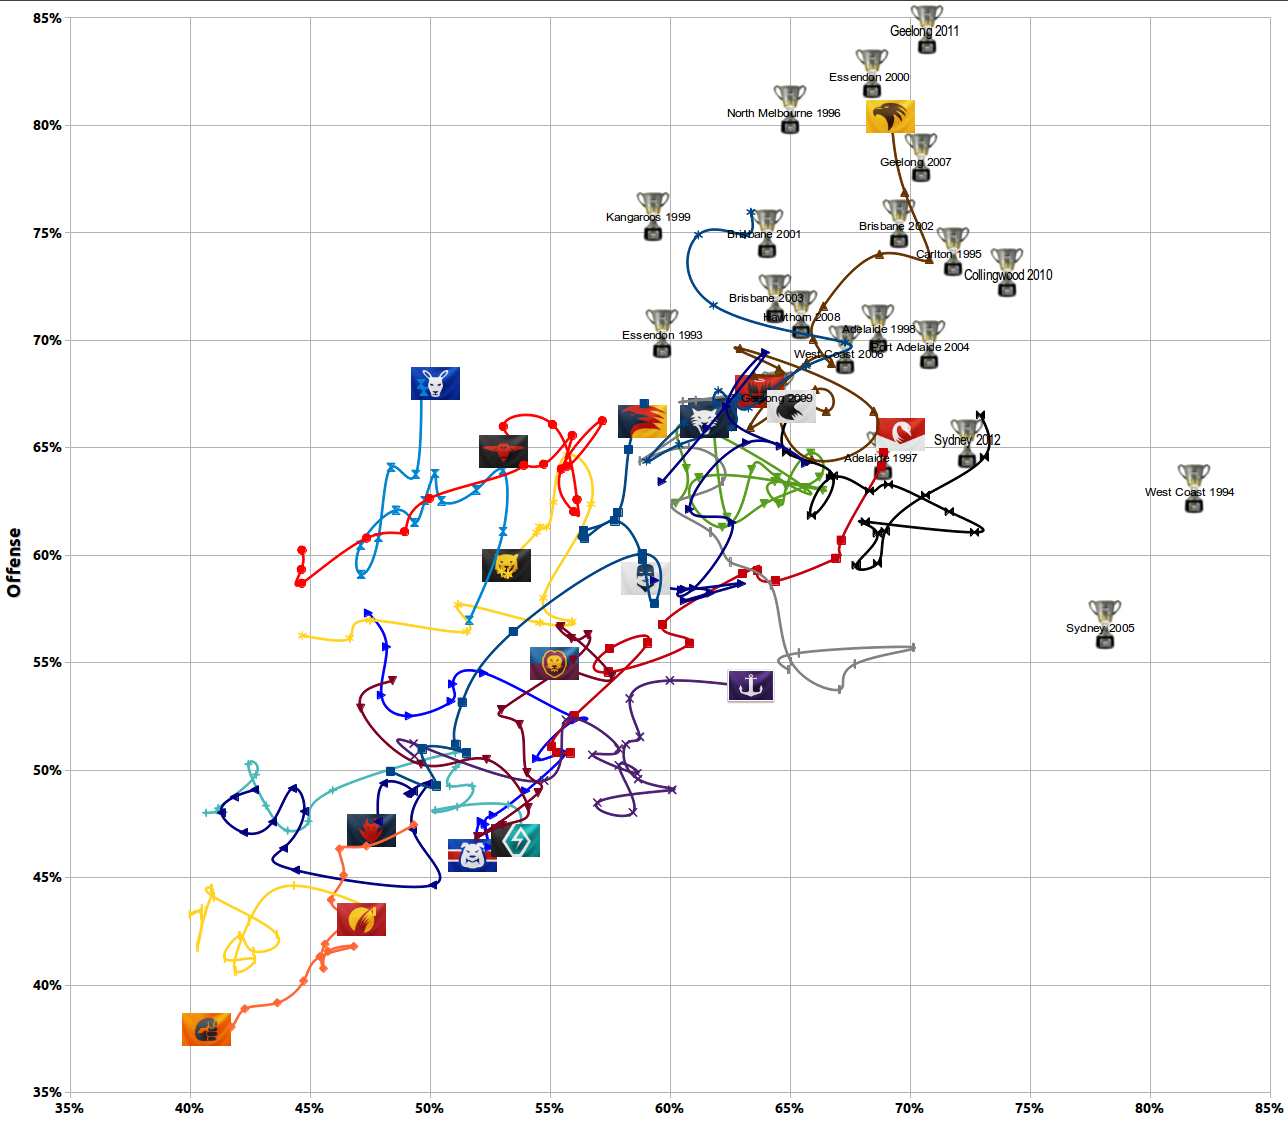
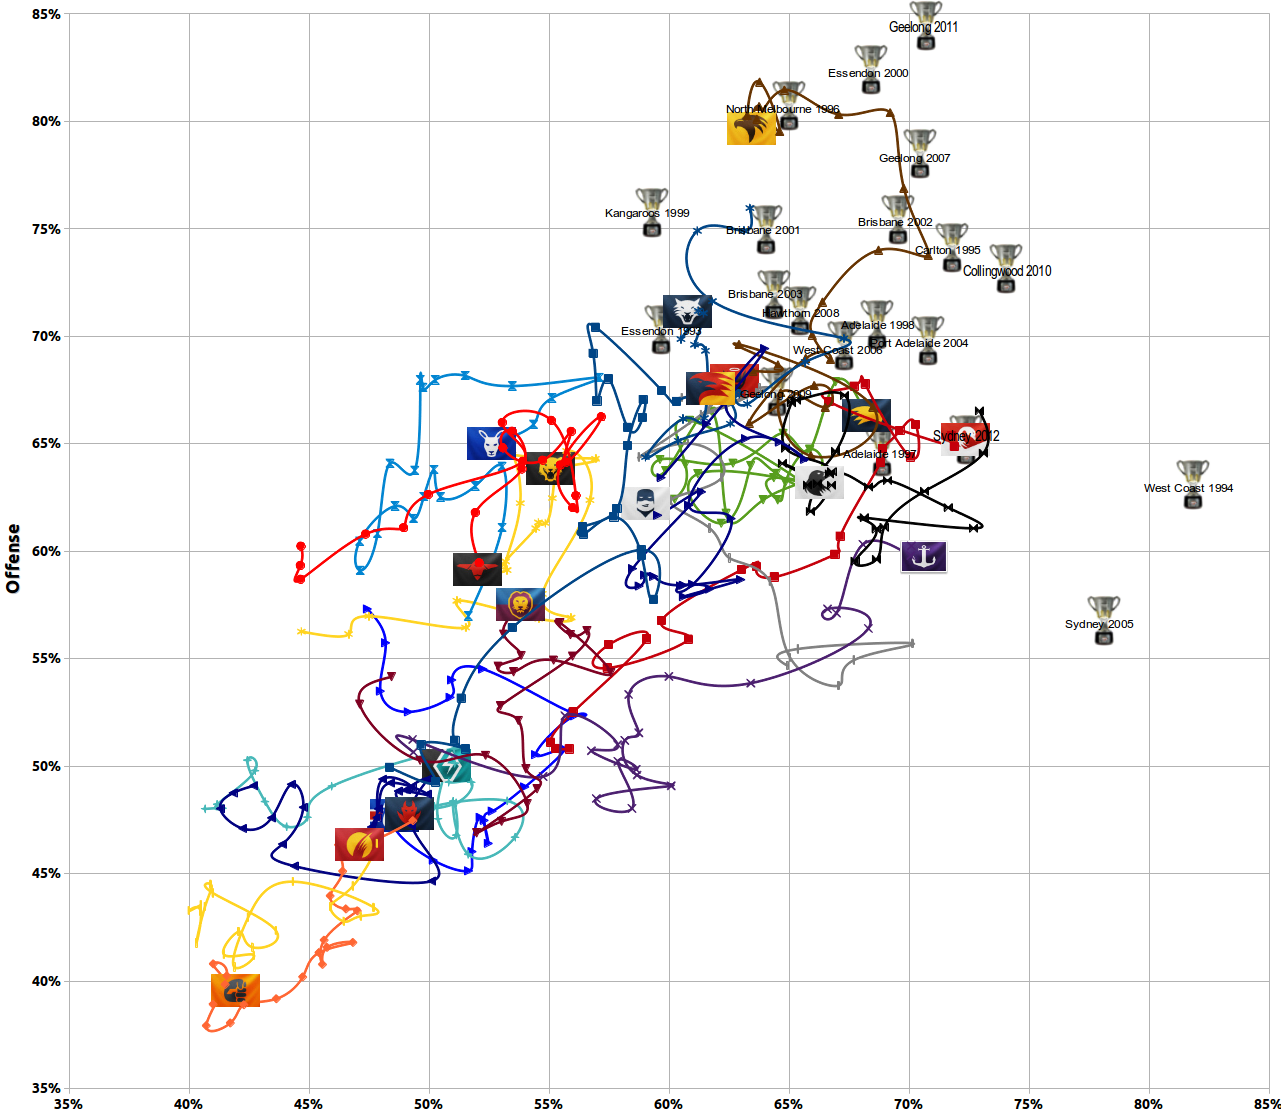
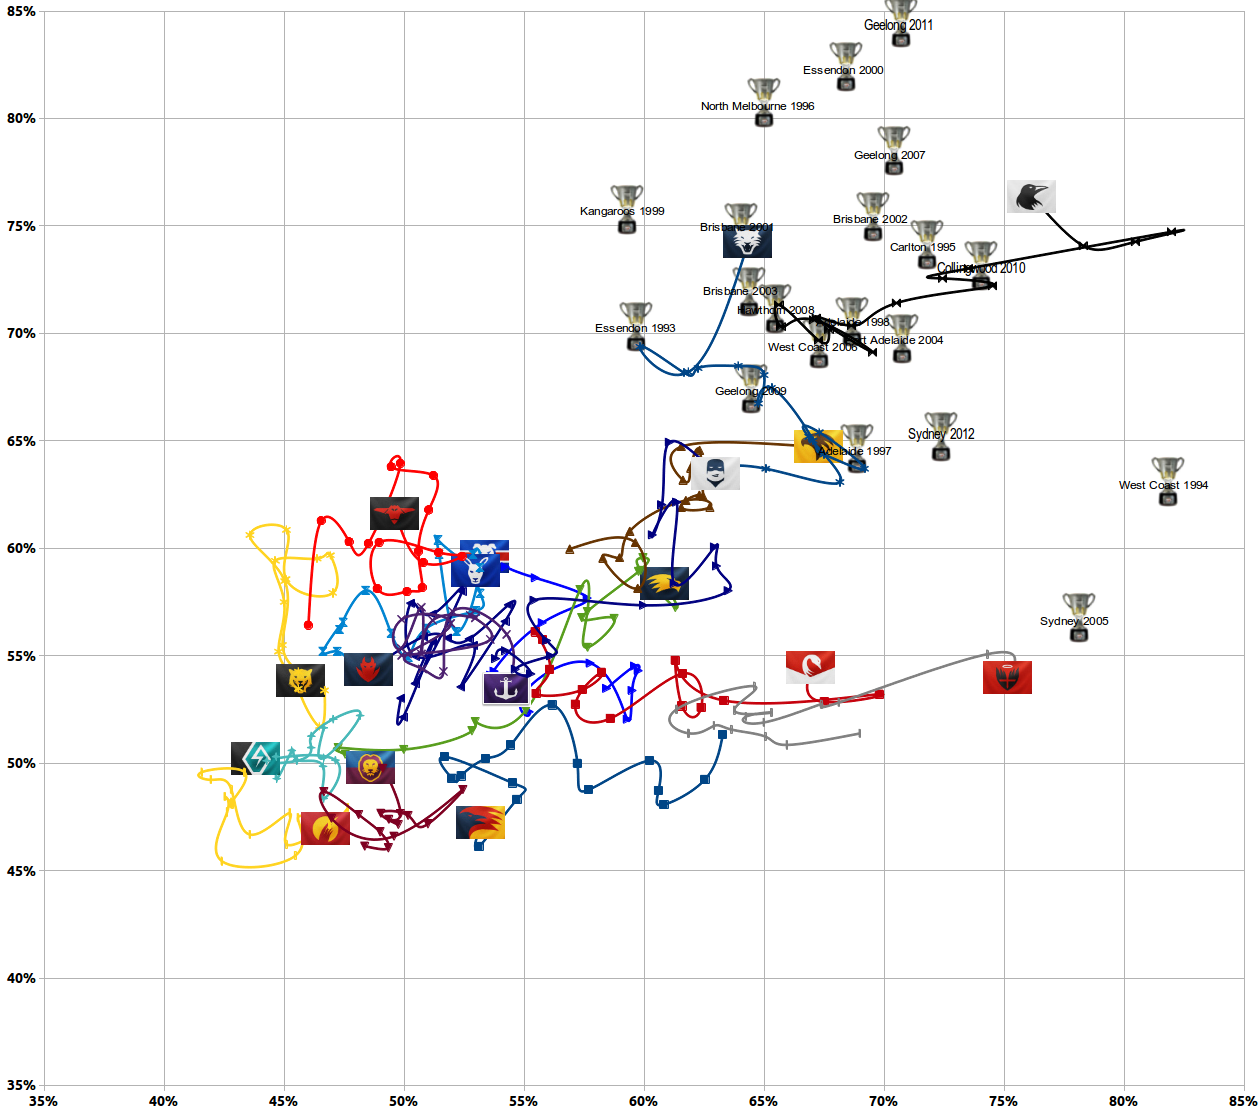
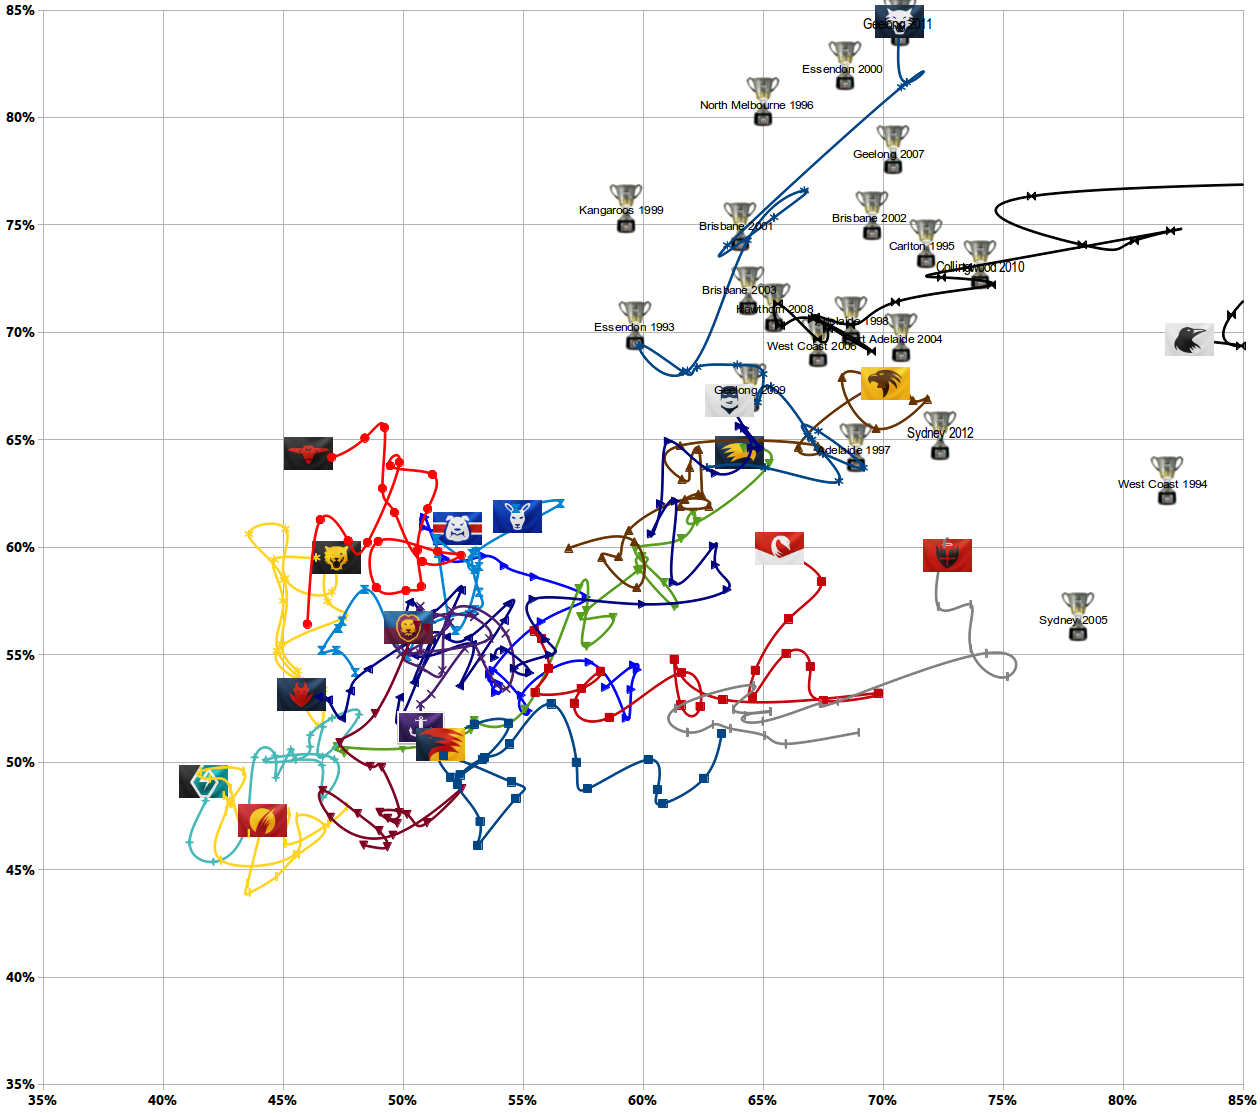
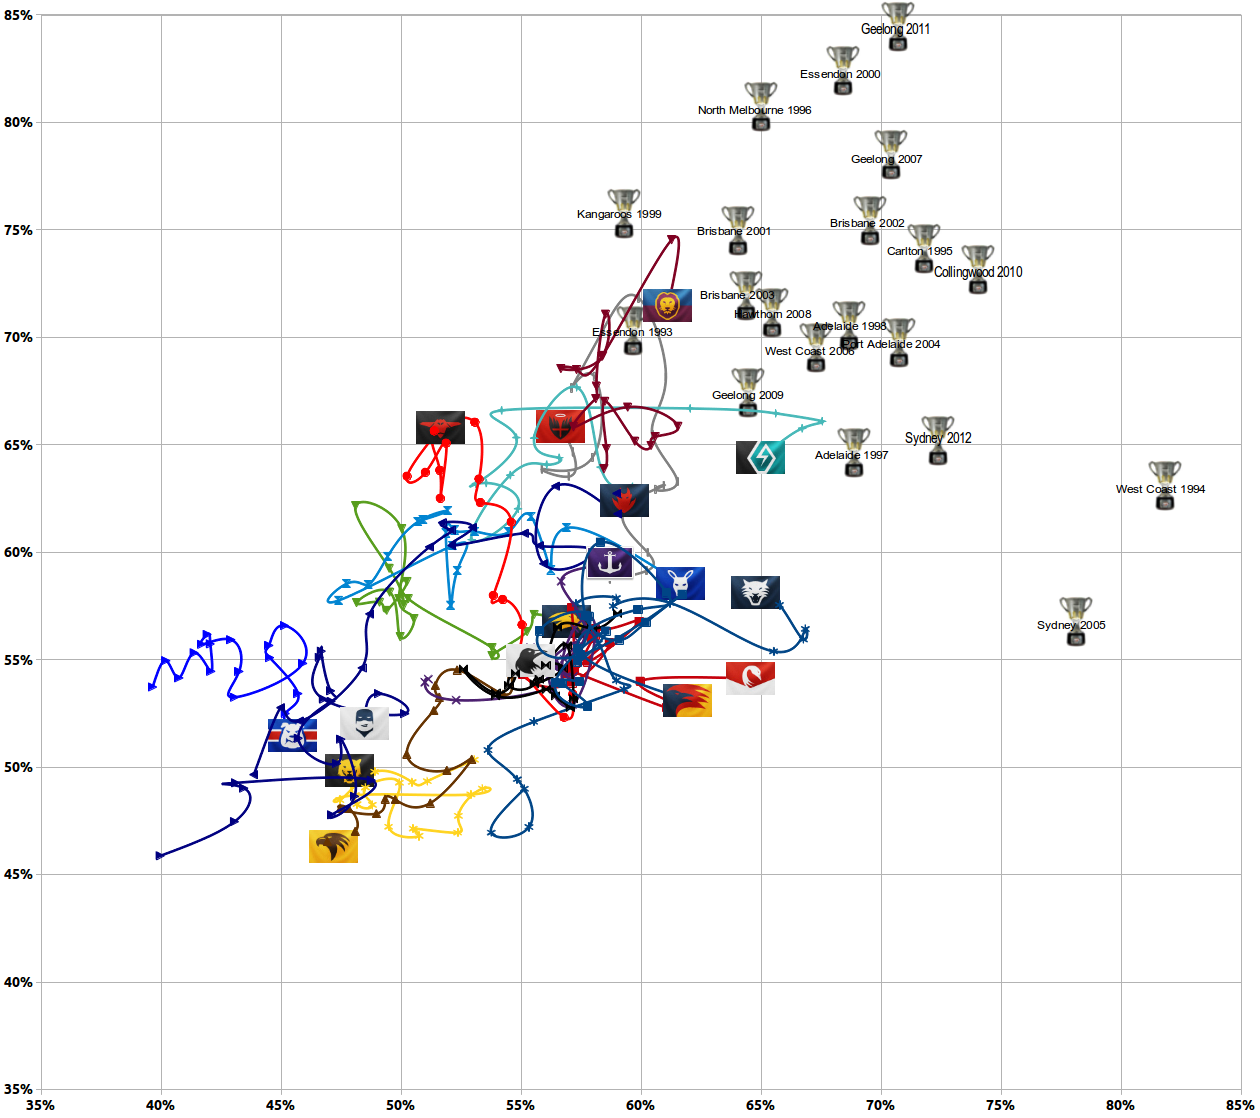
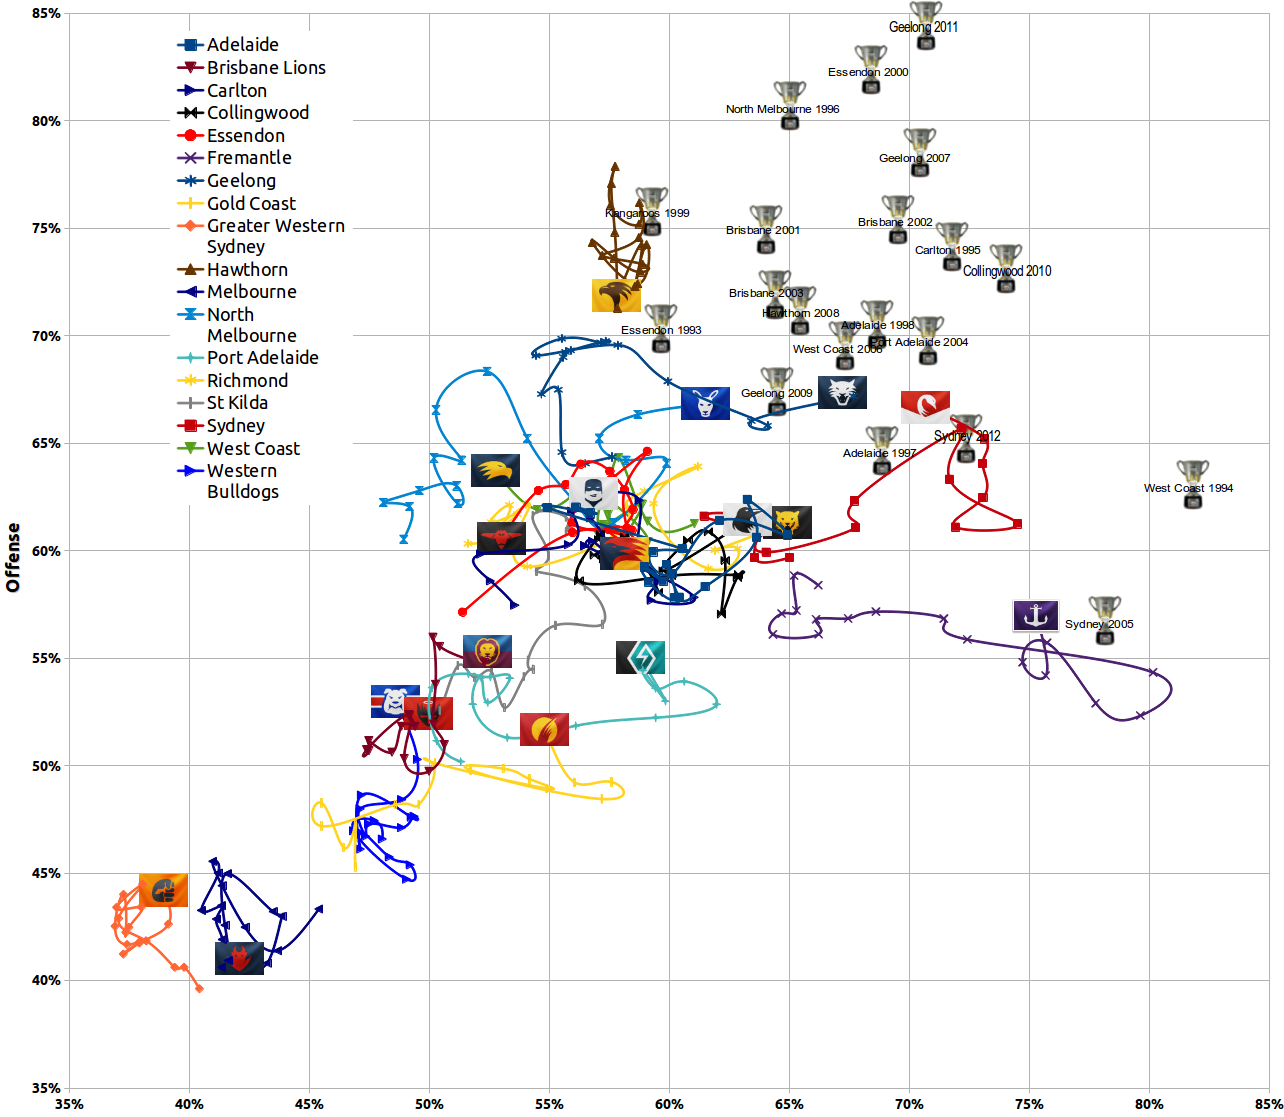
Am I missing something in the charts? Kicking big scores and restricting opposition scores = good, yeah?

Who woulda thunk it. Lucky we have this chart to clear that up.
 
With Geelongs surprise loss, Sydney should be in the box seat to finish second now.

B2B
 

Log in to remove this ad.

Ok here's some stats for you stats fans, this is from the offensive and defensive stats (thanks for the data by the way)

avg i50s for - avg i50s against:

geel 7.29
haw 6.47
coll 5.07
ess 4.40
syd 3.95
port 2.3
carl 1.42
freo 0.53
rich 0.52
kang 0.12
adel -2.33
wce -3.46
gcs -7.56
foots -6.59
bris -6.57
st k -10.47
melb -21.84
Gws -23.26

avg s/s for - avg s/s against

geel 7.77
haw 7.53
syd 6.82
ess 4.41
coll 4.17
kang 3.77
rich 3.30
port 3.11
freo 2.65
wce 2.53
carl 2.47
adel 1.65
bris -3.29
gcs -2.58
st k -5.30
wb -6.71
gws -15.95
melb -16.36

I don't know how to format this into a graph, but essentially I've taken the average inside 50s and scoring shots for each team and subtracted the average inside 50s and scoring shots against from that. I.e. Geelong average 7.77 more scoring shots than their opponent this year. This could be used as midfield ratings I guess? Kinda mimics the ladder which suggests that, IMO, apart from a few anomalies here and there, the ladder essentially reflects who has the better midfields. What stands out is how GWS and Melbourne are in a league of their own in terms of being rubbish. I wonder if the suns were ever that far off the pace.
 
With Geelongs surprise loss, Sydney should be in the box seat to finish second now.

B2B
Their R22 game will directly decide second spot. A few variations with Bailey's ladder predictor kept coming up with that even with a R23 Swans win over Hawthorn...
 
Their R22 game will directly decide second spot. A few variations with Bailey's ladder predictor kept coming up with that even with a R23 Swans win over Hawthorn...

Geelong must beat West Coast in perth first, but yes both Geelong and Sydney have their top 2 or even top 4 chances in their own hands.

what more can you ask at this stage then be able to control your own fate.
 
Could Geelong drop as low as fourth?

Geelong could drop as low as 5th if they drop 1 game and Essendon and Freo win out.

Its very close at the top, win all games finish 2nd lose even 1 could finish 5th o_O
 
This is a really cool thread, although I am a massive sucker for infographics.
 
Wow this is an amazing thread thanks for the post. Please continue to update it!

Interesting to see how only 3 or 4 teams are a genuine shot to win the flag this year.

....also how close North are to the "ideal" zone. This is amazing considering they are 10th on the ladder (based on percentage even at that), it goes to show just how much they've underperformed this year.
 
mrSquiggle_1649.jpg


for the Norm Smith
 

(Log in to remove this ad.)

I like to chart things for no good reason, so I decided to make a scatterplot of teams from their scores for and against over the course of the 2013 season. It looks like this:

After Round 18
xBLVXQc.png
Each team's flag represents its current position, with the line tracking their journey since Round 1.​
I added premiers from the last 20 years, too, since they mostly wind up in the same area.​
The middle is an unreadable mess, but there are interesting results, too.​
Sydney is currently sitting right where they were when they won the Cup last year. Hawthorn has tracked in a very small area all year, with an exceptionally strong attack but a weaker defense than any premiership-winning team of the last two decades. Geelong is making a late run. Freo look exactly like a Ross Lyon team.​
There's a bunch of teams all around the same area, then a fairly large gap to Port Adelaide, Brisbane, St. Kilda, Gold Coast, and the Western Bulldogs. Then GWS and Melbourne sit a long way behind.​
I also decided to plot the Top 4 teams of the last 20 years who failed to win the premiership and see where they wound up. So in this bunch we have many strong teams. I was interested in seeing whether there was a noticeable difference between flag winners and their closest competition:​
Premiers vs Top 4 Also-Rans
p4rrAnr.png
And there does seem to be. In fact, it's possible to draw a "premiership curve" that encompasses 13 of the 20 flags, and 75% of the time over the last 20 years, the team closest to or farthest beyond that curve has won the flag. (The five exceptions: according to this theory, Hawthorn should have won in 2012, Geelong should have won in 2008, St Kilda should have won in 2005, Brisbane should have won in 1999, and St Kilda should have won in 1997.)​
Model Stuff: Each data point is calculated by taking a team's offensive rating and dividing it by the other team's defensive rating. For example, in a match between Hawthorn (OFF: 74.23%) and Essendon (DEF: 54.55%), Hawthorn is expected to produce a score 1.36 times higher than average. Each data point is a weighted average, representing 9% of the most recent round, 8.1% of the round before that (91% of 9%), then 7.45%, and so on. Aside from scores for and against, the only adjustment the model makes is for interstate games, where it assumes a 12-point advantage to the home team. This model has correctly tipped 117 winners this year (72.2%).​
Great work Final Siren
 
End of the season.

Most of the time, the eventual premier seems to be best-placed, or at least very well-placed, by this point in the H&A season. But there are exceptions. The last two years have been unusual.

At this point in 2012, Hawthorn looked like the surest of sure things:

Round 18, 2012

ZzDiW6D.png


Then they drifted a bit while Sydney marginally strengthened:

2012 Final Placings

ehGeogu.png


But you would still pick Hawthorn as occupying the best finishing position from this, so it's one of the 5 years the "ideal zone" theory gets it wrong.

2011 was remarkable, too. Geelong and Collingwood were clearly well ahead of the pack by Round 18, but the Pies looked more likely, and had been in the zone all year.

Round 18, 2011

odYxRAI.png


Then things got crazy!

2011 Final Placings

pbpn66p.png


More often, though, it's this kind of thing, where by Round 18 only 2 or 3 teams still look to be in contention, even if it's not yet clear who will win the flag:

Round 18, 2004 (eventual premier: Port Adelaide over Brisbane)

V8AHuxC.png
Brilliant
 
Final Siren, would it right to suggest that you could draw a curved line to indicate the gap between the would-be top four and the rest?
Well, your guess is as good as mine! I'm really just plotting data points to make a nice visualization. Whether it reveals any golden rules about how to win the flag... I dunno.

I'm not sure exactly what you mean by the "would-be top four"... this year or in general? But overall I'd say it does seem like there could be a couple of curves there. One could contain all the Premiership Cups barring Sydney 2005, and that would separate the premiers from about 90-95% of the rest. Another could contain almost all the Top 4.

It is interesting if a curve fits better than a straight line, as that would suggest decreasing returns from a very strong offense or defence... that is, that balanced teams are better than specialized teams, given the same amount of overall skill/power/whatever you want to call it.
 
Even then, if Port had smashed Geelong in the final I expect they would have ended up around the same place, given where they were a week beforehand.

This is very interesting, but I think using it as a predictive resource is fraught with danger.
That was as close as Port & Geelong got, though, and it still wasn't very close.

If Port had beaten Geelong by 119 points... you are right, they would have finished near each other on the chart, making it look like a far less dominant year by the Cats. But there's probably a reason they didn't; a Port Adelaide that beat Geelong by 119 points in 2007 would have had to have been a very different team than the one that actually played. They also would have dashed into the chart's ideal zone right at the end of the season, which isn't something I see in other years.

As a predictive resource, I think this is like most other stats: It can be useful it you use it to inform and clarify your own views. But it's not a replacement for shrewd observation. It's really just information, and it's up to you to use or ignore that when you make predictions.
 
End of the season.

Most of the time, the eventual premier seems to be best-placed, or at least very well-placed, by this point in the H&A season. But there are exceptions. The last two years have been unusual.

At this point in 2012, Hawthorn looked like the surest of sure things:

Round 18, 2012

ZzDiW6D.png


Then they drifted a bit while Sydney marginally strengthened:

2012 Final Placings

ehGeogu.png


But you would still pick Hawthorn as occupying the best finishing position from this, so it's one of the 5 years the "ideal zone" theory gets it wrong.

2011 was remarkable, too. Geelong and Collingwood were clearly well ahead of the pack by Round 18, but the Pies looked more likely, and had been in the zone all year.

Round 18, 2011

odYxRAI.png


Then things got crazy!

2011 Final Placings

pbpn66p.png


More often, though, it's this kind of thing, where by Round 18 only 2 or 3 teams still look to be in contention, even if it's not yet clear who will win the flag:

Round 18, 2004 (eventual premier: Port Adelaide over Brisbane)

V8AHuxC.png
Awesome.
 
After Round 19

rWEFRCx.png

Do games against the top sides have a bigger weighting than the bottom sides? Freo have the easiest run home and could add a fair bit of percentage against GWS and Melbourne with Pav back this week. That could push us higher up the chart while some of the top 4 sides will have to drop games as they are playing each other.

North could cause some real damage if they keep up their form. I think their run is too tough to actually sneak in though unless 9th becomes 8th.
 
After Round 19

rWEFRCx.png

What i find very interesting in this graph is Port, by rights they should be nowhere near north Melbourne on the ladder but find themselves 3 games up on them with only 4 games to go. Truly this has been a very wasted season by Norths.

Its also interesting to note that Geelong basically remained as you were despite the lose and if it remains the same and Hawthorn win the flag they will be the Worst defensive premier and only a middling offensive premier.

Also Sydney is really starting to move into the sweet spot, and i would expect Freo to be charting up offensively into a better spot with games coming up against GWS, Melbourne, and St Kilda.
 
After Round 19

Fair to suggest that Sydney & Geelong are headed towards the ideal zone if they aren't in it already? Hawks have been right up there in their attacking sense all season, but as far as ideal zones for premierships go, they haven't been close enough.

It looks like Sydney will move to about 70% off/70% def around the finals the way their data points are moving, that would be some balance for sure.

Looks like the sweet spot is 73% off, 68% def, slightly more attacking.
 

Remove this Banner Ad

Back
Top