


Most comps give you a point for a draw, just because it's easier than having the boring endless arguments with the idiots who can't understand that it doesn't make any difference either way.Hey, do most tipping comps consider a draw to be a right tip or wrong? I have the squiggle marking it as a wrong tip but not sure if that's standard.
Navigation
Install the app
How to install the app on iOS
Follow along with the video below to see how to install our site as a web app on your home screen.
Note: This feature may not be available in some browsers.
More options
-
Mobile App Discontinued
Due to a number of factors, support for the current BigFooty mobile app has been discontinued. Your BigFooty login will no longer work on the Tapatalk or the BigFooty App - which is based on Tapatalk.
Apologies for any inconvenience. We will try to find a replacement.
You are using an out of date browser. It may not display this or other websites correctly.
You should upgrade or use an alternative browser.
You should upgrade or use an alternative browser.
Certified Legendary Thread Race for the flag, in squiggly lines
- Thread starter Final Siren
- Start date
- Tagged users None
🥰 Love BigFooty? Join now for free.
Too much talk of homer, more of this man please!
Why not make an algorithm and call it DUFFMAN? Then you've got HOMER & DUFFMAN
Why not make an algorithm and call it DUFFMAN? Then you've got HOMER & DUFFMAN
Hearts to hearts
Brownlow Medallist
- Mar 16, 2001
- 26,213
- 68,756
- AFL Club
- North Melbourne
- Other Teams
- Wales, Eastwood, West Ham
If you'd done this over the last couple of decades, you would have been a solid tipster during the H&A season, a brilliant tipper during finals, and a genius at Grand Finals.
What we want to know, though, is whether it's sustainable! I think the answer is yes. The part that looks suspicious is HOMER, because there doesn't seem to be much logic in why the home team should win regardless of all other factors - even form! And when building models, it's easy to fall into the trap of mistaking a random pattern in the data for meaning, and creating a model based on a coincidence.
For example, given perfect data, I'm sure I could perfectly model the 2014 season based on the underwear of fans who attended the game - because out of tens of thousands of seats, there would be one particular seat where every time a fan sat there wearing boxer shorts, the home team won, but every time the person in that seat was wearing tidy whities, the home team lost. But this wouldn't be any good at predictions. It would just be a neat coincidence.
So is HOMER a coincidence or meaningful? The more I investigate, the more I think it's meaningful.
The first piece of evidence is that HOMER works much better in finals. During the home & away season, HOMER tips at around 58% accuracy; during finals, it's 75%. There are two major differences between the H&A season and finals: the team that finished higher on the ladder is always the home team, and the competing teams are evenly matched. You never get 1st vs 18th in a final. And since 2000, you never get 1st vs 8th, either. It's all matches between teams that are very close on the ladder: 1st vs 4th, 2nd vs 3rd, 5th vs 8th, 6th vs 7th.
And sure enough, if you look at 1994-1999, which was the old McIntyre Final Eight, where week one was 1st vs 8th, 2nd vs 7th, etc, HOMER isn't quite as impressive. It's still good - in fact you can still get 75% accuracy out of it, if you make a few tweaks like awarding home advantage to the geographic home team rather than the nominal home team, for those games where West Coast played "home" finals in Melbourne. But many other algorithms can also get that kind of accuracy, or better. It's only once the finals system switched in 2000 that HOMER started outperforming everything else.
The second thing to note is that HOMER is unswayed by Week 1 Finals form. We know this has happened a lot since 2000: two top-4 teams lose their Qualifying Finals and slink into a playoff against Elimination Finals winners, and the EF winners look like superstars and everyone talks them up... then the QF losers come out and beat them. The history is pretty compelling: even if Port and North upset the odds this weekend, there's a massive weighting in favour of QF losers - especially since these are games between teams that finished as close as 4th and 5th! All things being equal, you'd expect 5th to beat 4th an awful lot more than has actually occurred. That suggests there's a hidden factor (or two) at work here; whether it's confidence or motivation or pacing or something else. HOMER doesn't know what it is, but it thinks the team that loses the QF has it.
And one more thing. There seems to be some kind of spooky "19th man" voodoo around being the home team. I've only figured this out recently, because I used to think home ground advantage was all about geography. And earlier this year, I made what turned out to be a fairly grievous mistake by "fixing" the squiggle to award home ground advantage based on geography, rather than nominal home team status, which seemed sensible and easier to explain. But it does worse at tipping most years, and this turned out to be one of them, with the "improved" version falling behind by 3 tips. So the original, un-improved ISTATE-91:12 currently has 146 tips and the "improved" version, using geographic home advantage, only 143 (counting the draw as a right tip). Since 1994, the difference between the two is a whopping 23 tips in the original's favour. I should not have made that fix. Being the home team is a big deal.
So, on balance, blindly tipping the home team in a final isn't nearly as dumb as it sounds. In a game between two closely matched opponents, you're preferring the one that finished higher on the ladder, you're backing QF losers to bounce back next week, and you're believing in home ground advantage.
Just on the home team thing (and easier to use an example that's happened) - when North met Essendon at the MCG last week, North was the nominal home team as the higher H&A finisher, but in common sense it was much more Essendon's home ground, because North hardly ever plays there. Add that to EFC's bigger supporter base at the game and it seems counter-intuitive to talk about it as a home game for North at all. But are you saying statistically the nominal home team is actually more likely to win?
And I'm assuming the squiggle doesn't allow for experience in finals, experience playing night games, any of those intangible things that tipsters love?
Second best. This thread just keeps on giving:Need the wider big footy community to see this thread. Easily the best thing on here
http://www.bigfooty.com/forum/threads/sympathy-for-essendon-james-and-the-giant-breach.988490/
Log in to remove this Banner Ad
Second best. This thread just keeps on giving:
http://www.bigfooty.com/forum/threads/sympathy-for-essendon-james-and-the-giant-breach.988490/
it certainly gives good insight into the human condition
not particularly good in football terms
- Aug 18, 2009
- 4,230
- 17,507
- AFL Club
- Richmond
- Thread starter
- #1,831
I did pitch it to Robbo but he said the squiggles were too hard to see. Of course, he was drunk at the time. Of course, he's always drunk.Final Siren if I was you I'd try to pitch this for a weekly column in the Herald Sun. If they had any sense they'd pay you a million dollars up front.
- Aug 18, 2009
- 4,230
- 17,507
- AFL Club
- Richmond
- Thread starter
- #1,832
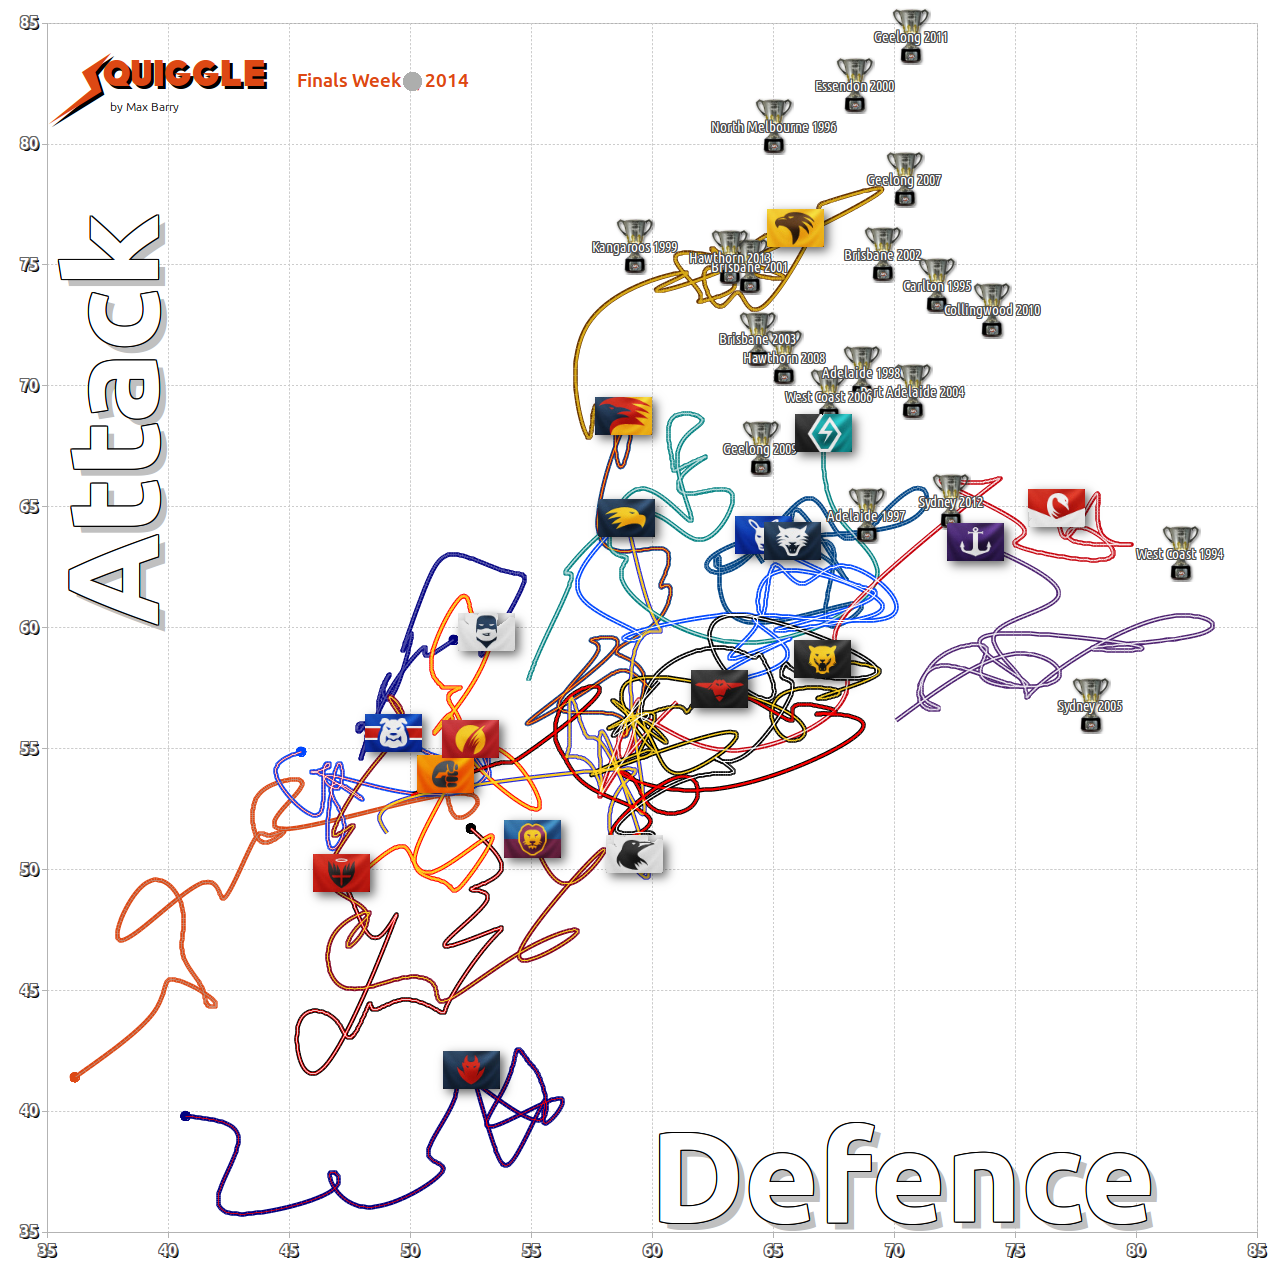
The best way to go pattern-hunting is with the interactive squiggle. You can change the year in the top-right and compare where everybody finished that year. Then play through the season from Round 1, if you want.Hi final siren. You have the past premiers on a chart?
Could there be one with beaten grand finalists as well with. A connecting line to that years premier high-low chart style.
I wonders if there were any patterns there ?
The best way to go pattern-hunting is with the interactive squiggle. You can change the year in the top-right and compare where everybody finished that year. Then play through the season from Round 1, if you want.
Didn't you do a squiggle still last year where you compared the top 4 finishing sides over a 5 year period?
From memory most of the 3rd / 4th finishers were slanted towards defence (where the Swans and Dockers currently find themselves)
worthy
Cancelled
I'm a big fan of any squiggle that suggests the Hawks might win, not so much on the ones that don't.
- Aug 18, 2009
- 4,230
- 17,507
- AFL Club
- Richmond
- Thread starter
- #1,835
Right: since 2000, you're definitely better off tipping the nominal home team, even if the game is being played at the other team's home ground - mostly because Geelong have won a lot of finals at the 'G, but also because Brisbane & Adelaide have each won a "home" final in Melbourne.Just on the home team thing (and easier to use an example that's happened) - when North met Essendon at the MCG last week, North was the nominal home team as the higher H&A finisher, but in common sense it was much more Essendon's home ground, because North hardly ever plays there. Add that to EFC's bigger supporter base at the game and it seems counter-intuitive to talk about it as a home game for North at all. But are you saying statistically the nominal home team is actually more likely to win?
And I'm assuming the squiggle doesn't allow for experience in finals, experience playing night games, any of those intangible things that tipsters love?
Other question: There's no factoring in of those things, no. I honestly don't think they'd be useful.
- Aug 18, 2009
- 4,230
- 17,507
- AFL Club
- Richmond
- Thread starter
- #1,836
There's a graphic with top 4 teams in the OP. The one I think you're referring to, though, was where I looked at where defence-focused teams tended to finish, i.e. mostly short of premierships.Didn't you do a squiggle still last year where you compared the top 4 finishing sides over a 5 year period?
From memory most of the 3rd / 4th finishers were slanted towards defence (where the Swans and Dockers currently find themselves)
Chadwiko
The Captain!
- Sep 25, 2004
- 30,327
- 54,033
- AFL Club
- North Melbourne
- Other Teams
- Washington Commanders, Boston Celtics
How confident are you feeling about tonights squiggle prediction Final Siren of a Cats 2 point win?
- Aug 18, 2009
- 4,230
- 17,507
- AFL Club
- Richmond
- Thread starter
- #1,838
Pretty confident of a Cats win. Lots of algorithmic love for Geelong, and it's their home game, and they have finals experience. Whereas it's harder to think of reasons why North will prove the models wrong. I actually think a Cats' blowout is more likely than a North win.How confident are you feeling about tonights squiggle prediction Final Siren of a Cats 2 point win?
But footy is full of surprises!
Pretty confident of a Cats win. Lots of algorithmic love for Geelong, and it's their home game, and they have finals experience. Whereas it's harder to think of reasons why North will prove the models wrong. I actually think a Cats' blowout is more likely than a North win.
But footy is full of surprises!
...and the other game. The Fremantle V Port game has the potential to break the squiggle given the Dockers run of outs
Chadwiko
The Captain!
- Sep 25, 2004
- 30,327
- 54,033
- AFL Club
- North Melbourne
- Other Teams
- Washington Commanders, Boston Celtics
Pretty confident of a Cats win. Lots of algorithmic love for Geelong, and it's their home game, and they have finals experience. Whereas it's harder to think of reasons why North will prove the models wrong. I actually think a Cats' blowout is more likely than a North win.
But footy is full of surprises!
So conflicted between my love of the Squiggle and love of North.
- Aug 18, 2009
- 4,230
- 17,507
- AFL Club
- Richmond
- Thread starter
- #1,841
I spent way too long beautifying the squiggle today. Whaddya think?
- Aug 18, 2009
- 4,230
- 17,507
- AFL Club
- Richmond
- Thread starter
- #1,842
North could beat the Cats and jump on the squiggle. Double win.So conflicted between my love of the Squiggle and love of North.
I'm a bit "meh" on the big Attack and Defence bits, but I like the smaller team logos that let you see what is going on underneath them.I spent way too long beautifying the squiggle today. Whaddya think?
SJ
Premium Platinum
At their best I reckon the Cats have North covered by about three to four goals. However the Cats are missing far too many important players which brings North right into it tonight.Pretty confident of a Cats win. Lots of algorithmic love for Geelong, and it's their home game, and they have finals experience. Whereas it's harder to think of reasons why North will prove the models wrong. I actually think a Cats' blowout is more likely than a North win.
But footy is full of surprises!
🥰 Love BigFooty? Join now for free.
threenewpadlocks
Brownlow Medallist
I reckon circular logos rather than the rectangular one you currently use would be better.
I think you should change the font to mistral and put a 3 pixel width stroke on each line.
cryptor
Brownlow Medallist
- May 11, 2008
- 26,906
- 74,630
- AFL Club
- Hawthorn
Rather than each individual premiership cup a heat map background would be good to show the potent areas you want your team to be.
Stromageddon
Hour of Pessimism
- Jul 27, 2012
- 16,077
- 28,449
- AFL Club
- Port Adelaide
needs more gradients and microsoft clipart
Final Siren if I was you I'd try to pitch this for a weekly column in the Herald Sun. If they had any sense they'd pay you a million dollars up front.
...and then they will probably ask for the content to be exclusive to the HUN and withdrawn publicly.
Similar threads
- Replies
- 31
- Views
- 1K
- Replies
- 126
- Views
- 4K
- Poll
- Replies
- 2
- Views
- 394