- Jul 13, 2015
- 36,483
- 40,655
- AFL Club
- Hawthorn
which 1980s predictions did you have in mind?
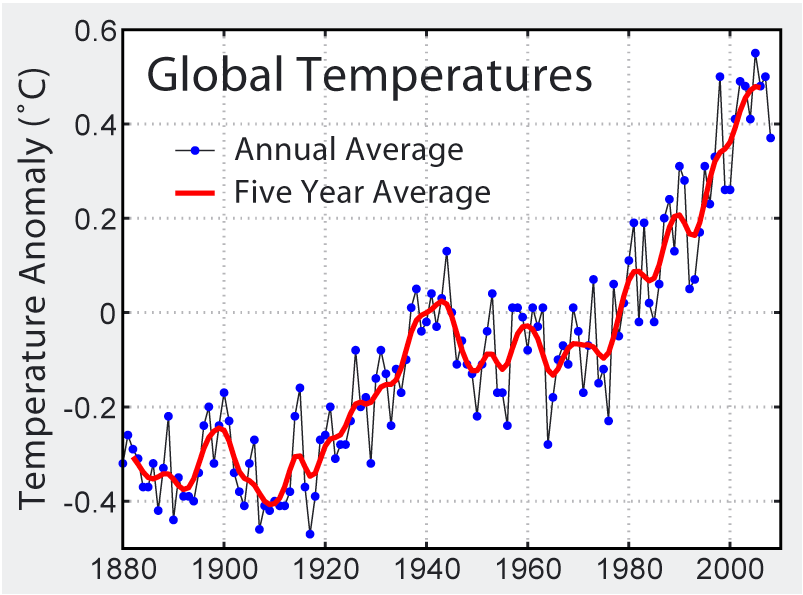
http://www.realclimate.org/index.ph...g-a-1981-temperature-projection/#ITEM-11398-0

who is this "we" that you speak of?
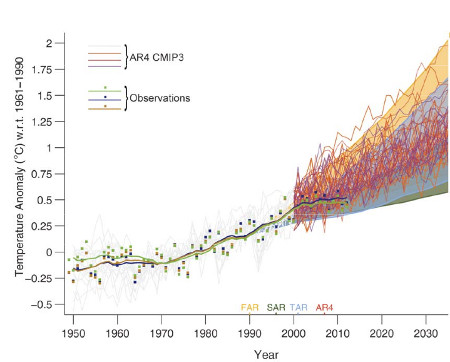
http://www.ipcc.ch/publications_and..._first_assessment_1990_wg1.shtml#.T6CiCdnox8E
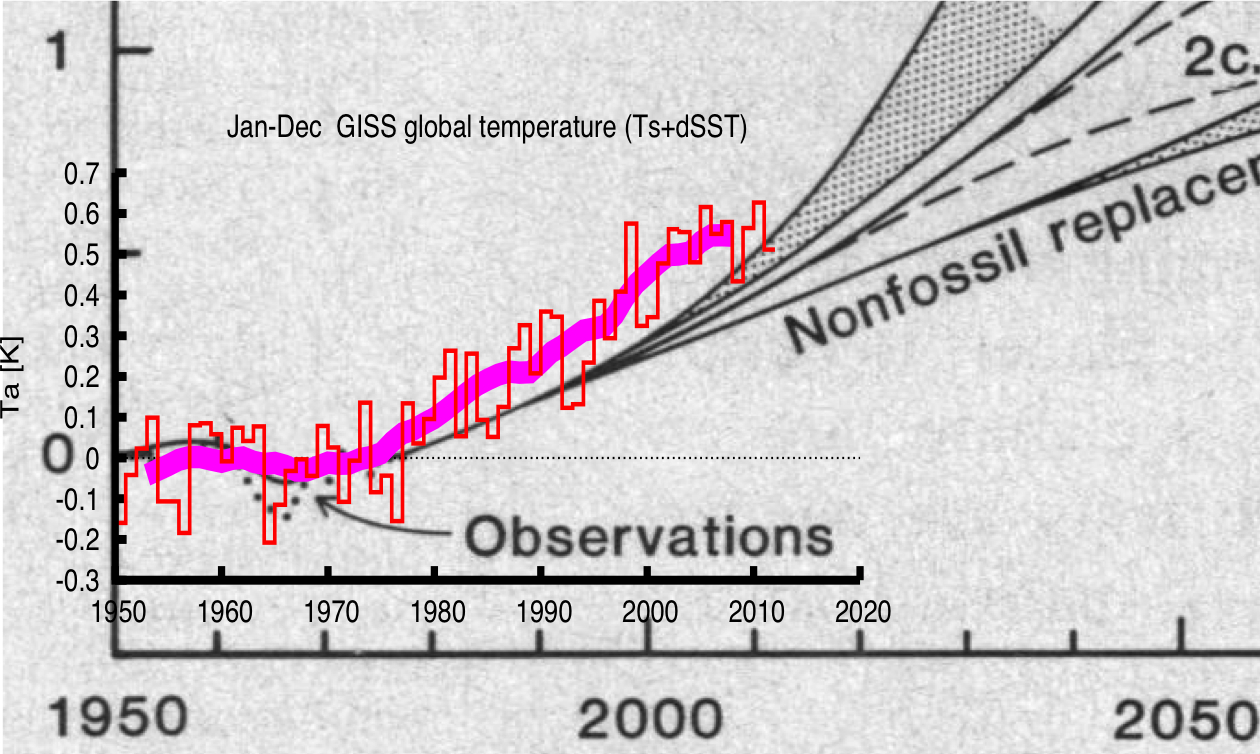
The problem with the projections is that they get the temperature increases mostly correct, but their predictions are based on CO2 increases *WAY* less than we actually saw. So they get it right by accident. The temperatures have basically followed the "BAU" case, while the CO2 increases have been 25% greater year in, year out.
When you look at CO2 levels based on their increased "Worst Case" scenarios, then they are only about 40% out on their predictions. Now, to be fair, that is pretty decent for such a long period. But how much weight do we lend to models which are that wrong?
As for the "we"... pretty much every green group in the world. Rail against CSG and GM foods, while demanding action on climate change.