- Oct 9, 2013
- 10,903
- 14,800
- AFL Club
- Western Bulldogs
I'm not saying that's the case, just asking the question.Agreed. I think crowd is nowhere near that big of an impact. Especially in the AFL. In others sports yes, but in the AFL not really
Follow along with the video below to see how to install our site as a web app on your home screen.
Note: This feature may not be available in some browsers.
I'm not saying that's the case, just asking the question.Agreed. I think crowd is nowhere near that big of an impact. Especially in the AFL. In others sports yes, but in the AFL not really
You should be saying it thoI'm not saying that's the case, just asking the question.
| HGA (points) |
Greater Western Sydney | 16.7 |
Brisbane Lions | 16.1 |
Gold Coast | 14.9 |
Geelong | 6.0 |
Richmond | 2.0 |
Sydney | 0.4 |
Western Bulldogs | -1.0 |
St Kilda | -1.1 |
Essendon | -1.4 |
North Melbourne | -2.8 |
Collingwood | -3.0 |
Carlton | -3.7 |
Adelaide | -4.3 |
West Coast | -4.3 |
Melbourne | -4.7 |
Hawthorn | -5.3 |
Port Adelaide | -10.3 |
Fremantle | -14.3 |
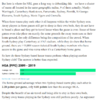
| HGA | Opposition | Net Benefit |
Port Adelaide | -10.3 | 60.2 | 49.9 |
Sydney | 0.4 | 44.8 | 45.2 |
Geelong | 6.0 | 20.1 | 26.1 |
Brisbane Lions | 16.1 | 6.2 | 22.3 |
Fremantle | -14.3 | 34.4 | 20.1 |
Gold Coast | 14.9 | -1.9 | 13.0 |
West Coast | -4.3 | 15.8 | 11.5 |
Adelaide | -4.3 | 12.9 | 8.6 |
North Melbourne | -2.8 | -6.4 | -9.2 |
Essendon | -1.4 | -11.4 | -12.8 |
Carlton | -3.7 | -18.3 | -22.0 |
Collingwood | -3.0 | -20.1 | -23.1 |
Richmond | 2.0 | -29.0 | -27.0 |
Western Bulldogs | -1.0 | -27.6 | -28.6 |
Melbourne | -4.7 | -28.3 | -33.0 |
Greater Western Sydney | 16.7 | -54.6 | -37.9 |
St Kilda | -1.1 | -47.9 | -48.9 |
Hawthorn | -5.3 | -48.6 | -53.9 |
I mean I'm not saying NOT to.So you're saying we should put the house on the Hawks for the flag Final Siren ?
So for the first time in history, the AFL has been able to actively manipulate the schedule during the season ......
and in a surprise to absolutely no-one, Hawthorn have the hardest run, whilst Geelong and the Interstate teams have the easiest?
Just because we're paranoid, doesn't mean they're not after us.....
If you can't work out why the interstate sides have had the easiest run this thread is probably too advanced for you.

So for the first time in history, the AFL has been able to actively manipulate the schedule during the season ......
and in a surprise to absolutely no-one, Hawthorn have the hardest run, whilst Geelong and the Interstate teams have the easiest?
Just because we're paranoid, doesn't mean they're not after us.....
Now fixed! I switched over to the Squiggle API for live scores, but didn't notice it uses a number like 75% for the amount of game time completed, instead of 0.75. So instead of calculating that there was 0.25 of the game left, it thought there was -74, which produced weird extrapolations.What's wrong with the in-game Squiggle at the moment?
I saw an NRL example the other day that suggested fans turn up in very different numbers depending on whose home game it is, which means they have games where almost everything is the same except relative levels of fan support. I have no idea if that's true, but if so it's pretty hard to escape the conclusion that crowds mean a lot:You should be saying it tho

Once again different sportI saw an NRL example the other day that suggested fans turn up in very different numbers depending on whose home game it is, which means they have games where almost everything is the same except relative levels of fan support. I have no idea if that's true, but if so it's pretty hard to escape the conclusion that crowds mean a lot:
View attachment 910278
Hello Final SirenActually this is probably what I should have posted in the first place. From best fixture to worst in Rounds 1-5, the net benefit of Home Ground Advantage + strength of opposition:
Once again different sport
Lol what makes NRL so special that it would generate different kind of home ground advantages than AFL? It's not like Ice Hockey where the home team gets to send out their line second.
No wonder the world is in the place that it is right now with so many happy to be completely ignorant to FACTS
Are these Facts, FACTS, core facts, fake facts, left facts, right facts or ordinary everyday facts?
I get confused....
Because one team possesses the ball at a time. In the AFL the ball is constantly in dispute unless having a set shot. As for other sports, across the US and Europe, AFL crowds are much more of a 50/50 mix than those and so HGA from crowds is extremely diluted in comparison.Lol what makes NRL so special that it would generate different kind of home ground advantages than AFL? It's not like Ice Hockey where the home team gets to send out their line second.
No wonder the world is in the place that it is right now with so many happy to be completely ignorant to FACTS
Sure! You are applying a description ("more than twice as difficult") to a data set that doesn't suit it, because it's made up of differentials vs league average.Hello Final Siren
I am interested in how you have assessed the difficulty of opposition. I know that this was posted before this weekend's round.
At that point in time the Eagles and Dockers at had played 3 of the same teams - Port, Brisbane and Gold Coast.
The Eagles had also played Melbourne and Sydney - 2 teams that look to be bottom 6. The Dockers had also played Adelaide, the worst team in the comp, and Essendon a top 8, maybe top 6 team.
By your statistical assessment this translates into the Eagles' draw being more than twice as difficult as the Dockers'.
I would say this doesn't pass a pub test. Can you explain please?
And every home team won last round, even though none of them were playing at home!Interesting, I'm of the view crowds are the biggest part of HGA generally, since even in sports where there are no other differences between games, HGA is still roughly the same.
But doing some quick, maybe dodgy work with the Squiggle API (like - seriously - this is the first time I've used it or anything like it, so if someone wants double check feel free), I found that home teams are averaging 13.45 PPG higher than away teams on average this season. No other year available (that is 2011 onwards) matches this, the next highest is 9.55 in 2016, the lowest 4.08 in 2013.
Obviously there's other factors that make this year different since pretty much all travelling teams have been in hubs or travelled on the day which is probably not ideal, and its not nearly a full season of games, but the discrepancy is pretty big.
And every home team won last round, even though none of them were playing at home!
I do think you have to be very careful with HGA because it's a pretty small effect in a sport where the average error of an expert margin prediction is about 26 points. (A bit less this year, probably because of shorter quarters and therefore lower scores.) So you need a fair amount of data before you can conclude much.