Certified Legendary Thread The Squiggle is back in 2023 (and other analytics)

Remove this Banner Ad

Supporters of teams who the squiggle doesn't rate make this claim EVERY year (the best year was when it never rated Freo when they finished top). Squiggle is generally proven to be correct - as FS always says - putting your foot down and belting bad teams is a sign you are a good side.

Ha, yep, every year. Like clockwork.
 
Round 18 hasn't been assigned venues yet, but that aside, we can estimate how Home Ground Advantage for 2020 will wind up:

Tier 1: The QLD, SA and WA teams get a net benefit of 6-7 goals across the season.

Tier 2: A fair gap here, then three teams with a mostly neutral season (between 0 and 2-goal disadvantage): North Melbourne, GWS, and Sydney. North had many neutral games, while the two NSW teams basically split their fixture into thirds (one good, one neutral, one bad).

Tier 3: Most Vic teams net around a 3-goal disadvantage: Bulldogs, Richmond, Melbourne, Carlton, Geelong, Essendon. These teams had no games with any significant home advantage, but did have a few with disadvantage. The Cats are an exception, having 3 at Kardinia, but also 3 away in SA and WA after crowds came back.

Tier 4: The Saints always have something quirky in their fixture. This time it's a worse fixture than most Melbourne clubs, with classic away games against all the QLD and SA clubs, but no Perth trip. That nets a 4.5 goal disadvantage.

Tier 5: Collingwood & Hawthorn net a 6-7 goal disadvantage. The Pies had the Perth hub on top of classic away games against Adelaide, Brisbane, GWS, and Gold Coast, and, unlike Geelong, no good home games to balance it. The Hawks had Brisbane at the MCG, but managed to get every single other non-Melbourne club in a traditional away game. They will actually wind up with an 8-goal disadvantage if their R18 game against Gold Coast gets fixtured at Carrara.
I thought the dogs had the same interstate trips as St Kilda. Any reason they're in different tiers?

Is it possible to look at the difficulty of each team's draw in terms of the rating of the opponent at the time they played?

For instance West coast had a slow start but are rolling now where as Collingwood started well but we're detailed by injuries.
 

Log in to remove this ad.

FS explained a few pages back while difference in days between games played is actually a bit of a myth and has little empirical support.
Yep, although a 5-day vs 9-day is so rare, we don't really know. We do know that teams don't reliably perform better when they've had an extra 1 or 2 days rest but both teams had about a week.
 
I shouldn't look at the Squiggle while the game's in progress, but the cumulative scores being treated as the final one has broken the system hard, lol.
It's meant to project out the scores, but that is a part of the site that breaks all the time without me noticing. I'll try to remember to take a look at it during a match.
 
I thought the dogs had the same interstate trips as St Kilda. Any reason they're in different tiers?

Is it possible to look at the difficulty of each team's draw in terms of the rating of the opponent at the time they played?

For instance West coast had a slow start but are rolling now where as Collingwood started well but we're detailed by injuries.
I usually do an analysis like that and it seems to work pretty well, although it can't handle teams that suddenly gain or lose a lot of form. For example, Adelaide's cliff-dive from mediocre (10-12 at 101% last year) to unimaginably bad (0-13 at 55% so far this year) probably all happened during the off-season. Squiggle had a dim view of the Crows already (rated 17th pre-season), but it wasn't dim enough, and not until Round 4 did Squiggle drag them into the extreme lower basement areas they currently occupy. So before then, Adelaide's opponents get credit they don't deserve, because of the lag factor.

Actually, a better example: Round 2 West Coast v Gold Coast. In reality, the Eagles probably got the Suns at a bad time, maybe even peak bad. But the Suns' rating was actually at its lowest ahead of that game, after an awful 2019 and a Round 1 walloping. On the raw numbers, West Coast would get credit for lucky timing.

Anyway I will see if I can fix that up at some point.

St Kilda vs Bulldogs fixture: Same number of true away games, that's right - the Saints played Adelaide at AO while the Dogs had Sydney at the SCG, but otherwise identical in that they both played away to Port, Brisbane, and the Suns. The major difference is that the Bulldogs also hosted the Giants at Docklands, while St Kilda haven't hosted anybody. I actually have St Kilda's most advantageous game this year as Round 16 vs Hawthorn at Carrara (+1.3 points), because by then the Saints will have built up a bit of ground/state familiarity while the Hawks have been roaming the country.
 
Last edited:
What will happen next year, if all restrictions are over? When teams travel to Brissy/GC, will the home ground advantage be less because everyone's gotten used to the Gabba/Metricon? Or would Squiggle not care for that?

It depends how they have performed there this year.
 
I presume a draw places Essendon higher than Freo, but not Carlton as the fractions in wins are rounded up or down?

11 Carlton7.7 wins99%
0
12
Essendon
7.082%1 draw


13
Fremantle
7.090%0
 
I presume a draw places Essendon higher than Freo, but not Carlton as the fractions in wins are rounded up or down?

11 Carlton7.7 wins99%
0
12
Essendon
7.082%1 draw


13
Fremantle
7.090%0
I'm not sure where you got that from - ladder projections are usually created by running simulations, which is a more reliable way of figuring out who will finish where once you take draws and percentage into account. But there is a fast and dirty ladder hidden away on live.squiggle.com.au that simply adds up fractions, and that's the way I used to do it in the past.
 
What will happen next year, if all restrictions are over? When teams travel to Brissy/GC, will the home ground advantage be less because everyone's gotten used to the Gabba/Metricon? Or would Squiggle not care for that?
The Squiggle model is based on ground familiarity - because that seems to be a good proxy for the things that really matter, like crowd support - and so yes, all teams will be expected to do slightly better in Queensland matches next year than would have otherwise, with Brisbane and Gold Coast's advantage eroding.

This is also in effect right now: many teams have accumulated a bit more familiarity in Queensland over the season.

Hawks played 4 in a row at Spotless. Didnt help.
 

(Log in to remove this ad.)

I'm not sure where you got that from - ladder projections are usually created by running simulations, which is a more reliable way of figuring out who will finish where once you take draws and percentage into account. But there is a fast and dirty ladder hidden away on live.squiggle.com.au that simply adds up fractions, and that's the way I used to do it in the past.
I'm no mathematician, but I'm still not sure why you didn't understand the post. As there's no such thing on the AFL ladder as 0.7 of a win, Carlton would finish behind Essendon in this scenario of seven wins apiece and no draw to Carlton, would it not?

I didn't mean to upset you and all kudos to you for the work. However, all computer modelling is just that, obviously. I merely noticed that the simulated ladder showed all team positions corresponding to ladder points followed by percentage, with this one exception, that only did so if the fractional wins accrued from the simulations were eventually rounded up or down. Otherwise, it's an anomalous result, unless the eventually projected and unrounded ladder points are less important to this simulated ladder than the AFL one.

From your reply, I must presume that this is not a unique result in relation to drawn games.
I mean I can't tell what kind of ladder you've posted, so I can't answer the question about its logic.

On Squiggle.com.au, there is:
- The main projected ladder, which is an aggregation of projections from a variety of different public models, including Squiggle's in-house one
- Projected ladders from each individual public model
- An old one hidden behind a button on live.squiggle.com.au that tallies fractional wins

I thought it looked a bit like the last one, but maybe not? Anyway if you let me know where it came from, I can say what it's doing.
 
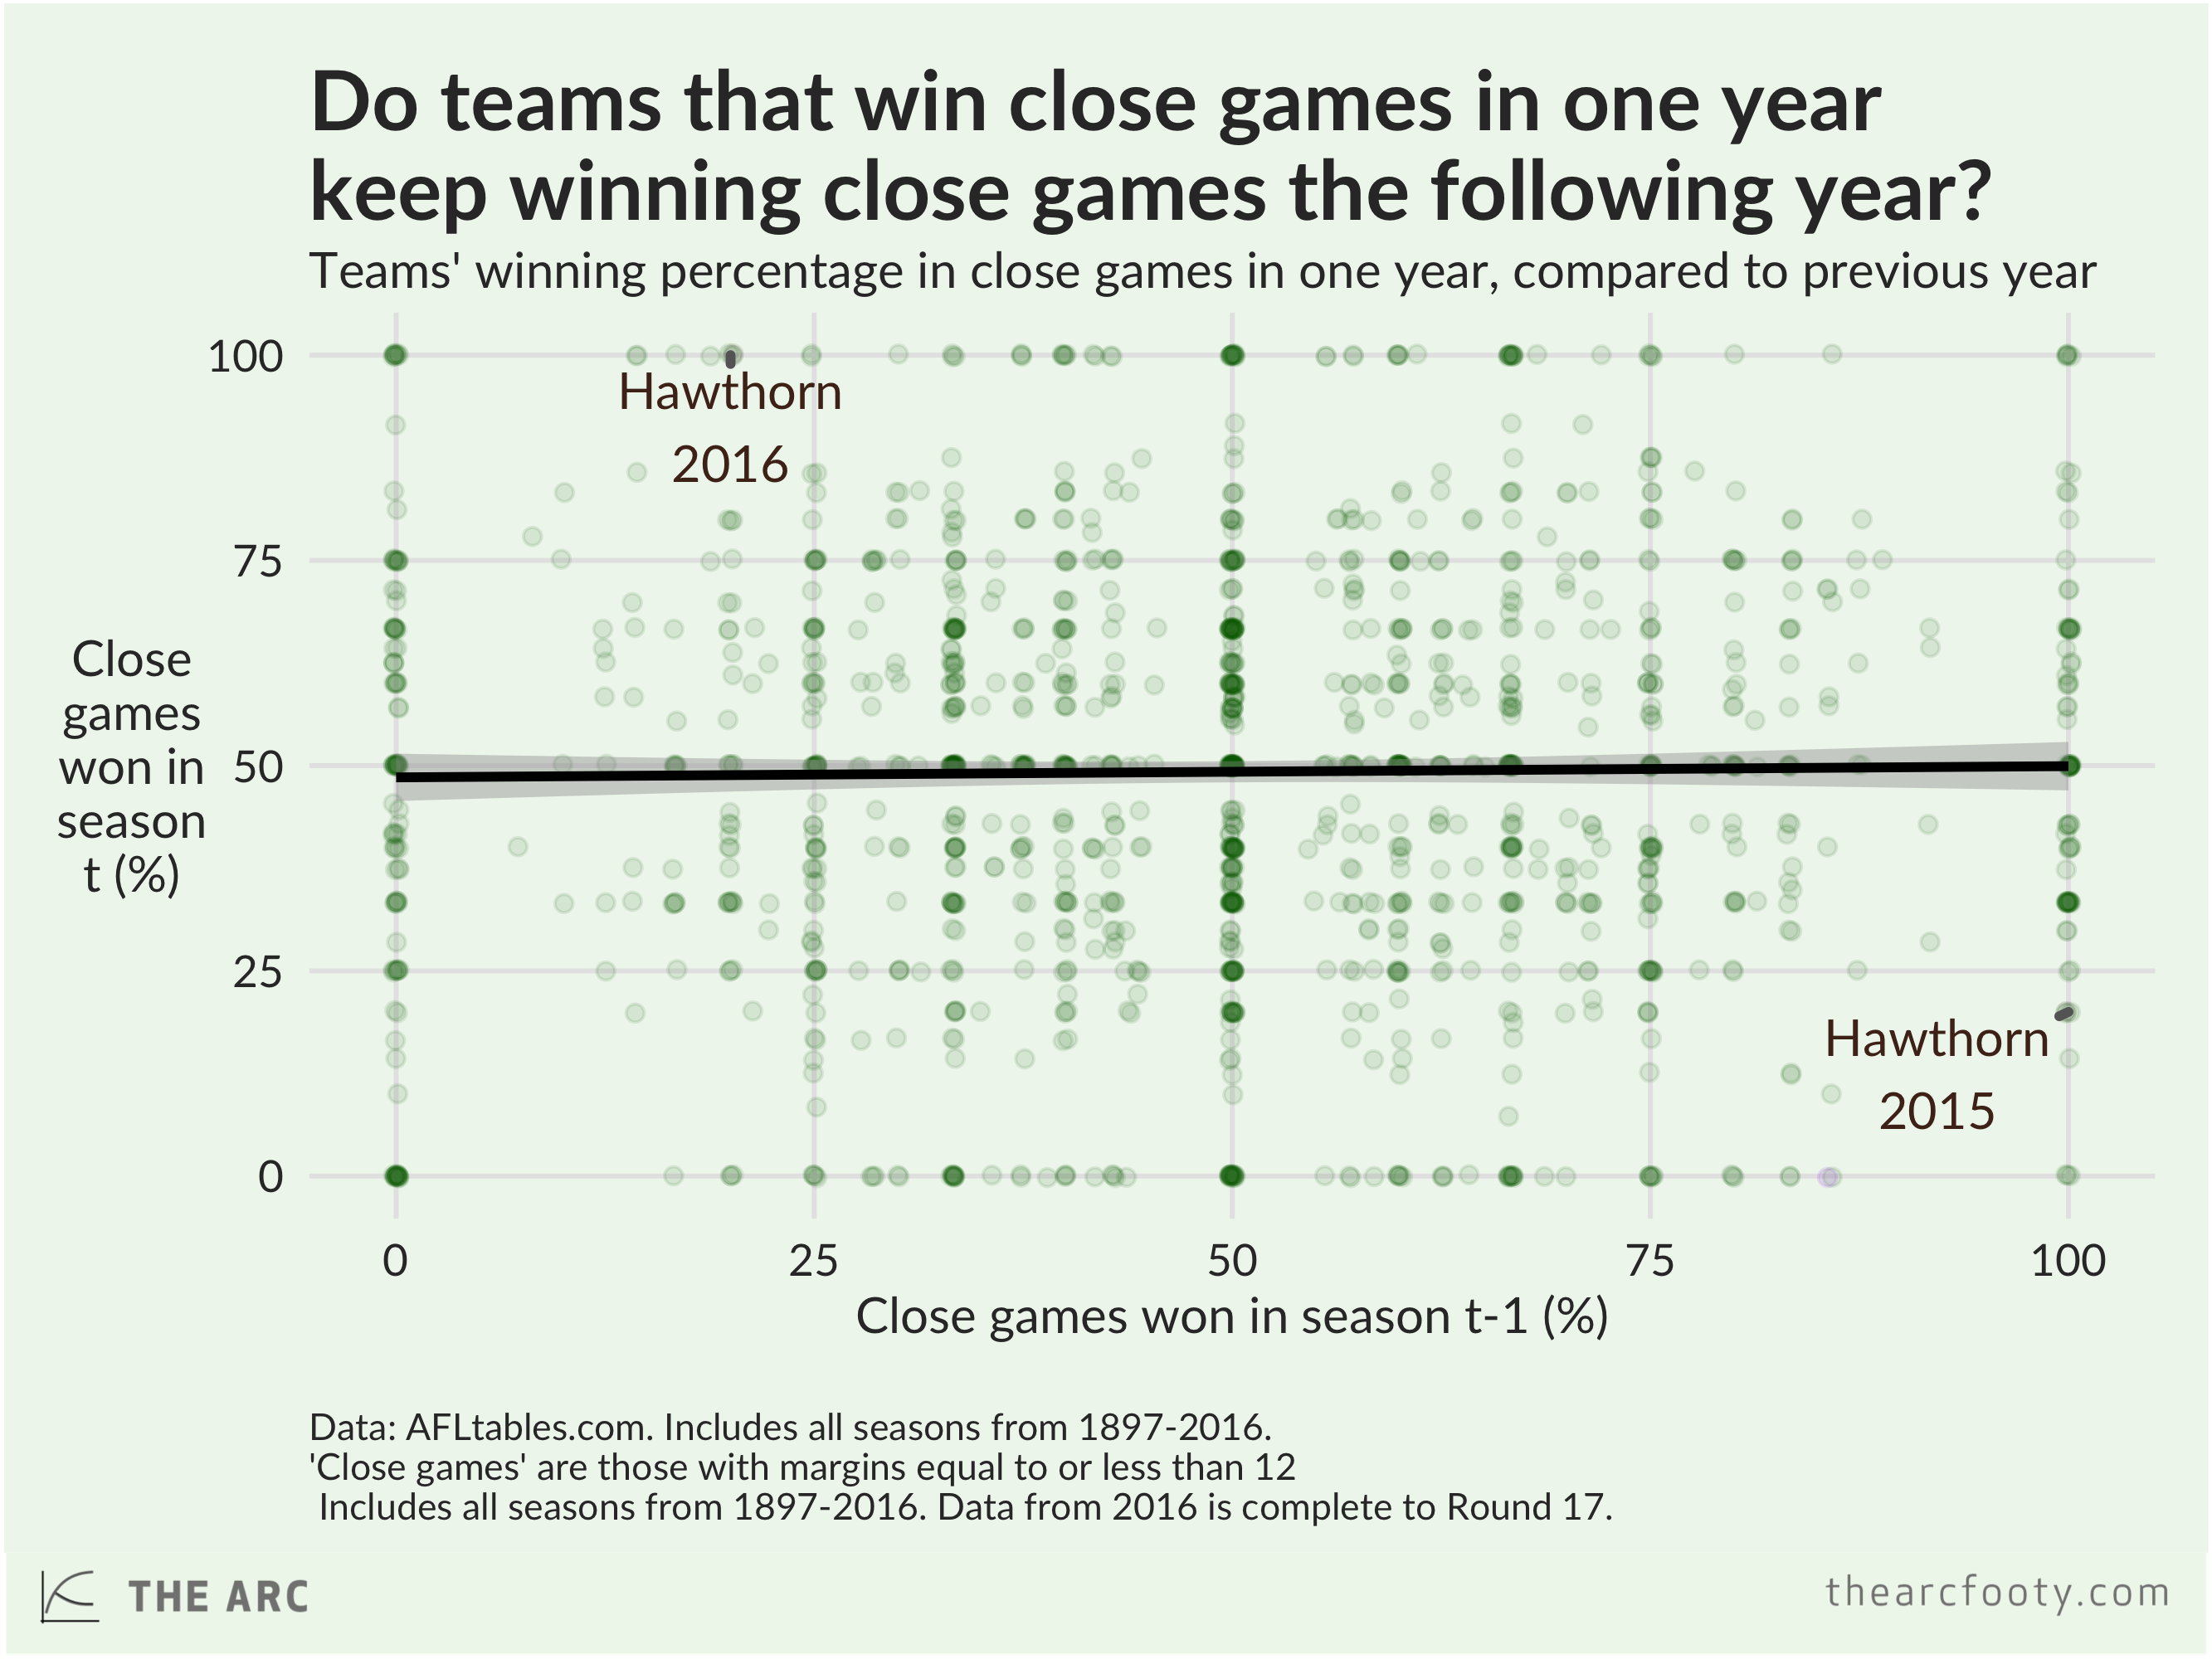
I'd appreciate some analysis of what teams do the year after losing a whole bunch of close games.
They win more. It's classic reversion to the mean, the same way that teams who win a bunch of close games don't keep it up, despite inevitably developing a reputation for being strong in tight contests.

closegamesscatter3.png
 
I'd appreciate some analysis of what teams do the year after losing a whole bunch of close games.
IMO depends if they are growth minded or on a downhill slide. Analysis of Brisbane below with having close losses in 2018

Brisbane won 5 games in 2017 - finished last
Brisbane had 5 close losses and 5 wins in 2018 - finished 15th
Rocketed up the ladder in 2019 (easier fixture due to only have 5 wins in 2018) finished 2nd
Currently 2nd in 2020 with 2 games to go
 
I mean I can't tell what kind of ladder you've posted, so I can't answer the question about its logic.

On Squiggle.com.au, there is:
- The main projected ladder, which is an aggregation of projections from a variety of different public models, including Squiggle's in-house one
- Projected ladders from each individual public model
- An old one hidden behind a button on live.squiggle.com.au that tallies fractional wins

I thought it looked a bit like the last one, but maybe not? Anyway if you let me know where it came from, I can say what it's doing.
It was taken directly from your squiggle site, a few minutes before my comment. I would not have posted it here otherwise. I edited it slightly of course for clarity, including to remove the large gaps that came from pasting it here, but the ladder positions, win fractions and percentage are unedited.

I took it to be the main projected ladder.
Ah so that is more or less from running a bunch of simulations and counting up how many times each team finishes in each position, then taking the average.

Simulations are good at that, especially late in the year, because they don't just look at one thing (likely wins): they account for draws, percentage, and exactly who plays who.

So yes, you are correct: despite having 6.9 wins to 7.0, Essendon are still likely to finish higher than Fremantle, because that doesn't outweigh the fact that the Dockers must win more games than Essendon to overtake them, due to the draw.

That is, even though Fremantle have a slightly better chance to earn wins from the next two rounds than Essendon, it's still most likely that they won't. In a similar way, if you and I have to toss a screwed-up paper ball into a bin, and you're a slightly better throw than me, if the bin is fairly close, the most likely outcome is still that we both make our throws. (Or, if the bin is far away, we both miss.)

Projected ladders aren't a perfect way of presenting probabilities. There's a fun quirk right now where West Coast have a better chance of finishing Top 4 than Richmond, but the Tigers are still likely to finish higher. That's because Richmond have a higher ceiling, with a better shot at 2nd and 3rd.

Screenshot from 2020-09-11 06-55-42.png

So this ladder, which tries to minimize the distance between predicted and actual finishing position, ranks the Tigers higher than the Eagles, even though it knows the Eagles are more likely to make Top 4, and that the most likely outcome is West Coast 4th and Richmond 5th.
 
the squiggle really rated the tiges win last night....me very excite

Amazing move to the right. Looking like a 2 game competition right now according to the Squiggle. And we just smacked the other team. Here's hoping the Squiggle is predictive this year
 
Flagpole rating moved about 4 points....huge

Yeah, looks like we are coming home hard. We'll see. But nice feeling right now. Except the butterflies I can't get rid of. Many have been roughly were the Tigers are and fallen over. Here's hoping.
 
Yeah, looks like we are coming home hard. We'll see. But nice feeling right now. Except the butterflies I can't get rid of. Many have been roughly were the Tigers are and fallen over. Here's hoping.
We've put the lions, eagles and cats to the sword when it counted....we're in contention, not much more we can ask for
 

Remove this Banner Ad

Back
Top