Certified Legendary Thread The Squiggle is back in 2023 (and other analytics)

Remove this Banner Ad

r196673_1295x864_3-2.png


From this excellent article by Matt Cowgill: http://www.espn.com/espn/feature/st...ics-explains-free-kick-counts-2017-afl-season

Matt also has a great chapter in Footballistics where he goes into more detail about this, basically making the argument that home ground advantage is mostly about crowd noise influencing umpiring decisions.


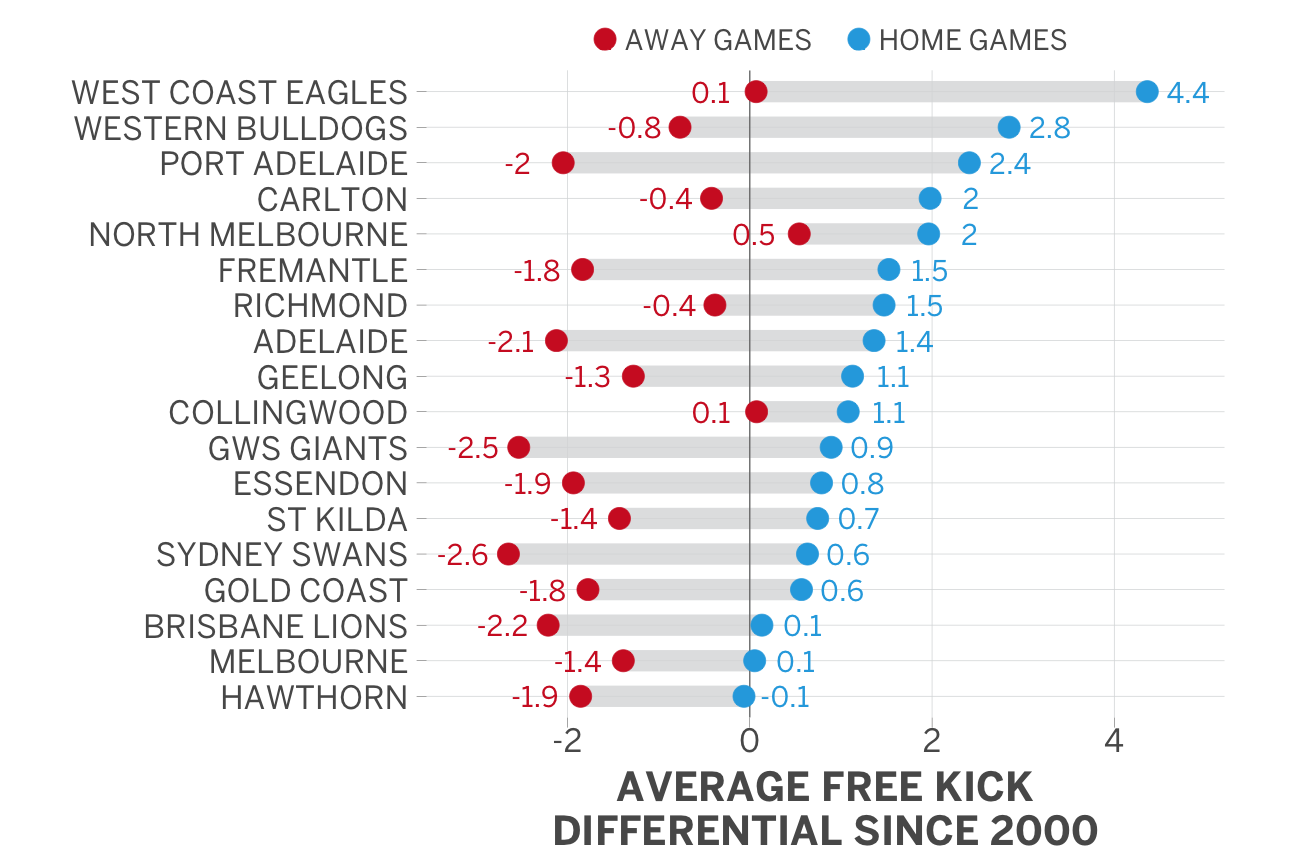
Interesting that the teams at the top play mostly in Blue, and teams at the bottom play in some variant of Red, especially as there are studies showing a positive Red bias to competitors in combat sports. Hawthorn the outlier. Maybe the umpires notice the teams in red more and pay more frees against?
 
West Coasts season according to squiggle:

giphy.gif
lel
Squiggle got the Eagles wrong nine times out of twenty five last season.Seven times they won when they should have lost and when the Eagles won the predicted winning margain was about thirty points short very often.Squiggle is kwap its got vic bias built in.

Edit -over 25 games in 2018 siggle underestimated the Eagles by an average of 14 points per game.I( just added it up slow night)
 
Last edited:

Log in to remove this ad.

lel
Squiggle got the Eagles wrong nine times out of twenty five last season.Seven times they won when they should have lost and when the Eagles won the predicted winning margain was about thirty points short very often.Squiggle is kwap its got vic bias built in.

Or Eagles have just been defying an excellent predictive statistical model.
 
Or Eagles have just been defying an excellent predictive statistical
model.
It would be excellent if you wotk out by how many points sqiggle either over estimates or underestimates every teams performance on average and factor that into your tips.Visualy though sqiggle is good very seductive.
 
It would be excellent if you wotk out by how many points sqiggle either over estimates or underestimates every teams performance on average and factor that into your tips.Visualy though sqiggle is good very seductive.
I’m not sure you fully understand how the squiggle works.
If a specific team continually outperforms the squiggle’s prediction, the squiggle will continue to rate them higher until they stop outperforming it.

The only way a team will permanently outperform the prediction is if they somehow manage to continually improve every week, in which case they will become a simply unstoppable team such that the squiggle’s underestimation of them doesn’t really matter because it thinks they are by far the best anyway.
 
lel
Squiggle got the Eagles wrong nine times out of twenty five last season.Seven times they won when they should have lost and when the Eagles won the predicted winning margain was about thirty points short very often.Squiggle is kwap its got vic bias built in.

Edit -over 25 games in 2018 siggle underestimated the Eagles by an average of 14 points per game.I( just added it up slow night)
On average, the bookies miss the predicted margin by 26-28 points. Good computer models are the same. So if Squiggle was really missing the Eagles' margin by only 14 points per game, that would be amazingly good.

Sadly, in reality Squiggle missed the Eagles' margin by 26.76 points per game, which is more around what you'd expect.

I don't see any evidence that Squiggle was worse at tipping the Eagles than any other team in particular -- tip rates and average margin error on the Eagles are very similar to the league average. I don't see any difference in Eagles wins vs Eagles losses, either.
 
I'm doing a bit of work on projected ladders at the moment, so this is a very relevant question!

The short answer is that Essendon are considered more likely than Adelaide to finish higher up the ladder, even though, once you round everything off, they're both projected to win around 11 games (Essendon 11.3, Adelaide 11.2).

The problem that people like me run into is there's plenty of nuance in probability-based predictions, which can't be captured by a ladder. So we have to decide how much predictive accuracy we want to throw away in order to make the ladder conform to the rules of reality, such as that, in this example, Adelaide must finish above Essendon if they both have 11 wins.

A week or two ago, I decided to stop forcing the ladder conform to those rules, since I think it's more valuable to accurately reflect the predicted ranks (i.e. Essendon is considered more likely to finish above Adelaide).

But there are a lot of wacky questions like this, and I'm still messing around with how best to answer them. So the ladder may continue to evolve in the near future.

In the meantime, I think the best ladder projection is this one, which aggregates predictions from a bunch of good models, and prioritizes getting the ranking right: https://squiggle.com.au/ladder/

Ok so the Live Squiggle ladder now looks like this:

5mip6Pb.png


The changes are:
  • That colored bar on the right is a visual representation of how likely each team is to finish in each ladder position.
  • It's derived from season simulations, which is more accurate than the previous method of totaling up fractional wins
  • It displays fractions of wins
  • It prioritizes getting the ranks right, which means it can show a team below another one even though they are expected to have slightly more wins.
 
On average, the bookies miss the predicted margin by 26-28 points. Good computer models are the same. So if Squiggle was really missing the Eagles' margin by only 14 points per game, that would be amazingly good.

Sadly, in reality Squiggle missed the Eagles' margin by 26.76 points per game, which is more around what you'd expect.

I don't see any evidence that Squiggle was worse at tipping the Eagles than any other team in particular -- tip rates and average margin error on the Eagles are very similar to the league average. I don't see any difference in Eagles wins vs Eagles losses, either.
Oh, also if you are concerned that Squiggle might have inbuilt vic bias (or some other kind of bias), you can now see what all the internet's best models are saying in this aggregated Projected Ladder!

Squiggle is in the middle of the pack regarding the Eagles:

g09vMYz.png

What I was saying over the course of the season squiggle undervalued the Eagles by about fourteen points. -Some weeks it predicted them to win they lost by plenty such as vNorth Melbs and Essendon.But when you add it all up ie predicted by squiggle to lose by five they win by 15 =undervalued by 20 .Predicted to win by 5 they lose by 30 = overvalued or over rated by 35. They (the Eagles ) underrated by 14 points for the season 2018 over the coarse of twenty five games.Richmond overrated by squiggle by 2 points over the season by the way.
Its just a little exercise I undertook thats all.
Oh I see. I get 12pts per game, but you are correct: Squiggle tipped the Eagles at its average accuracy rate, but it did underrate their margins on average.

I think this is what you what you'd expect for a team that exceeded pre-season expectations. As you can see from the following table, almost all of the damage was done during Rounds 2-9, when West Coast were turning out to be quite a bit better than previously believed. Over this period, Squiggle underrated West Coast margins by a whopping 32 points per game. For the rest of the season, it had them basically right, underrating by only 2.5 pts per game.

Screenshot from 2019-05-02 18-06-00.png
 

(Log in to remove this ad.)

Ok so the Live Squiggle ladder now looks like this:

5mip6Pb.png


The changes are:
  • That colored bar on the right is a visual representation of how likely each team is to finish in each ladder position.
  • It's derived from season simulations, which is more accurate than the previous method of totaling up fractional wins
  • It displays fractions of wins
  • It prioritizes getting the ranks right, which means it can show a team below another one even though they are expected to have slightly more wins.

Is the reason a team is ranked higher than a team with more expected wins due to the difficulty of the draw?
 
Is the reason a team is ranked higher than a team with more expected wins due to the difficulty of the draw?

No - it is basing the ladder order on rounded wins and % - so Adelaide is above Essendon because they both have 11 whole wins but Adelaide has a higher %
 
Is the reason a team is ranked higher than a team with more expected wins due to the difficulty of the draw?
It's mainly about percentage. Obviously at the end of the season, no-one has fractional wins: Essendon may land on 11 or 12 but they won't have 11.1. The 11.1 projection really means "they're a bit more likely to have over 11 wins than below." So while it's better to have 11.1 projected wins than 11.0, unless you manage to translate that 0.1 extra likelihood into an actual win, it won't matter.

And in that case, percentage becomes important. In the above pic, Essendon and Adelaide are ranked almost identically, but Essendon have slightly more expected wins while Adelaide have a slightly higher expected percentage. The question is: Which will matter? If the Bombers manage to translate their slight probability advantage into an additional win, that puts them above Adelaide, but if they don't, percentage will decide it, and there the Crows have a small advantage.

Running simulations is a good way of answering that question, since it tallies up the number of times that different outcomes occur. From its last run of 30,000 season sims, percentage turned out to matter more -- although only just, and it's really on a knife-edge.

Another time a scenario like this can arise is late in the season, with only a round or two to go, because of who plays whom. For example, it could be that to finish 8th, Fremantle have to win their last two games, while Brisbane will make finals if they win both OR if some other results fall their way. So Freo may have easier games and therefore a higher expected win number, while Brisbane are still more likely to finish above them.
 
No - it is basing the ladder order on rounded wins and % - so Adelaide is above Essendon because they both have 11 whole wins but Adelaide has a higher %
That was true until this week -- it doesn't round wins any more. Instead it runs simulations and tallies up who finishes where more often.
 
Collingwood +20 v Port Adelaide
Melbourne v Hawthorn +14
GWS +17 v St Kilda
Brisbane +25 v Sydney
Western Bulldogs v Richmond +14
West Coast +35 v Gold Coast
Carlton +5 v North Melbourne
Geelong +14 v Essendon
Adelaide +13 v Fremantle

6/9. Running total 38/63

1. Geelong 27.5
2. Collingwood 22.5
3. GWS 16.0
4. Adelaide 9.6 (+1)
5. Fremantle 9.5 (+1)
6. Essendon 9.1 (-2)
7. West Coast 3.5 (+1)
8. Port Adelaide 3.3 (-1)
9. Brisbane -0.5 (+2)
10. Western Bulldogs -3.2 (+4)
11. St Kilda -3.4 (-1)
12. Richmond -5.8 (-3)
13. North Melbourne -6.6 (+2)
14. Hawthorn -6.7 (-2)
15. Gold Coast -15.9 (+3)
16. Melbourne-16.3
17. Carlton -17.78 (-4)
18. Sydney -17.80 (-1)

Sydney v Essendon +23
Western Bulldogs +3 v Brisbane
Carlton v Collingwood +40
Gold Coast +6 v Melbourne
St Kilda +2 v West Coast
Port Adelaide v Adelaide +6
North Melbourne v Geelong +34
Hawthorn v GWS +18
Fremantle +24 v Richmond
 

Remove this Banner Ad

Back
Top