Certified Legendary Thread The Squiggle is back in 2023 (and other analytics)

Remove this Banner Ad

Where is Geelongs stupid sideways movement? Are 3 less scoring shots really the difference in defensive movement?
Ahh the mysterious ways of the squiggle

Qualitatively speaking, Geelong came into this round with a higher defensive rating than Richmond did in R4, and Brisbane came in to R4 with a higher attack rating than Freo did this round, so the squiggle naturally expected a lower score for Freo than they expected for Brisbane.
Also Geelong held a +12.7pt HGA this round, and while I can't see what Richmond had over Brisbane in R4, I'd imagine it was similar to the +10 held by Collingwood over Port today, which is only slightly smaller, but 2.7 is a full 10% of Freo's score, so I'm sure that played a part.
 

Log in to remove this ad.

I love funky stuff like this.

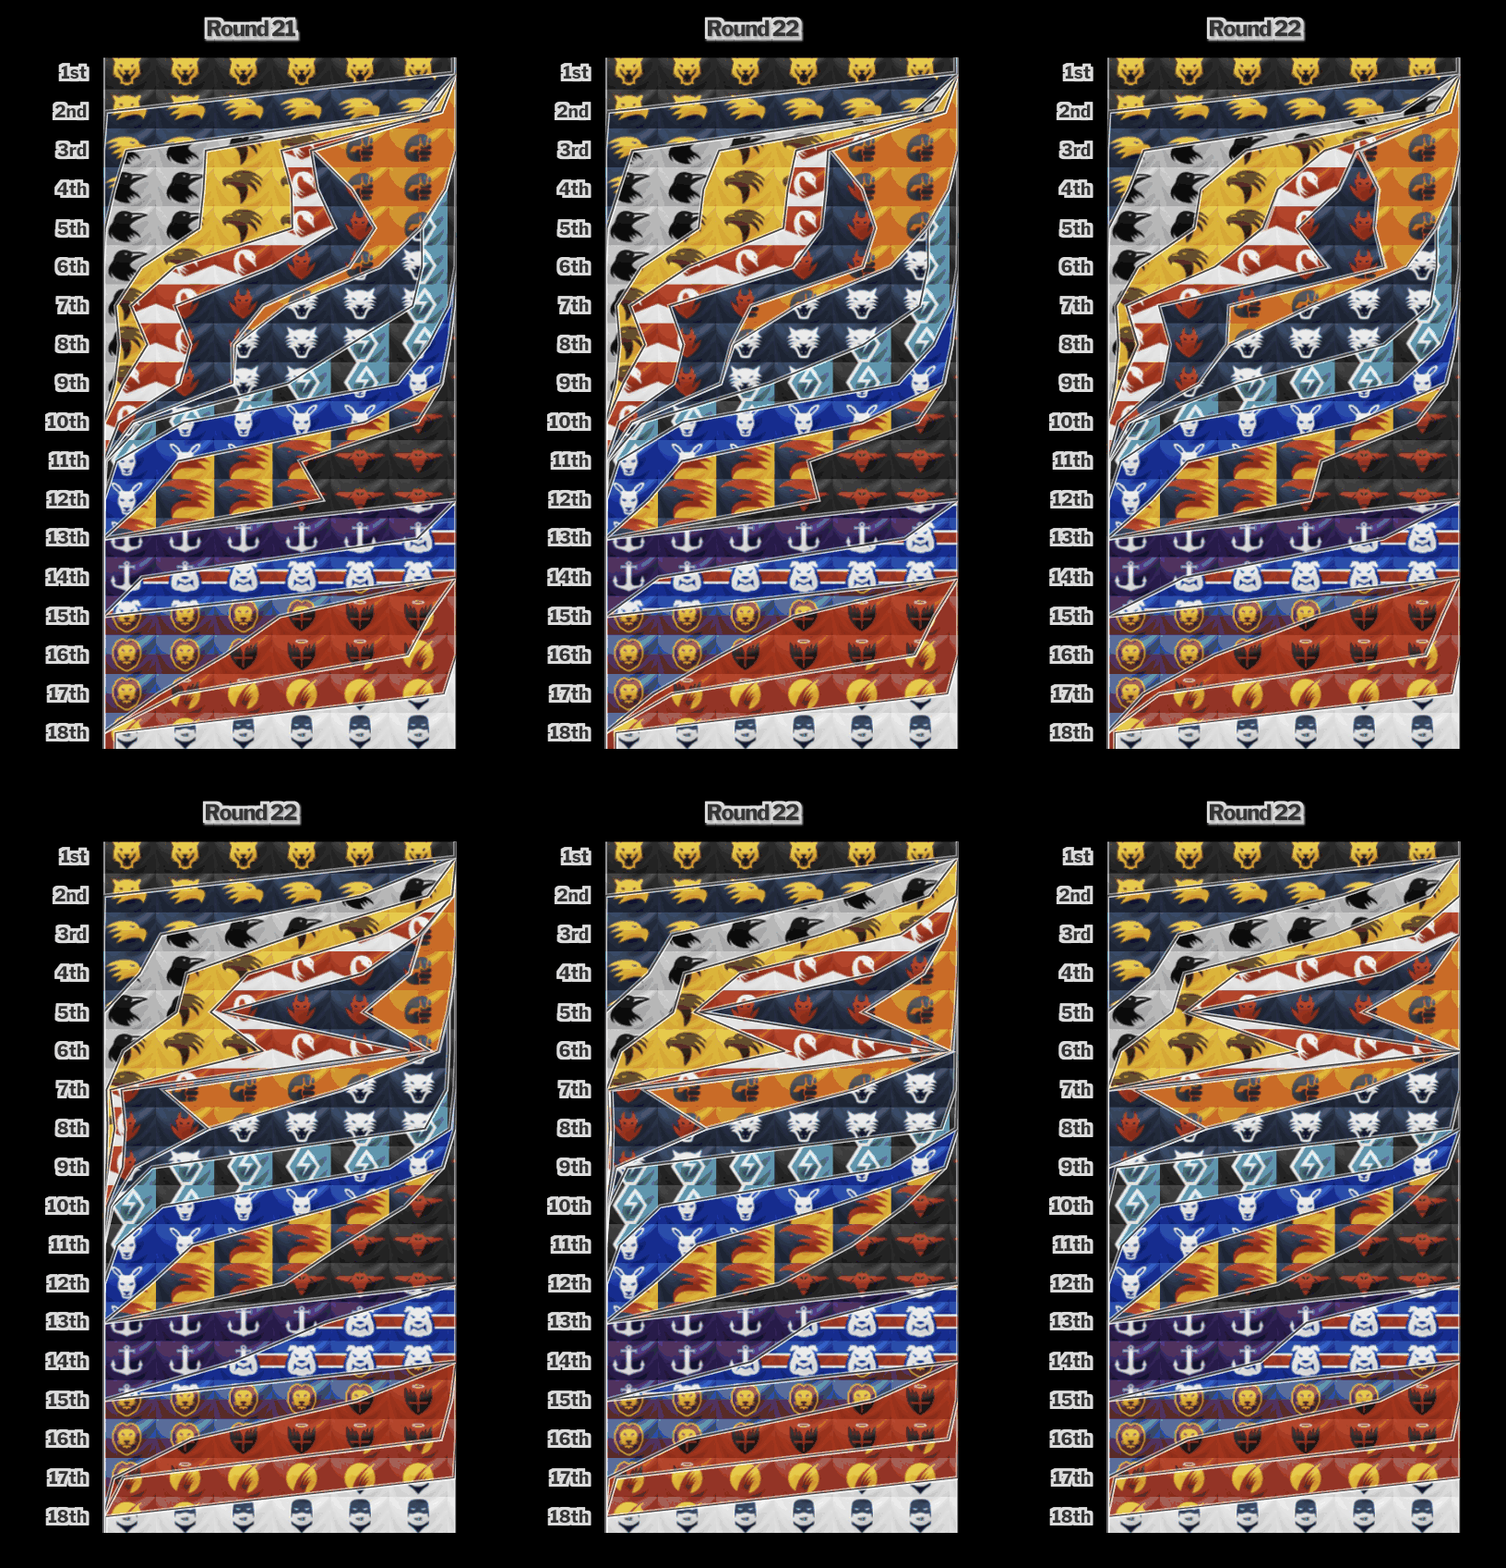
View attachment 545746
It's pretty crazy in Round 22! Here is the animated version.

Lots of quirks, including: GWS won't finish 6th (their current position), but either higher or lower. Sydney very likely to finish 4th or 6th (but not 5th!), and Demons either 5th or 8th. Hawks & Pies with fluid futures.

Unj224b.gif
 
Where is Geelongs stupid sideways movement? Are 3 less scoring shots really the difference in defensive movement?
- Three scoring shots doesn't sound like much, but 10 shots is 43% more than 7.
- Later in the season
- A bit more HGA at Kardinia Park
 
Old squiggsy choking on its roast Swan late in the season - forecast them to miss the 8 for much of the year - now thinks they will be top 4!
Well I don't know about "much of the year..." the Swans were rated a sub-50% chance of finals for two rounds (R19 & R20).

There was also a round where they had a better-than-even chance, but it was less than 8 other teams, so they were ranked 9th (R18 after the loss to Suns).

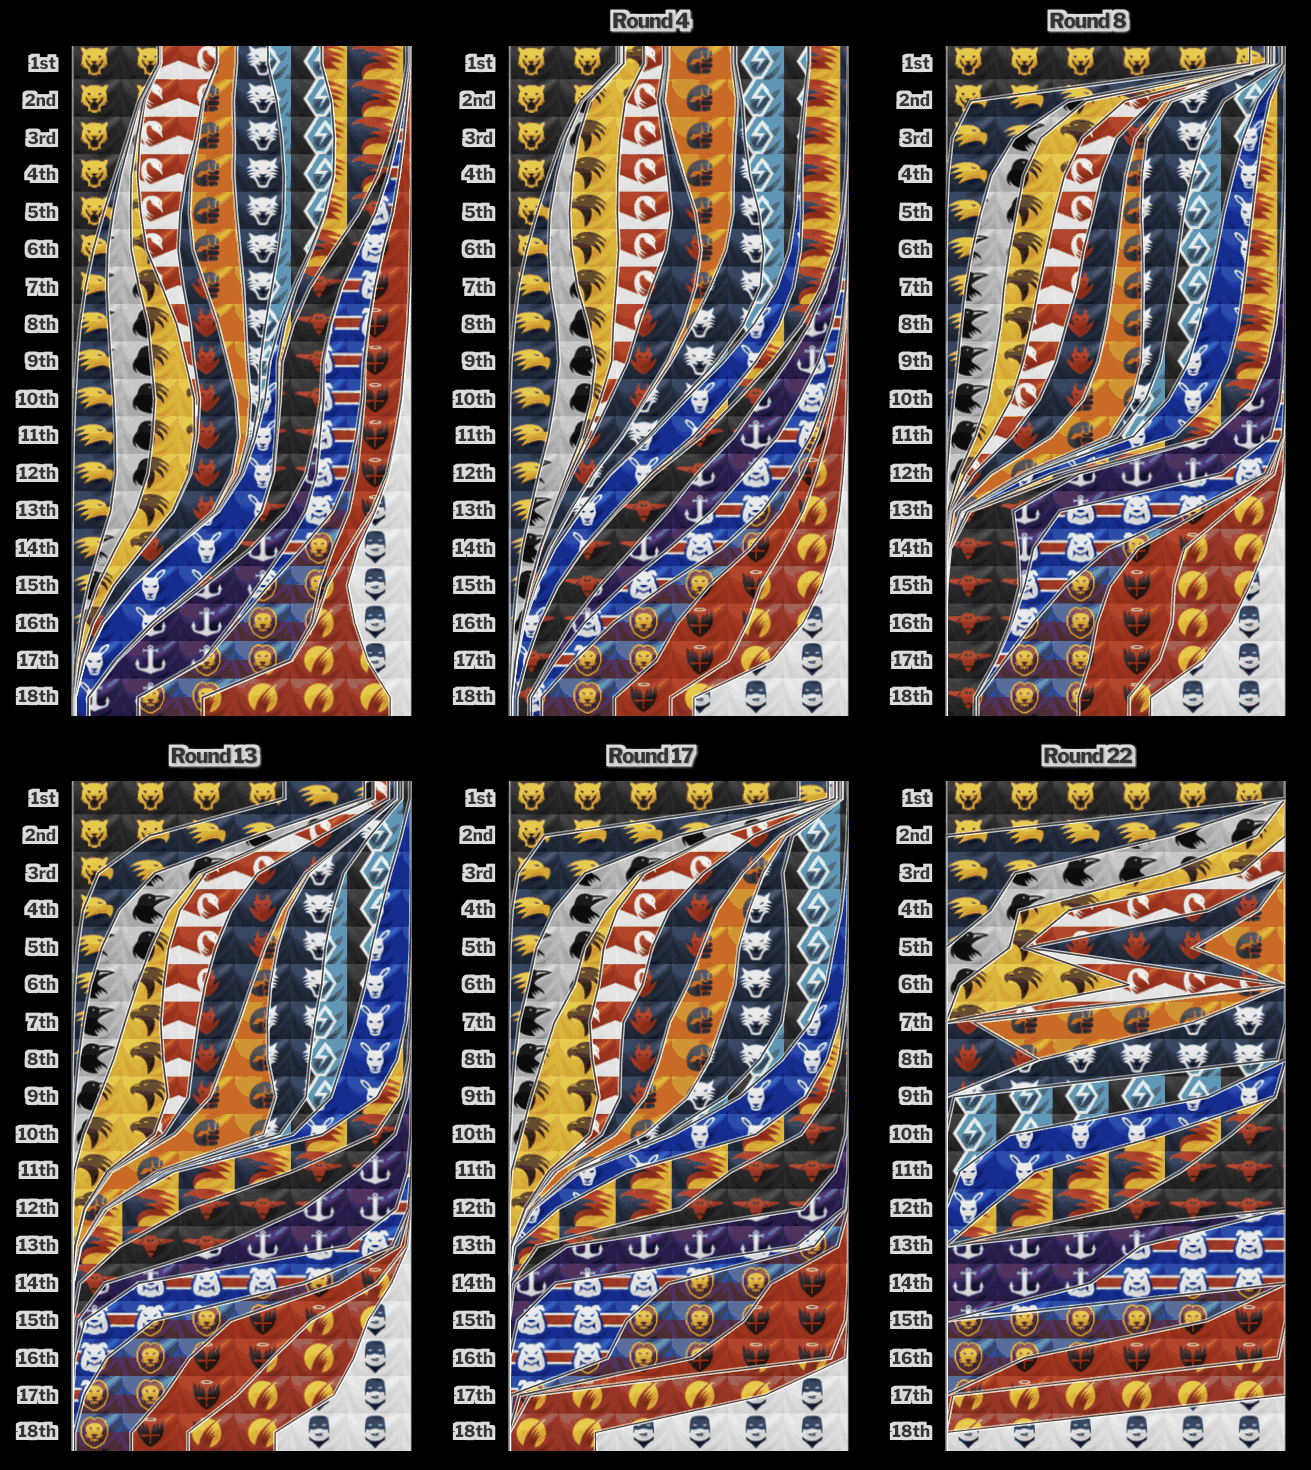
Year-to-date Tower of Power (direct link):

EF9TrlZ.gif


Carlton’s tower is consistent
 

(Log in to remove this ad.)

Flagpole still seems to be spitting out some weird numbers. Dee's and Geelong closer to a flag than teams in the top 4? Doesn't seem to make a whole lot of sense statistically.
 
Flagpole still seems to be spitting out some weird numbers. Dee's and Geelong closer to a flag than teams in the top 4? Doesn't seem to make a whole lot of sense statistically.
This one's legit, although Flagpole doesn't try to adjust for double chances, likely finals fixturing, or anything else -- it's purely a form rating.

Melbourne and Geelong are popular choices for the second-best teams in the comp at the moment; it's not just Squiggle. In the case of the Demons, that's at least partly because mathematical models tend to rate results against bad opponents more highly than people do.

He's offended because a mathematical system which works with definitive data spits out mathematical scenarios he doesn't like.
 
He's offended because a mathematical system which works with definitive data spits out mathematical scenarios he doesn't like.
The mathematics, as stated previously, are flawed. It has nothing to do with pushing out numbers i don't like. There are very few real indicators at the end of the home and away season that point to who will win the premiership outside of the basic eye test, but arguably the most definitive is finishing top 4. It simply doesn't make sense to completely ignore a key statistic that (outside the bulldogs) has held true for nearly 2 decades. The evidence from decades worth of data would indicate that your chance of winning the premiership is greatly, if not nearly completely reduced if you don't finish top 4.

Now, if the assertion of the data was "power rankings of the most in form teams in the AFL", sure, Melbourne would but up and around the top spot, as would Geelong, but its not. The Flagpole (as the name indicates) is a representation of who is closer to a premiership which, as previously stated, finishing top 4 is a huge factor. To ignore that seems pretty silly and the to suggest that factor is irrelevant is intellectually dishonest.

The Flagpole seems more than capable of eliminating teams flagpole height if their chance of finishing top 8 disappears (as their rating is given a 0 across the board), which would indicate ladder position does play a role. Not sure why top 4 can't have some sway on the data as well.
You could factor it and I’m sure FS has considered/is considering it, but it’s tricky to define. It’s easy to distinguish top 8 from bottom 8 - scale the flagpole down according to percentage chance of making finals. But it’s a slippery slope when you factor in who makes top 4 - what about Home finals? You start tipping the finals to rate chances which the flagpole explicitly tries not to do. In any case, it’s very rare to see this sort of situation, so is it really worth the effort to try eradicate it?
 
Remember when squiggle predicted West Coast to drop 5 games after R11 and people though it was being ridiculous? Guess what’s happened since?

Squiggle also predicted North to make finals around that point and Champion Data thought otherwise. People still backed Squiggle.

In the end predictions are predictions and for the record I didn't rubbish Squiggle at any point during this year. I don't think some posters understand what predictive models are.
 
You could factor it and I’m sure FS has considered/is considering it, but it’s tricky to define. It’s easy to distinguish top 8 from bottom 8 - scale the flagpole down according to percentage chance of making finals. But it’s a slippery slope when you factor in who makes top 4 - what about Home finals? You start tipping the finals to rate chances which the flagpole explicitly tries not to do. In any case, it’s very rare to see this sort of situation, so is it really worth the effort to try eradicate it?
I would imagine if you tried to simulate the effect of finishing top 4, you'd work out the chances of continuing to the next week of finals for each team. For example (These are just rough numbers):

Chance of Continuing:

Tigers: Week 2 - 100%, Week 3 - 75%, Week 4 - 60%
West Coast: Week 2 - 100%, Week 3 - 55%, Week 4 - 40%
Collingwood: Week 2 - 100%, Week 3 - 45%, Week 4 - 30%
.......
Melbourne: Week 2 - 60%, Week 3 - 30%, Week 4 - 15%
GWS: Week 2 - 55%, Week 3 - 25%, Week 4 - 10%
Geelong: Week 2 - 40%, Week 3 - 15%, Week 4 - 5%

You'd then be able to spit out a number that is probably more indicative of chance to win the premiership than just "how good team A is" or "How good team B's form is". This is reflected in betting odds, which is why Collingwood is arguably about on par with Melbourne at the moment, but the Pies are second favorites to win the premiership ($7.00) while Melbourne is 7th favorite ($13.00).

Just my opinion for more accurate ratings.
 

Remove this Banner Ad

Back
Top