- Aug 18, 2009
- 4,229
- 17,495
- AFL Club
- Richmond
- Thread starter
- #1,051
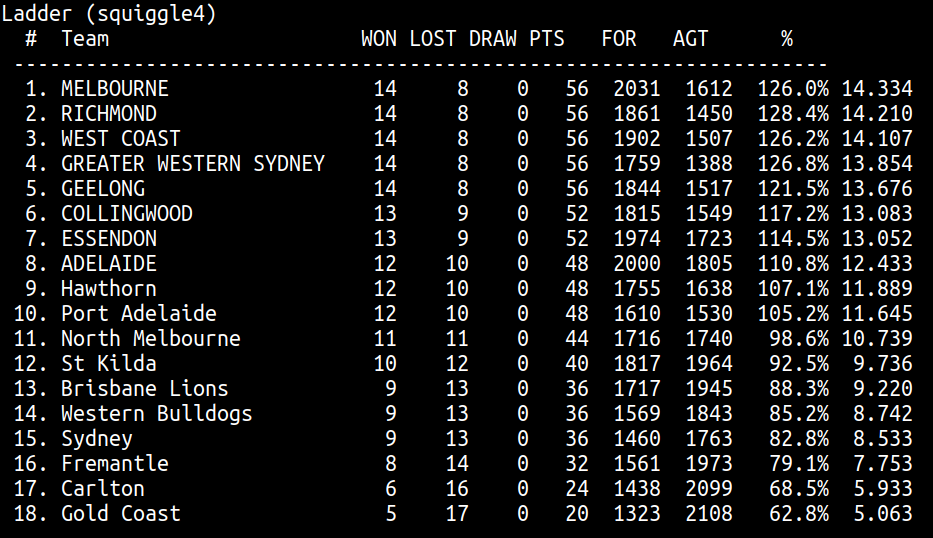
It does!Is it just me or does this total 199 wins?
The short answer as to why is "rounding." But the real answer is more interesting.
Most people think if you're going to predict a ladder, it should at least pass the sniff test of adding up to the right number of wins. Which makes intuitive sense. If the ladder can't even get that right, why should it be right about anything else?
But this is actually wrong: Using the same data, a logically impossible ladder will be more accurate than a possible one.
What people imagine is that there are lots of possible ladders and you should pick the most likely one. The problem here is there are way more possible ladders than you think. There are actually 6,402,373,705,728,000 of them, which you can calculate with 18 x 17 x 16 ... (also known as 18!, or 18 factorial). The way that works is if you're making a ladder, you can put any of 18 teams in the first slot, then any of 17 remaining teams in the next slot, and so on.
6.4 quadrillion is a lot of ladders! And we're just getting started, because a ladder with Melbourne first on 17 wins is different to a ladder with Melbourne first on 16 wins. Even if we're really conservative and say the number of wins at each ladder position can only be one of two possible values (e.g. 1st must have 17 or 16 wins, 2nd-3rd must have 16 or 15, and so on), we are now dealing with 1,678,343,853,000,000,000,000 possible ladders, or 1.67 sextillion (36 x 34 x 32...).
There are so many possible ladders that it's mind-bogglingly improbable that anyone will guess it just right. And by that, I mean even in our conservative scenario, it's less likely than you buying three Tatts tickets on three consecutive weeks and winning the jackpot each time on your first try. Even though some ladders are clearly more likely to occur than others, there are still so many combinations that for all practical purposes, it's certain that the most likely one WON'T occur.
Here's an example in practice, where Tony Corke from Matter of Stats was only dealing with a relatively tiny number of possible ladders -- 24,088, from 50,000 simulations with only 4 rounds left to play, looking at ranks only, not number of wins. Even then, the most common ladder occurred only 0.16% of the time. That is, it was 99.84% likely to be wrong in some way:
So if the mode ladder -- that is, the ladder that's most likely to occur, according to your calculations -- is definitely going to be wrong... why use a mode ladder?
There's a reason mode is used far less often than mean or median when people want to average a range of data (e.g. many possible ladders) down into a single representative value (e.g. one ladder): Mode is insensitive to the way the data is distributed.
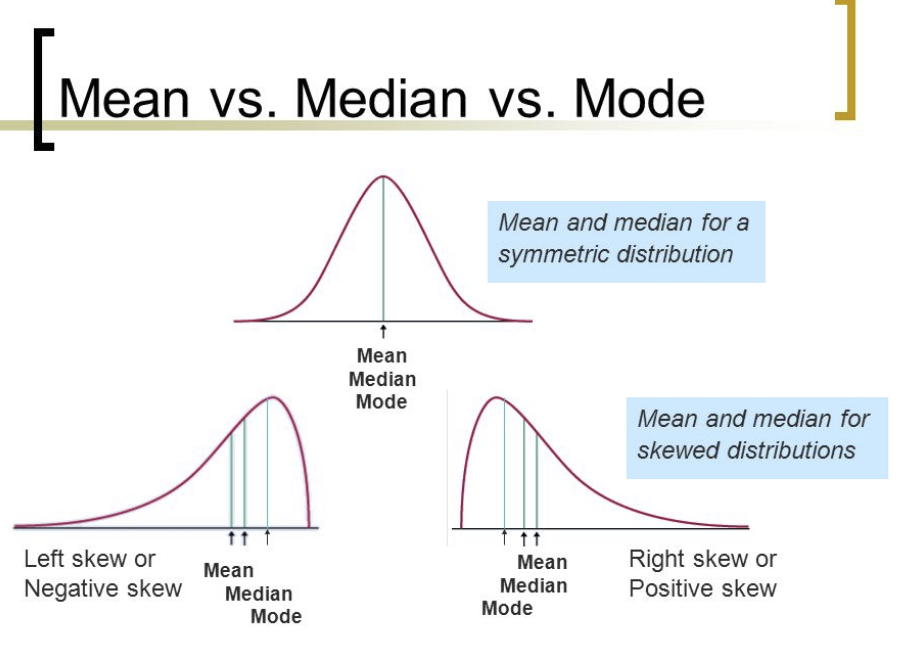
For example, maybe GWS finish 4th in your mode ladder. But that might be their highest plausible position, in your sims, and they otherwise finish 5th-8th. Or maybe it's skewed the opposite way, and they rarely finish any lower than 4th. A mode ladder can't reflect this. As such, taking the average as a mean better represents what your probabilities are saying.
We can see this with a simplified example where the league has 3 teams -- West Coast, North Melbourne, and Carlton -- and they play each other twice. Let's simulate this season three times:
West Coast: 2 wins, 2 wins, 1 win
North Melbourne: 1, 0, 1
Carlton: 0, 1, 1
In reality, we'd run more than three simulations, to reduce the effect of luck -- I reckon Carlton fluked a game or two here. But anyway, with this data set, our mode ladder would look like this:
1. West Coast: 2 wins
=2. North Melbourne: 1 win
=2. Carlton: 1 win
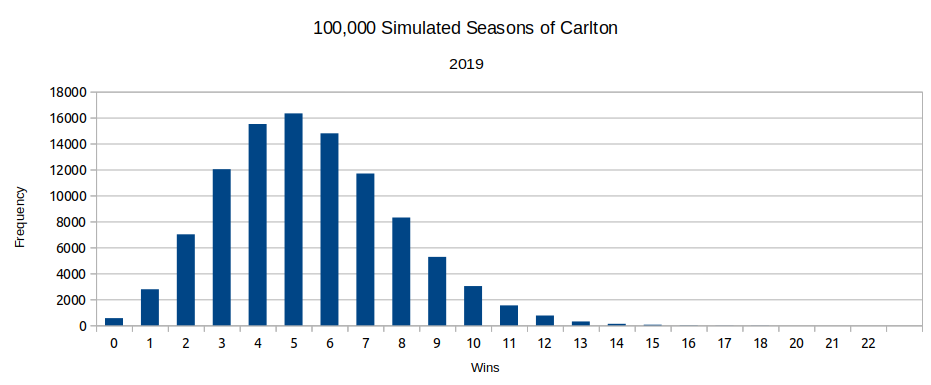
This adds up to 4 wins, but there are only 3 games! The mode ladder is ignoring how each team's number of wins has a downward skew -- that is, how there are sims in which each team won fewer games than its mode, but no sims in which a team won more games than its mode.
A mean ladder doesn't have this problem:
1. West Coast: 1.667 wins
=2. North Melbourne: 0.667 wins
=2. Carlton: 0.667 wins
... until you round it! If you do, you will round every team up, and get the same result as the mode ladder.
Now, you don't want to round it, because that's just throwing away accuracy. You should really post your ladder with decimal places in it, and hope that people understand that 1.667 wins means "2 is more likely than 1." But most people expect their predicted ladders to have whole numbers of wins, so you might do it anyway. And at that point, someone might observe that your ladder doesn't add up right.
There's only one way to make it add up right: round a team down instead of up. But which one? There's no reason to round Carlton down and North Melbourne up: They have the exact same value. If you do round down a team, your ladder now adds up, but has become less accurate, because one team's predicted wins is 0.667 away from what your model said, instead of 0.333.
Fundamentally, this problem stems from the fact that you're trying to squash a range of values (many possibilities) down to a single value ("most likely"). There's just no way to do that without some loss of information. All you can do is choose which information you care about and prioritize that.
If you can see that the numbers in these kinds of predictions are average values representing a range of plausible ones, and that there's no point in trying to predict a ladder just right because that's impossible, then you can see, I hope, that it's better not to force it to be logically possible. And look at the decimal numbers in the far-right column instead.
Last edited: