Remove this Banner Ad

Mega Thread The Stats Thread

🥰 Love BigFooty? Join now for free.

7.15
b0e60b4fff5851d65528d0682597750c.jpg


21.12
99248140303f7fbf70b9f1255e6b3a16.jpg


12.17
ad72c12ce0573e716c84a45fca8f0499.jpg


14.19
2f6ebefabfe030b63569de91d2a2ae05.jpg


12.17
1b16ee99571b1c79cf99c14168446f4b.jpg


7.12
d3f4ddf69f6c9e0e54fde04d9de0fabd.jpg


7.8
df4d12e856f3b5ab51177d71e54dc081.jpg
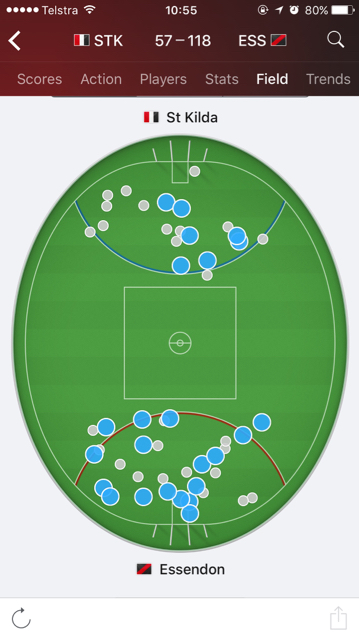
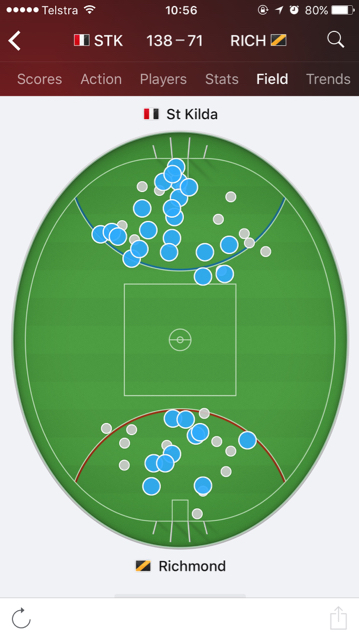
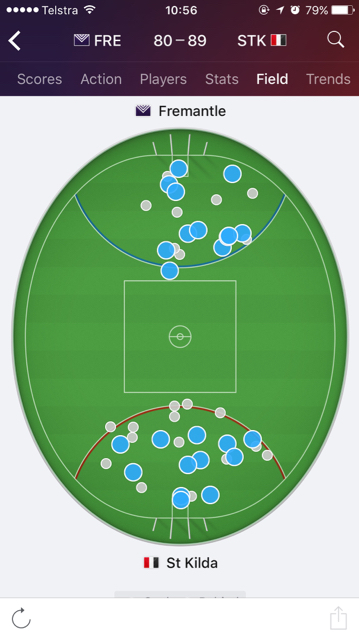
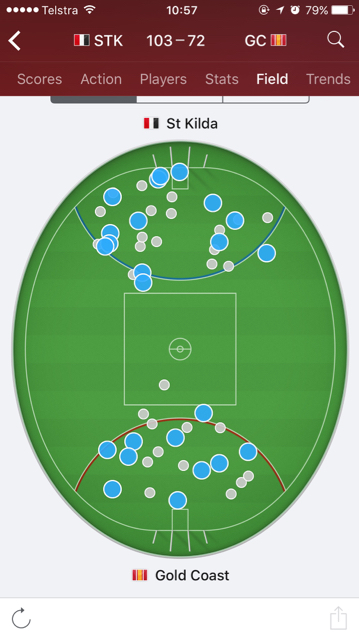
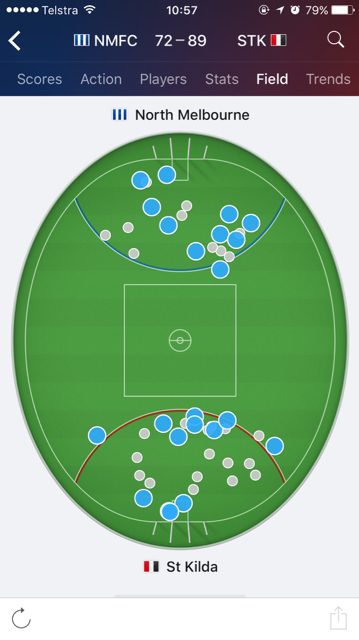
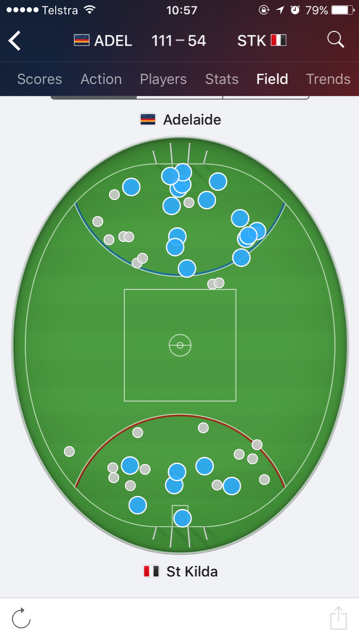
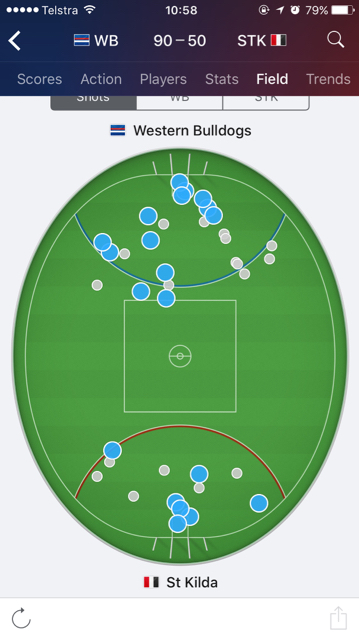
Pardon my ignorance, but is the blue dots where goals were kicked, smaller points?
 
St Kilda

Strengths: Pressure, pressure, pressure

The Saints lead the AFL in pressure acts and with their employment of an aggressive forward press. They are particularly proficient at locking the ball inside their forward 50, averaging the 4th most tackles inside 50. This has protected their average defensive unit by defending higher up the ground by conceding the 3rd least inside 50s in the competition.

Rank | Team | Tackles Inside 50 (Avg)
\1st|Geelong|14.4
\2nd|Richmond|13.9
\3rd|Port Adelaide|13.7
\ 4th | St Kilda | 13.1
\5th|Melbourne|13.0
\ 6th | Sydney | 12.6
\7th|Collingwood|12.5
\8th|West Coast|12.4
\9th|Western Bulldogs|12.4
\10th|Adelaide|12.3
\11th|North Melbourne|12.1
\12th|Carlton|11.5
\13th|GWS|11.3
\14th|Brisbane|11.2
\15th|Hawthorn|11.1
\16th|Gold Coast|10.6
\17th|Essendon|9.8
\18th|Fremantle|8.1

Rank | Team | Pressure Acts (Avg)
\ 1st | St Kilda | 325.0
\2nd|Hawthorn|320.8
\3rd|Adelaide|317.9
\4th|Western Bulldogs|308.8
\5th|North Melbourne|304.8
\6th|Melbourne|304.8
\7th|Fremantle|302.0
\8th|Geelong|300.3
\9th|Carlton|300.2
\10th|Richmond|299.4
\ 11th | Sydney | 299.1
\12th|West Coast|299.0
\eq 13th|Collingwood|294.9
\eq 13th|Gold Coast|294.9
\15th|Port Adelaide|293.1
\16th|GWS|286.8
\17th|Essendon|284.9
\18th|Brisbane|283.0


Jack Steele leads the way for the Saints in this area, with his averages of 25.93 pressure acts a game (4th) and 7.71 tackles (equals 4th) elite in the AFL which was why it was so confusing that the Saints dropped him earlier in the year

Rank | Player | Tackles (Avg)
\1st|Scott Selwood (GEE)|11.80
\2nd|Rory Sloane (ADE)|8.00
\3rd|Tom Liberatore (WBD)|7.83
\eq 4th|Hugh Greenwood (ADE)|7.71
\ eq 4th | Jack Steele (STK) | 7.71
\eq 6th|Dayne Zorko (BRL)|7.50
\eq 6th|Brad Ebert (PTA)|7.50
\9th|Jack Viney (MEL)|7.43
\10th|Matt Priddis (WCE)|7.27

Rank | Player | Pressure Acts (Avg)
\1st|Tom Liberatore (WBD)|27.67
\2nd|Dayne Zorko (BRL)|27.56
\3rd|Hugh Greenwood (ADE)|26.57
\ 4th | Jack Steele (STK) | 25.93
\5th|Tom Mitchell (HAW)|24.75
\6th|Liam Shiels (HAW)|24.44
\7th|Scott Selwood (GEE)|24.40
\8th|Brad Ebert (PTA)|24.00
\9th|Rory Sloane (ADE)|23.94
\10th|Josh Kelly (GWS)|23.75

Weaknesses: Goalkicking accuracy

The Saints are the least accurate goalkicking side in the AFL, and in particular have struggled with their conversion in recent weeks. In 6 of their past 7 games they have tallied more behinds than goals (80 goals 100 behinds) with their biggest culprits in this period being Jack Steven (3.11), Jack Lonie (2.7), Jack Billings (6.11), Mav Weller (1.5), Jade Gresham (7.9) and Nick Riewoldt (7.8). The one exception has been Tim Membrey (11.2) but of course he is suspended for this game.

Last time we met
One of the concerns going into the Round 9 match this year was how the Swans were going to contain the outside game style and outside run of the Saints. The Swans ended up matching the Saints in the uncontested areas of the game - although we conceded a season high 292 uncontested possessions that day, we also racked up a season high 288 ourselves. But more tellingly we had a season high 120 uncontested marks on the day.
Has the Swans pressure acts and tackles increased since round 7?
 

Log in to remove this Banner Ad

Rounds 1-6
Pressure Acts 299.17
Tackles 74.67

Round 7 onwards
Pressure Acts 299.10
Tackles 64.50
Wow! the opposite of what I would have thought, given our results.
 
7.15
b0e60b4fff5851d65528d0682597750c.jpg


21.12
99248140303f7fbf70b9f1255e6b3a16.jpg


12.17
ad72c12ce0573e716c84a45fca8f0499.jpg


14.19
2f6ebefabfe030b63569de91d2a2ae05.jpg


12.17
1b16ee99571b1c79cf99c14168446f4b.jpg


7.12
d3f4ddf69f6c9e0e54fde04d9de0fabd.jpg


7.8
df4d12e856f3b5ab51177d71e54dc081.jpg
That Adelaide game is what I'd be expecting to see as a more normal distribution of accuracy... Pushed wide and high 50m arc. Accuracy would drop more significantly due to angle than distance these day though (IMO) so even if they can lock it in their 50, if we can congest the first 50% angle eaither side of centre and force them to kick from the boundary line or deep pockets then I think their confidence will come into play a bit. We need to convert and put early scoreboard pressure on them though.

EDIT - So many cliches... True. But cliche' none-the-less.
 
Game styles: Swans elite defensively, Hawks control the uncontested ball.

We take a look at the stats over the last 5 weeks, where the Hawks have a 3-1-1 record and the Swans of course have won all 5. Both teams in good form but doing it in contrasting styles.

The Hawks as well all know too well love to have control of the ball, racking up big numbers in disposals, marks and in particular the uncontested ball. They have also been particularly effective in their forward play, ranking 2nd in this 5 week period in forward efficiency and kicking the 2nd most goals.

The Swans on the other hand have been average offensively, being handicapped by our awful goalkicking accuracy which ranks last since Round 13. However the Swans have owned the defensive end and their average conceded goals of 9.4 is almost a goal ahead of 2nd placed Adelaide on 10.2

Following stats from R13 onwards

Table 1: Uncontested possession rate = uncontested possessions / total possessions

Rank | Team | Uncontested possession rate
\ 1st | Hawthorn | 66.29%
\2nd|Brisbane|66.17%
\3rd|St Kilda|65.63%
\4th|Collingwood|64.91%
\5th|Essendon|64.57%
\6th|Gold Coast|63.79%
\7th|Fremantle|63.31%
\8th|Richmond|63.10%
\9th|GWS|62.85%
\10th|West Coast|62.72%
\11th|W. Bulldogs|61.91%
\12th|Geelong|61.18%
\13th|N. Melbourne|61.17%
\14th|Carlton|60.84%
\15th|Adelaide|60.79%
\ 16th | Sydney | 60.53%
\17th|Melbourne|60.53%
\18th|Port Adelaide|60.33%

Table 2: Average Goals Scored
Rank | Team | Avg Goals
\1st|Essendon|15.6
\ 2nd | Hawthorn | 14.6
\3rd|Adelaide|14.2
\4th|Geelong|13.6
\eq. 5th|Port Adelaide|13.4
\ eq. 5th | Sydney | 13.4
\7th|N. Melbourne|13.2
\eq. 8th|Brisbane|13.0
\eq. 8th|GWS|13.0
\eq. 10th|Collingwood|12.6
\eq. 10th|St Kilda|12.6
\eq. 10th|West Coast|12.6
\eq. 13th|Melbourne|11.8
\eq. 13th|W. Bulldogs|11.8
\15th|Richmond|11.4
\16th|Gold Coast|11.2
\17th|Carlton|10.4
\18th|Fremantle|9.6

Table 3: Avg goal per inside 50 rate = Total goals / Total inside 50s
Rank | Team | Avg goal / I50 (%)
\1st|Brisbane|28.51%
\ 2nd | Hawthorn | 28.08%
\3rd|Essendon|27.37%
\4th|Adelaide|27.31%
\5th|St Kilda|25.61%
\6th|West Coast|25.20%
\7th|N. Melbourne|25.10%
\8th|Geelong|25.09%
\ 9th | Sydney | 24.54%
\10th|Port Adelaide|23.93%
\11th|Melbourne|23.79%
\12th|Gold Coast|23.53%
\13th|GWS|23.47%
\14th|Collingwood|22.91%
\15th|Carlton|22.13%
\16th|W. Bulldogs|21.15%
\17th|Fremantle|20.00%
\18th|Richmond|19.86%

Table 4: Goalkicking accuracy = Total Goals \ (Total Goals + Total Behinds). This is not quite accurate as it doesn't count shots that don't score but we don't have access to those stats.
Rank | Team | GK accuracy (%)
\1st|Melbourne|64.84%
\2nd|GWS|61.90%
\3rd|Geelong|61.82%
\4th|West Coast|60.58%
\5th|N. Melbourne|60.55%
\6th|Adelaide|60.17%
\7th|Collingwood|58.33%
\8th|Brisbane|57.52%
\ 9th | Hawthorn | 57.03%
\10th|Essendon|56.93%
\11th|Carlton|55.91%
\12th|Fremantle|55.81%
\13th|Gold Coast|55.45%
\14th|Port Adelaide|53.60%
\15th|W. Bulldogs|52.68%
\16th|Richmond|51.82%
\17th|St Kilda|51.64%
\ 18th | Sydney | 47.52%

Table 5: Average Goals Conceded
Rank | Team | Avg Goals
\ 1st | Sydney | 9.4
\2nd|Adelaide|10.2
\3rd|Port Adelaide|10.8
\4th|Richmond|11.0
\5th|Geelong|11.4
\eq. 6th|Essendon|11.8
\eq. 6th|GWS|11.8
\8th|Fremantle|12.0
\ eq. 9th | Hawthorn | 12.2
\eq. 9th|W. Bulldogs|12.2
\11th|West Coast|12.4
\eq. 12th|Melbourne|12.6
\eq. 12th|St Kilda|12.6
\14th|Carlton|13.4
\15th|Collingwood|15.0
\16th|Gold Coast|15.2
\eq. 17th|Brisbane|17.0
\eq. 17th|N. Melbourne|17.0

Player watch: James Sicily


Since the mid-season bye, when they came off a loss to the Suns at the MCG, the Hawks have switched things around by throwing players into different positions all over the ground. Jack Gunston starred last week across half back, Shaun Burgoyne has been playing more midfield than usual and Duryea has been spotted around the forward 50 area but perhaps the most successful move has been James Sicily into defence. In that 5 week period Sicily ranks highly in the following defensive categories (min 2 games):

Stat | Value | AFL Rank | Nearest Swan | Swan Stat | Swan Rank
\Avg. Intercept Marks|4.40|3rd|Callum Mills|2.00|eq. 33rd
\Avg. Intercept Possessions|9.20|4th|Heath Grundy|7.80|eq. 9th
\Avg. Contested Marks|2.80|eq. 7th|Sam Reid|2.00|eq. 13th
\Avg. Rebound 50s|4.60|eq. 11th|Jake Lloyd|3.40|eq. 53rd

and he still averages 23 disposals a game.With Sicily and Hodge patrolling the backline and aiming to start scoring chains from Swans' forward turnovers, our forwards will have to be more effective than they have been recently.
 

Remove this Banner Ad

Game styles: Swans elite defensively, Hawks control the uncontested ball.

We take a look at the stats over the last 5 weeks, where the Hawks have a 3-1-1 record and the Swans of course have won all 5. Both teams in good form but doing it in contrasting styles.

The Hawks as well all know too well love to have control of the ball, racking up big numbers in disposals, marks and in particular the uncontested ball. They have also been particularly effective in their forward play, ranking 2nd in this 5 week period in forward efficiency and kicking the 2nd most goals.

The Swans on the other hand have been average offensively, being handicapped by our awful goalkicking accuracy which ranks last since Round 13. However the Swans have owned the defensive end and their average conceded goals of 9.4 is almost a goal ahead of 2nd placed Adelaide on 10.2

Following stats from R13 onwards

Table 1: Uncontested possession rate = uncontested possessions / total possessions

Rank | Team | Uncontested possession rate
\ 1st | Hawthorn | 66.29%
\2nd|Brisbane|66.17%
\3rd|St Kilda|65.63%
\4th|Collingwood|64.91%
\5th|Essendon|64.57%
\6th|Gold Coast|63.79%
\7th|Fremantle|63.31%
\8th|Richmond|63.10%
\9th|GWS|62.85%
\10th|West Coast|62.72%
\11th|W. Bulldogs|61.91%
\12th|Geelong|61.18%
\13th|N. Melbourne|61.17%
\14th|Carlton|60.84%
\15th|Adelaide|60.79%
\ 16th | Sydney | 60.53%
\17th|Melbourne|60.53%
\18th|Port Adelaide|60.33%

Table 2: Average Goals Scored
Rank | Team | Avg Goals
\1st|Essendon|15.6
\ 2nd | Hawthorn | 14.6
\3rd|Adelaide|14.2
\4th|Geelong|13.6
\eq. 5th|Port Adelaide|13.4
\ eq. 5th | Sydney | 13.4
\7th|N. Melbourne|13.2
\eq. 8th|Brisbane|13.0
\eq. 8th|GWS|13.0
\eq. 10th|Collingwood|12.6
\eq. 10th|St Kilda|12.6
\eq. 10th|West Coast|12.6
\eq. 13th|Melbourne|11.8
\eq. 13th|W. Bulldogs|11.8
\15th|Richmond|11.4
\16th|Gold Coast|11.2
\17th|Carlton|10.4
\18th|Fremantle|9.6

Table 3: Avg goal per inside 50 rate = Total goals / Total inside 50s
Rank | Team | Avg goal / I50 (%)
\1st|Brisbane|28.51%
\ 2nd | Hawthorn | 28.08%
\3rd|Essendon|27.37%
\4th|Adelaide|27.31%
\5th|St Kilda|25.61%
\6th|West Coast|25.20%
\7th|N. Melbourne|25.10%
\8th|Geelong|25.09%
\ 9th | Sydney | 24.54%
\10th|Port Adelaide|23.93%
\11th|Melbourne|23.79%
\12th|Gold Coast|23.53%
\13th|GWS|23.47%
\14th|Collingwood|22.91%
\15th|Carlton|22.13%
\16th|W. Bulldogs|21.15%
\17th|Fremantle|20.00%
\18th|Richmond|19.86%

Table 4: Goalkicking accuracy = Total Goals \ (Total Goals + Total Behinds). This is not quite accurate as it doesn't count shots that don't score but we don't have access to those stats.
Rank | Team | GK accuracy (%)
\1st|Melbourne|64.84%
\2nd|GWS|61.90%
\3rd|Geelong|61.82%
\4th|West Coast|60.58%
\5th|N. Melbourne|60.55%
\6th|Adelaide|60.17%
\7th|Collingwood|58.33%
\8th|Brisbane|57.52%
\ 9th | Hawthorn | 57.03%
\10th|Essendon|56.93%
\11th|Carlton|55.91%
\12th|Fremantle|55.81%
\13th|Gold Coast|55.45%
\14th|Port Adelaide|53.60%
\15th|W. Bulldogs|52.68%
\16th|Richmond|51.82%
\17th|St Kilda|51.64%
\ 18th | Sydney | 47.52%

Table 5: Average Goals Conceded
Rank | Team | Avg Goals
\ 1st | Sydney | 9.4
\2nd|Adelaide|10.2
\3rd|Port Adelaide|10.8
\4th|Richmond|11.0
\5th|Geelong|11.4
\eq. 6th|Essendon|11.8
\eq. 6th|GWS|11.8
\8th|Fremantle|12.0
\ eq. 9th | Hawthorn | 12.2
\eq. 9th|W. Bulldogs|12.2
\11th|West Coast|12.4
\eq. 12th|Melbourne|12.6
\eq. 12th|St Kilda|12.6
\14th|Carlton|13.4
\15th|Collingwood|15.0
\16th|Gold Coast|15.2
\eq. 17th|Brisbane|17.0
\eq. 17th|N. Melbourne|17.0

Player watch: James Sicily


Since the mid-season bye, when they came off a loss to the Suns at the MCG, the Hawks have switched things around by throwing players into different positions all over the ground. Jack Gunston starred last week across half back, Shaun Burgoyne has been playing more midfield than usual and Duryea has been spotted around the forward 50 area but perhaps the most successful move has been James Sicily into defence. In that 5 week period Sicily ranks highly in the following defensive categories (min 2 games):

Stat | Value | AFL Rank | Nearest Swan | Swan Stat | Swan Rank
\Avg. Intercept Marks|4.40|3rd|Callum Mills|2.00|eq. 33rd
\Avg. Intercept Possessions|9.20|4th|Heath Grundy|7.80|eq. 9th
\Avg. Contested Marks|2.80|eq. 7th|Sam Reid|2.00|eq. 13th
\Avg. Rebound 50s|4.60|eq. 11th|Jake Lloyd|3.40|eq. 53rd

and he still averages 23 disposals a game.With Sicily and Hodge patrolling the backline and aiming to start scoring chains from Swans' forward turnovers, our forwards will have to be more effective than they have been recently.
The stats just tell the story we've known for the last couple of years really. Appreciate the work you do Grim!
 
This week is definitely a danger game, there has been a lot of talk about our revival but Hawthorn are in the middle of a mini-revival themselves.
 
All stats from R14 onwards

What Geelong are good at

  • Starving the opposition of the ball. They've conceded the 2nd least disposals and 1st in conceding uncontested possessions.
  • Solid at both ends of the ground. They've kicked the 3rd most goals and conceded the 3rd least goals in this period. Correspondingly, they've had the 2nd most inside 50s and conceded the 3rd least inside 50s.
  • Tackling pressure. They are the leading tackling team in the AFL - ranking 1st in tackles and tackles inside 50.
What Geelong are bad at
  • They are the worst side in turnovers but have limited the damage as they are only 8th in goals conceded from a turnover.
Geelong game style
  • The Cats love the handball with their kick-to-handball ratio of 1.09 the 2nd lowest in the AFL.
  • Plenty of free kicks when Geelong are involved. Since Round 14, the Cats have received the most free kicks as well as conceding the most free kicks in the AFL.

What Swans are good at
  • Team defence all over the ground. Number 1 in intercept possessions as well as 1st in goals conceded, inside 50s conceded and marks inside 50 conceded. Number 1 in metres conceded and number 2 in turnovers created from opposition
What the Swans are bad at
  • Goalkicking accuracy - dead last in the AFL
  • Hitouts to advantage and clearances - below AFL average in both categories.

Stat | Sydney | Syd rank | Geelong | Gee rank
\ Disposals conceded (avg) |373.00|5th| 352.83 | 2nd
\ Uncontested posessions conceded (avg) |231.83|5th| 212.17 | 1st
\ Goals (avg) |12.67|10th| 14.33 | 3rd
\ Goals conceded (avg) | 9.50 | 1st |10.83|3rd
\ Inside 50s (avg) |52.67|8th| 56.00 | 2nd
\ Inside 50s conceded (avg) | 46.50 | 1st |48.33|3rd
\ Tackles (avg) |68.00|7th| 75.17 | 1st
\ Tackles inside 50 (avg) |10.33|14th| 15.33 | 1st
\ Turnovers conceded (avg) | 71.17 | 14th |86.83|18th
\ Goals conceded from TO conc. (avg) | 5.83 | 2nd |6.83|8th
\ Kick-to-handball ratio | 1.33 | 5th |1.09|17th
\ Free kicks for (avg) |19.00|11th| 22.67 | 1st
\ Free kicks conceded (avg) | 19.67 | 9th |23.33|18th
\ Intercept possessions (avg) | 77.33 | 1st |70.83|7th
\ Marks inside 50 conceded (avg) |13.17|9th| 14.83 | 2nd
\ Metres conceded (avg) | 5156.67 | 1st |5257.67|3rd
\ Opposition Turnovers (avg) | 76.50 | 2nd |69.67|10th
\ Goalkicking accuracy (%) |48.41%|18th| 61.87% | 3rd
\ Hitouts to advantage (avg) |9.83|16th| 11.17 | 12th
\ Clearances (avg) |34.33|14th| 35.50 | 8th
 

🥰 Love BigFooty? Join now for free.

Fremantle's biggest weakness clearly lies in the forward half of the ground. Despite recruiting 2 new key forwards in Shane Kersten and Cam McCarthy over the offseason, the Dockers average just 75 points per game, with only Carlton doing worse at 72 points per game. Their offensive issues not only lie in their poor conversion once inside 50 (22.63% 16th in the AFL) but also the ability to generate forward 50 entries (avg 47.7 16th) as well as goalkicking accuracy (56.3% 12th).

The Dockers also are notoriously poor in their forward half pressure recording 8.4 tackles inside 50, clearly the worst team in the AFL and also only generating 5.7 goals from turnovers also last in the AFL.

However, while the team is struggling, the Dockers do possess 2 of the top 15 ranked players in the last 7 weeks. Nat Fyfe (avg 28.2 disposals, 6.8 clearances, 5.5 tackles, 6.0 marks) and Lachie Neale (29.7 disposals, 8.1 clearances, 5.1 tackles, 5.9 marks) are the standouts in the Freo midfield who will be missing the contributions of Michael Walters and Connor Blakely through injury.

All stats for R14-20

Table 1: Goals per game
Rank | Team | Goals (avg)
\1st|Adelaide|15.0
\2nd|Essendon|14.6
\eq 3rd|Collingwood|13.4
\eq 3rd|Geelong|13.4
\eq 3rd|West Coast|13.4
\eq 6th|GWS|13.1
\eq 6th|Hawthorn|13.1
\ eq 6th | Sydney | 13.1
\eq 6th|West Coast|13.1
\10th|St Kilda|12.3
\eq 11th|Brisbane|12.0
\eq 11th|N. Melbourne|12.0
\eq 11th|Richmond 12.0
\14th|Port Adelaide|11.9
\15th|Melbourne|11.3
\16th|Gold Coast|10.9
\ 17th | Fremantle | 10.4
\18th|Carlton|10.1

Table 2: Goals per inside 50 (%)
Rank | Team | Goal/I50 (%)
\1st|Brisbane|27.27%
\2nd|Adelaide|26.79%
\3rd|West Coast|26.55%
\4th|Essendon|26.29%
\5th|Hawthorn|25.99%
\ 6th | Sydney | 25.34%
\7th|Collingwood|24.54%
\8th|Geelong|24.48%
\9th|GWS|24.15%
\10th|St Kilda|23.76%
\11th|Gold Coast|23.68%
\12th|W. Bulldogs|23.23%
\13th|N. Melbourne|23.01%
\14th|Port Adelaide|22.37%
\15th|Richmond|22.16%
\ 16th | Fremantle | 21.92%
\17th|Carlton|21.85%
\18th|Melbourne|21.82%

Table 3: Inside 50s per game
Rank | Team | Inside 50s (avg)
\1st|W. Bulldogs|56.6
\2nd|Adelaide|56.0
\3rd|Essendon|55.4
\4th|Geelong|54.9
\5th|Collingwood|54.7
\6th|GWS|54.4
\7th|Richmond|54.1
\8th|Port Adelaide|53.0
\9th|N. Melbourne|52.1
\ 10th | Sydney | 51.9
\eq 11th|Melbourne|51.7
\eq 11th|St Kilda|51.7
\eq 13th|Hawthorn|50.6
\eq 13th|West Coast|50.6
\ 15th | Fremantle | 47.6
\16th|Carlton|46.4
\17th|Gold Coast|45.9
\18th|Brisbane|44.0

Table 4: Goalkicking accuracy (%) = Total Goals / (Total Goals + Total Behinds)
Rank | Team | Goalkicking accuracy
\1st|Melbourne|65.29%
\2nd|West Coast|60.65%
\3rd|Geelong|59.87%
\4th|Adelaide|59.32%
\5th|Gold Coast|58.46%
\6th|N. Melbourne|57.53%
\7th|GWS|57.50%
\8th|Brisbane|57.14%
\9th|Collingwood|56.97%
\10th|Hawthorn|56.44%
\ 11th | Fremantle | 55.73%
\12th|Carlton|55.04%
\13th|Port Adelaide|54.97%
\14th|Essendon|53.40%
\15th|W. Bulldogs|53.18%
\16th|Richmond|52.50%
\17th|St Kilda|51.81%
\ 18th | Sydney | 50.00%

Table 5: Tackles inside 50 per game
Rank | Team | Tackles inside I50 (avg)
\1st|Geelong|15.1
\2nd|Richmond|14.0
\3rd|Melbourne|13.6
\eq 4th|GWS|13.4
\eq 4th|St Kilda|13.4
\6th|Adelaide|13.1
\7th|West Coast|12.0
\8th|N. Melbourne|11.7
\9th|Collingwood|11.3
\eq 10th|Hawthorn|11.1
\eq 10th|W. Bulldogs|11.1
\12th|Carlton|11.0
\ 13th | Sydney | 10.9
\14th|Port Adelaide|10.3
\15th|Essendon|9.7
\16th|Gold Coast|9.1
\ 17th | Fremantle | 8.3
\18th|Brisbane|7.0

Table 6: Goals from opposition turnovers per game
Rank | Team | G from Opp TO (avg)
\1st|Adelaide|9.9
\2nd|Collingwod|8.9
\3rd|Essendon|8.7
\4th|Geelong|8.4
\5th|St Kilda|7.9
\eq 6th|Hawthorn|7.7
\eq 6th|N. Melbourne|7.7
\ 8th | Sydney | 7.4
\eq 9th|GWS|7.1
\eq 9th|Richmond|7.1
\11th|W. Bulldogs|7.0
\eq 12th|Brisbane|6.7
\eq 12th|Port Adelaide|6.7
\14th|Melbourne|6.6
\ 15th | Fremantle | 6.1
\eq 16th|Carlton|6.0
\eq 16th|Gold Coast|6.0
\eq 16th|West Coast|6.0
 
All stats and ladder from Round 7 onwards.
EgaJdR3.png


Top of the table clash. The two best attacks and two of the best three defences in the competition.

Crows: Converting pressure into points
The Crows are elite in the defensive side of the game, particularly in causing turnovers and converting those turnovers into goals. They rank 3rd in tackles, 2nd in pressure acts, 2nd in turnovers caused and 1st for goals resulting from turnovers caused. Combined with a raucous full house expected at Adelaide Oval, the Swans will need to be ready for their onslaught.

Table 1: Tackles per game
Rank | Team | Tackles (avg)
\1st|Geelong|77.6
\2nd|Melbourne|75.8
\ 3rd | Adelaide | 72.2
\4th|N. Melbourne|27.0
\5th|Hawthorn|70.9
\6th|GWS|70.6
\7th|St Kilda|70.2
\8th|Carlton|69.8
\9th|W. Bulldogs|69.5
\10th|Port Adelaide|68.9
\11th|Collingwood|66.9
\12th|Richmond|66.3
\13th|Fremantle|66.1
\ 14th | Sydney | 65.1
\15th|Gold Coast|65.0
\16th|Essendon|64.1
\17th|Brisbane|62.1
\18th|West Coast|64.1

Table 2: Pressure Acts per game
Rank | Team | Pressure Acts (avg)
\1st|St Kilda|324.6
\ 2nd | Adelaide | 321.6
\3rd|Melbourne|320.1
\4th|N. Melbourne|315.2
\5th|Hawthorn|312.5
\6th|Fremantle|308.9
\7th|Richmond|307.3
\8th|Port Adelaide|305.4
\9th|West Coast|304.1
\10th|Gold Coast|303.9
\11th|Collingwood|298.1
\12th|Carlton|297.6
\13th|W. Bulldogs|296.7
\14th|Geelong|296.1
\15th|GWS|294.4
\ 16th | Sydney | 292.4
\17th|Brisbane|278.1
\18th|Essendon|277.8

Table 3: Turnovers Caused per game
Rank | Team | T/O caused (avg)
\1st|CAR|77.6
\ 2nd | ADE | 77.4
\3rd|RIC|74.4
\4th|MEL|73.8
\ 5th | SYD | 72.7
\6th|PTA|72.5
\7th|STK|72.1
\8th|COL|68.4
\9th|WCE|68.2
\10th|GEE|68.2
\11th|ESS|68.2
\12th|WBD|67.4
\13th|HAW|67.2
\14th|NTH|66.1
\15th|FRE|65.5
\16th|GWS|64.5
\17th|GCS|64.0
\18th|BRL|63.4

Table 4: Goals scored from turnovers caused per game
Rank | Team | Opp TO6
\ 1st | ADE | 9.8
\2nd|ESS|9.1
\ 3rd | SYD | 8.6
\4th|NTH|8.1
\5th|MEL|8.0
\6th|GEE|7.8
\7th|COL|7.8
\8th|HAW|7.7
\9th|GWS|7.4
\10th|STK|7.0
\11th|BRL|7.0
\12th|PTA|6.8
\13th|RIC|6.6
\14th|WCE|6.5
\15th|WBD|6.4
\16th|GCS|6.4
\17th|CAR|6.3
\18th|FRE|5.8

Swans: Emasculating teams all over the ground
Contrary to what some media pundits have been spouting in recent weeks, the Swans have conceded the least inside 50s in the comp. This is a stark contrast to the trend in the Longmire era, particularly in 2012, when the Swans would employ the "rope-a-dope" strategy of conceding many inside 50s, backing their defenders to win the defensive contests and hitting the teams on the transition.

The Swans now don't give an inch all over the ground. In addition to the lowest inside 50s conceded, the Swans also rank top in marks inside 50 conceded, metres conceded and 3rd highest in disposals conceded

Table 5: Inside 50s conceded per game
Rank | Team | Opp I50 (avg)
\ 1st | SYD | 47.5
\2nd|COL|48.8
\3rd|WBD|49.4
\4th|HAW|49.6
\5th|RIC|49.6
\6th|PTA|50.2
\ 7th | ADE | 50.4
\8th|GEE|50.9
\9th|MEL|51.3
\10th|CAR|52.1
\11th|GWS|52.3
\12th|STK|52.8
\13th|FRE|53.3
\14th|WCE|53.6
\15th|ESS|54.0
\16th|NTH|54.0
\17th|GCS|55.4
\18th|BRL|60.6

Table 6: Marks inside 50 conceded (avg)
Rank | Team | M I50 conceded (avg)
\ 1st | SYD | 8.1
\2nd|PTA|8.6
\ 3rd | ADE | 9.6
\4th|GEE|10.1
\5th|GWS|10.7
\6th|HAW|11.1
\7th|RIC|11.1
\8th|MEL|11.6
\9th|WCE|11.7
\10th|CAR|12.1
\11th|WBD|12.6
\12th|FRE|12.8
\13th|COL|12.9
\14th|STK|13.6
\15th|NTH|14.2
\16th|GCS|14.4
\17th|ESS|14.5
\18th|BRL|16.8

Table 7: Metres conceded per game
Rank | Team | Metres conceded (avg)
\ 1st | SYD | 4987.1
\2nd|HAW|5172.1
\3rd|CAR|5382.6
\4th|GEE|5384.2
\5th|COL|5391.5
\6th|STK|5458.2
\7th|GWS|5470.3
\8th|RIC|5518.1
\9th|MEL|5541.8
\ 10th | ADE | 5545.6
\11th|ESS|5567.2
\12th|WBD|5577.0
\13th|FRE|5637.6
\14th|NTH|5653.6
\15th|GCS|5660.0
\16th|WCE|5723.2
\17th|BRL|5733.1
\18th|PTA|5739.6

Table 8: Disposals conceded per game
Rank | Team | Opp Disp (avg)
\1st|GEE|356.9
\2nd|GWS|368.5
\ 3rd | SYD | 369.6
\4th|CAR|374.1
\5th|COL|374.2
\6th|ESS|374.5
\7th|RIC|378.0
\8th|WBD|379.9
\9th|BRL|381.3
\ 10th | ADE | 382.6
\11th|MEL|383.6
\12th|HAW|385.3
\13th|PTA|386.7
\14th|STK|389.3
\15th|GCS|390.6
\16th|WCE|397.1
\17th|FRE|399.1
\18th|NTH|399.4
 

Remove this Banner Ad

Mega Thread The Stats Thread

🥰 Love BigFooty? Join now for free.

Back
Top