
Teams that do well one year tend to do well the following year, right?
To check this, we can plot a team’s record in one year against their record in the previous year, as measured by the percentage of games won. If there’s a positive relationship between a team’s record in one season and their record the previous season, we’d expect to find an upward sloping trend line. If a team’s record in one year isn’t related to their record in the previous year, we’d see a flat line. If teams that were good last year tend to be bad this year (and vice versa), we’d expect to see a downward sloping line.
Let’s have a look at the data. Each point in this chart corresponds to a particular team in a particular season, like Hawthorn 2016 or Collingwood 1945.
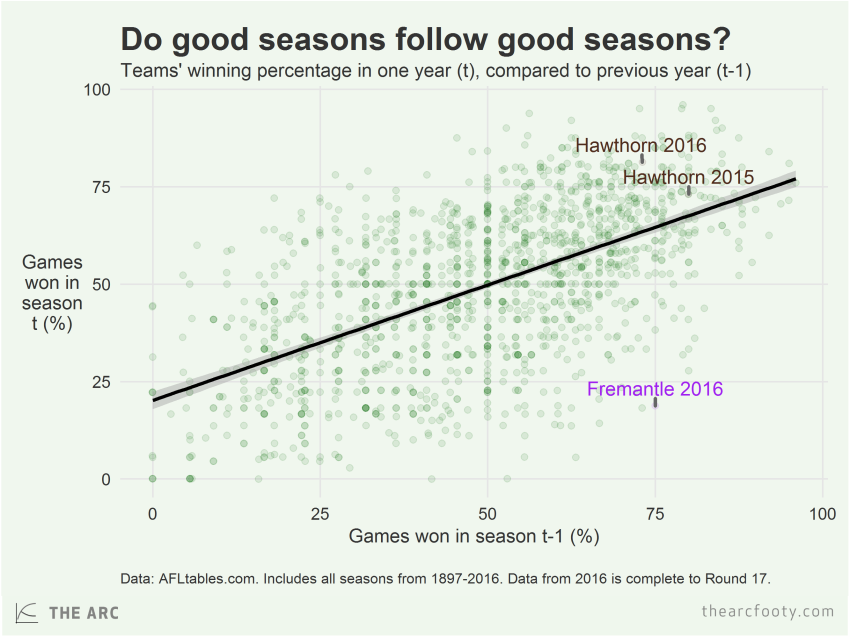
Sure enough, the trend line slopes upwards. Teams that won a lot of games last year (call it year t-1) tend to win a lot of games this year (t). The line in the chart above has a slope of 0.59; this means that an extra percentage point in win percentage in year t is associated with an increase of 0.59 percentage points of win percentage in year t+1. The relationship between teams’ records one year and the previous year is quite strong. [1]
On average, if a team won 75% of their games in one year, we’d expect them to win 64.6% of their games in the following year. If a team won 25% of their games one year, we’d expect them to win 35% the following year. Good teams tend to stay good, but they regress a little. Bad teams stay bad, but they usually improve a little. So far, so thoroughly unsurprising. We don’t need to do any kind of fancy statistical analysis to tell us that.
What about close games? If teams tend to win a large percentage of their close games in one year, should we expect them to carry over this trait to the following year? You can imagine reasons why the tendency to win close games might persist year to year. Teams might have a winning culture, or experienced players who know what to do in the tense final minutes of a close match, or they might have superior endurance that lets them run out the game better than their opponents.
But it turns out that this trait doesn’t seem to carry over from year to year at all. A team’s ability to win close games in one year has no relationship to its ability to win close games the following year. Here’s a version of the plot above, but this time just looking at close games, which we’ll define as those decided by 12 points or less. [2]
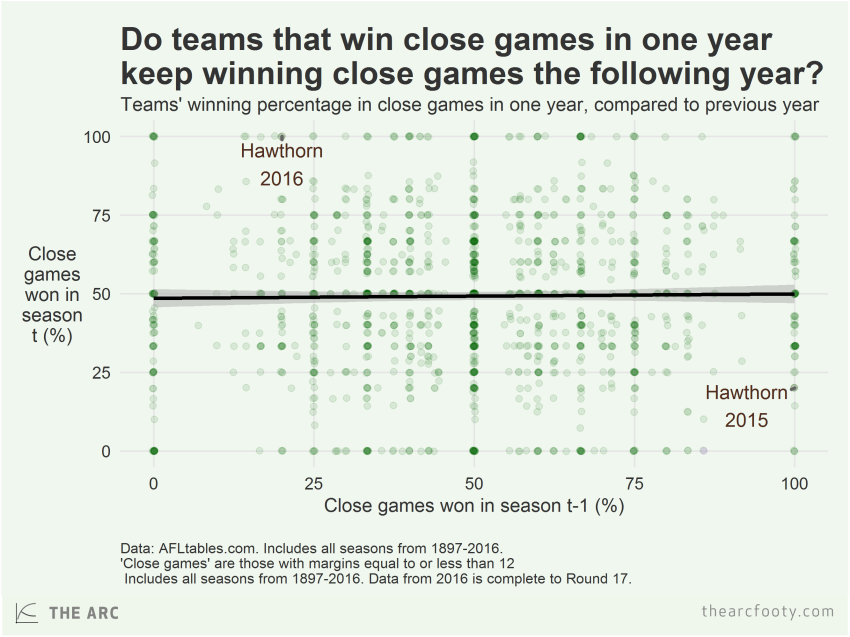
This time, we have an almost perfectly flat trend line, with a slope of .01. Statistically, this is indistinguishable from a slope of zero, a purely flat line. In other words, knowing how good a team was at winning close games in one year provides no guide at all to how good they’ll be at winning close games the following year. The ability to win close games is a trait that does not persist in clubs from year to year.
This is not a surprising result if you’ve followed statistical analyses of AFL (see here, here, and here) and many other sports. Close games tend to be pretty much a coin toss. Winning a close game doesn’t tell us much about how likely a team is to win future games.
This consensus among statistically-minded types does not seem to have persuaded everyone. A recent piece in the Guardian argued that the Hawks’ success so far in 2016 demonstrates the limits of statistical analysis, showing the important of culture over quantifiable attributes. I don’t for a second doubt that football clubs have internal cultures, that these cultures can influence on-field success, and that this is difficult to quantify. Any sport is difficult, probably impossible, to fully capture in statistical measures, and AFL is more difficult than most. But should we really dismiss statistical analysis on the basis of the Hawks’ performance so far this year?
The Hawks’ record in 2016 is largely the result of winning a lot of close games. We’ve demonstrated that clubs’ ability to win close games doesn’t persist year to year. This is true for the Hawks as well – in 2015, they won only 1 out of 5 close games, whereas this year so far they’ve won 5 out of 5. If winning a lot of close games tells us something meaningful about a club’s culture, as the Guardian piece seemed to imply, why did the Hawks only win 20% of their close games last year?
The chart below shows Hawthorn’s winning percentage in close games in every season since the club’s creation. As we’d expect, given the previous chart, the Hawks’ ability to win close games jumps all over the place.
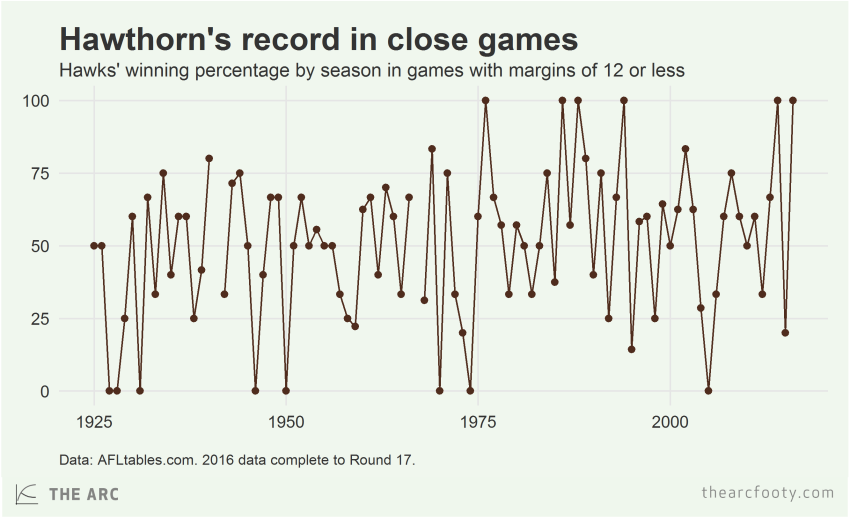
The fact that the Hawks have managed to win a lot of close games this year is unlikely to tell us much about whether they’re going to keep winning close games in the future. I don’t think it tells us much about the club’s culture either, unless you think culture is something that resets year to year.
NOTE: The charts in this post have been updated, due to an error in an earlier version. The error was relatively minor and did not affect the conclusions in the piece. Thanks to Damian Rutledge for spotting it.
[1] In the first chart, the standard error on the slope coefficient is 0.02, the p-value is crazy small, R2 is 0.349.
[2] The conclusions here aren’t sensitive to the choice of threshold to define ‘close games’. The chart looks much the same if we use 6 or 10 points as the threshold – the slope is flat and statistically insignificant.
Read more from The Arc at www.thearcfooty.com.


