Not surprisingly as we approach the silly season (draft day) there's lots of chatter about our previous drafting success (or otherwise). Thought I'd share some actual data to help inform the debate - hopefully posters find it useful (and apologies in advance for any readability issues - was a challenge to fit the info into a consumable format).
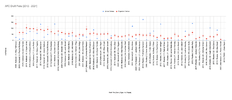
The chart below shows all 59 draft selections (i.e. NOT including trades) that we made in the period 2012-2021. The way to interpret the chart is as follows:

The chart below shows all 59 draft selections (i.e. NOT including trades) that we made in the period 2012-2021. The way to interpret the chart is as follows:
- the picks are ordered from left to right by 'type of draft' (National --> Pre-Season --> Rookie --> Mid-Season) and then by 'pick number' (i.e. pick 2 before pick 15). So the draft selection shown is Riley Thilthorpe as he is our highest selection in the National Draft in that period.
- then for each selection the chart shows a red box for the 'expected number of games' (along with red error bars showing a range +/- 25%). This expected number of games metric (in fact all data) is sourced from the legend at DraftGuru and is based on historical AFL records going back over 38 years of drafts!! - it's an awesome resource so check it out). As you'd imagine as you follow the red boxes from left to right the expected number of games generally goes down (although there are some anomalies - check out pick #6 in ND which historically has had a very low average number of games)
- then for each selection the chart shows a blue triangle for how many games that selected player has actually played to date...if it falls above the red box (i.e. Actual Games ? Expected Games) then that selection has 'outperformed'; conversely if the blue triangle is below the red box the latter applies (with caveats per below).
- a few caveats on using 'Expected Games' as a measuring stick:
- per above there's historical anomalies in some picks (e.g. pick 6) and so we should reasonably expect more than sixty-odd games from pick 6 even though that's it's historical average.
- the EG averages are deflated (i.e. lower than they otherwise would be) as they are based on [EDIT: datasets that include...] 'live' player careers that aren't completed (i.e. the EG average for pick #2 is 138 games and includes Sam Darcy, RT, Noah Anderson, et al who are still early in their careers). If I had a lot more time I would have tried to filter for 'completed careers' and the true average would be higher...but I don't!PLAYERCARDSTART15Noah Anderson
- Age
- 23
- Ht
- 192cm
- Wt
- 88kg
- Pos.
- Mid
CareerSeasonLast 5- D
- 12.0
- 3star
- K
- 6.0
- 2star
- HB
- 6.0
- 4star
- M
- 2.0
- 2star
- T
- 0.0
- 1star
- CL
- 0.0
- 1star
- D
- 12.0
- 3star
- K
- 6.0
- 2star
- HB
- 6.0
- 3star
- M
- 2.0
- 2star
- T
- 0.0
- 1star
- CL
- 0.0
- 1star
- D
- 12.0
- 3star
- K
- 6.0
- 3star
- HB
- 6.0
- 4star
- M
- 2.0
- 3star
- T
- 0.0
- 1star
- CL
- 0.0
- 1star
PLAYERCARDEND - Similarly the AG numbers in many cases are for live careers and so in these cases you're less analysing 'is this draft selection less than expected now but rather will it end up above expectations'
- the lower down the pick numbers you go and especially into the PS, Rookie and MS drafts then there is not a 'statistically significant' number of previous draft selections on which to reliably draw an average (i.e. the average # of games played by ND pick 119 is 122!?). This is where the Draft Points Index is perhaps a fairer measure of the value of a pick.
- all of these indicators are based on quantity of games played - the data says nothing about the quality of games played.

Last edited:


