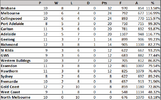
I do this after the H&A every year and it usually throws up a couple of interesting points. 2022 for reference.
It can be useful as a finals win predictor but like all models, it's pretty blunt and best used with your own judgment - it doesn't account for injuries or home vs away, for example. For reference, in 2022 the best performed sides were the Swans and Geelong and the model would've tipped 5/9 finals, missing the Grand Final as the Swans were above Geelong on percentage.
Here we are for 2023:
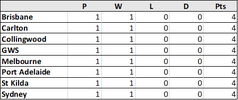
Top 8 vs Top 8

(Note that because of the different amount of games played, it's ranked first on points, then on fewer games played then percentage.)
So following the ladder positions here would tip as follows:
Week 1
Brisbane defeats Port Adelaide
Melbourne defeats Collingwood (though this is a coin toss)
St Kilda defeats GWS
Carlton defeats Sydney
Week 2
Port Adelaide defeats St Kilda
Collingwood defeats Carlton
Week 3
Brisbane defeats Collingwood
Melbourne defeats Port Adelaide
Grand Final
Brisbane defeats Melbourne
(For those who follow Squiggle, this is almost the same as the forecast, but a bit different from the flagpole, which Mr Squiggle has found to be more accurate.)
All Teams vs Top 8

It can be useful as a finals win predictor but like all models, it's pretty blunt and best used with your own judgment - it doesn't account for injuries or home vs away, for example. For reference, in 2022 the best performed sides were the Swans and Geelong and the model would've tipped 5/9 finals, missing the Grand Final as the Swans were above Geelong on percentage.
Here we are for 2023:
Top 8 vs Top 8

(Note that because of the different amount of games played, it's ranked first on points, then on fewer games played then percentage.)
- It feels like an open season, but Brisbane is pretty clearly out in front here despite Collingwood having spent most of the year on top. The Lions have beaten the Pies twice, though the Pies might argue injuries and/or dead rubber.
- This is the second year in a row that Sydney has only played 8 games against other sides in the 8. In 2022 there were three other sides in the same position, including Geelong, and this year only one. Not sure it's an indicator either way. The Swans doubled up against GWS and Port against Collingwood. For reference, the Swans' 2022 record was 6-2.
- Percentage can be significant. Since 2019, all grand finalists have all come from teams with percentage above 100, except for Richmond in 2019. In 2020, Richmond and Geelong had the outstanding percentages. That doesn't look great for Port, though they'll have a home final in week two (if they lose the QF) or three (if they win the QF), which may make up for a fairly average form line.
So following the ladder positions here would tip as follows:
Week 1
Brisbane defeats Port Adelaide
Melbourne defeats Collingwood (though this is a coin toss)
St Kilda defeats GWS
Carlton defeats Sydney
Week 2
Port Adelaide defeats St Kilda
Collingwood defeats Carlton
Week 3
Brisbane defeats Collingwood
Melbourne defeats Port Adelaide
Grand Final
Brisbane defeats Melbourne
(For those who follow Squiggle, this is almost the same as the forecast, but a bit different from the flagpole, which Mr Squiggle has found to be more accurate.)
All Teams vs Top 8

- Like the real ladder, there's not a lot of difference between 7 and about 13-14.
- This year there are three places different from the real top 8, with Adelaide (ouch), Geelong and Richmond coming for St Kilda, GWS and Sydney. Last year there was only one (Carlton out for the Bulldogs).
- 12 games against teams in the 8 is the equal most we've seen, and it feels unbalanced that some also-ran teams have had 12 while half the finalists have had 8 or 9.
- Adelaide lost five of these 12 by a total 14 points. A little luck here or there and who knows.
- This is the second year in a row that West Coast has only won one game against a finalist and has finished with a percentage below 50.
- Most years there's one team winless, and that's continued. Last year it was GWS, so things can turn quickly.
Last edited:


