Broken
Brownlow Medallist
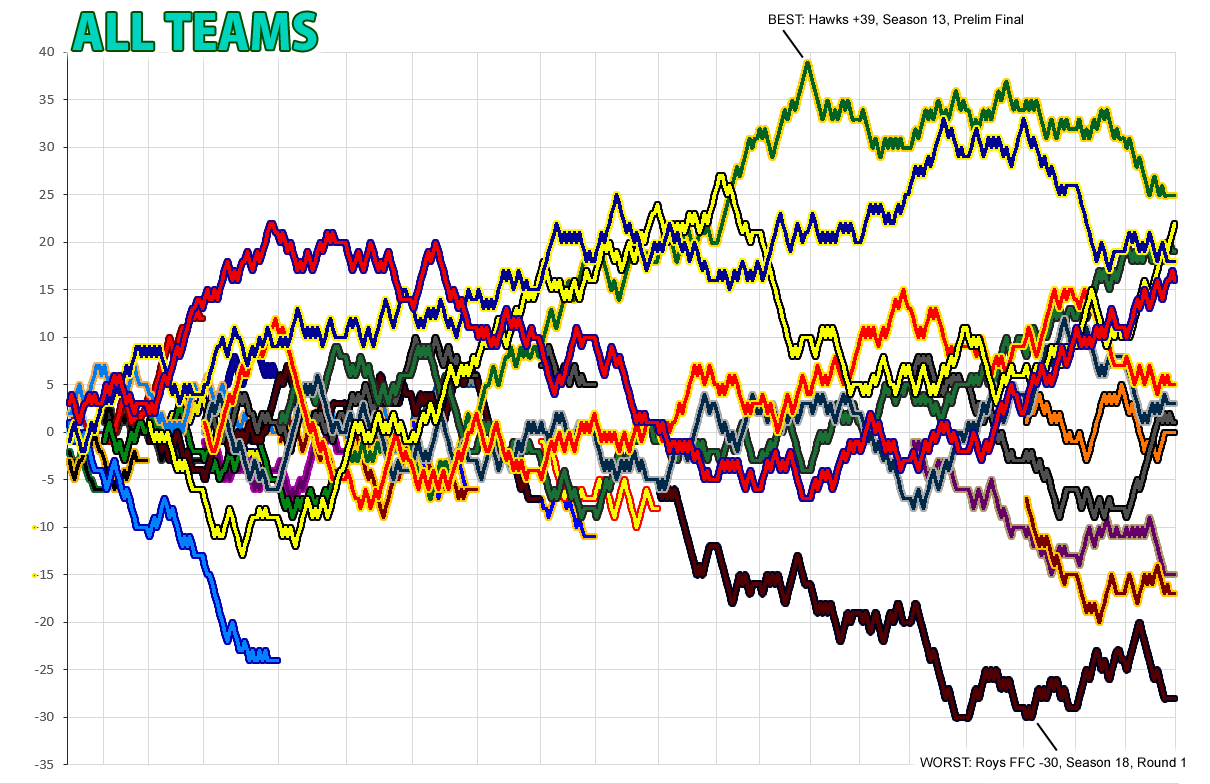
I've been working on this for a few seasons now, the idea of seeing how a team fluctuates in wins and losses through the course of their existence. I was curious to see if there is any method to the belief that some teams are blessed - or cursed - and decided to track each team in the chance that there is someone else who might be interested.
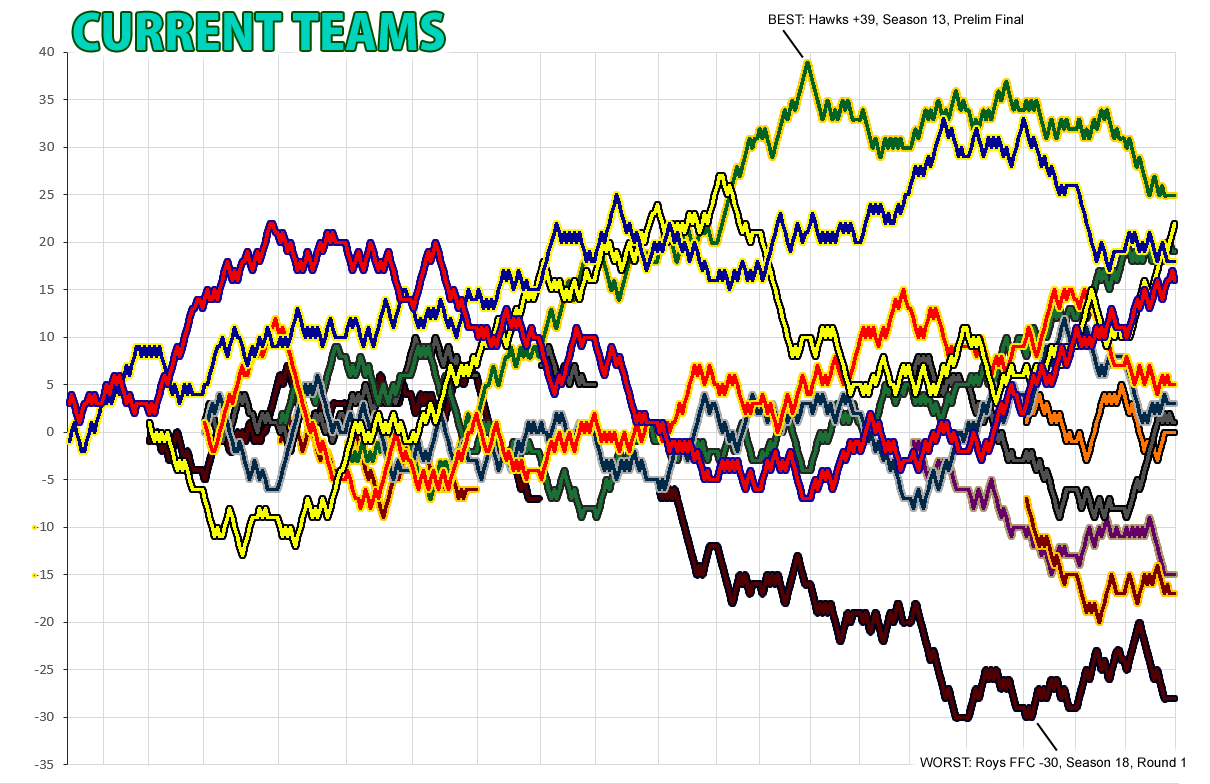
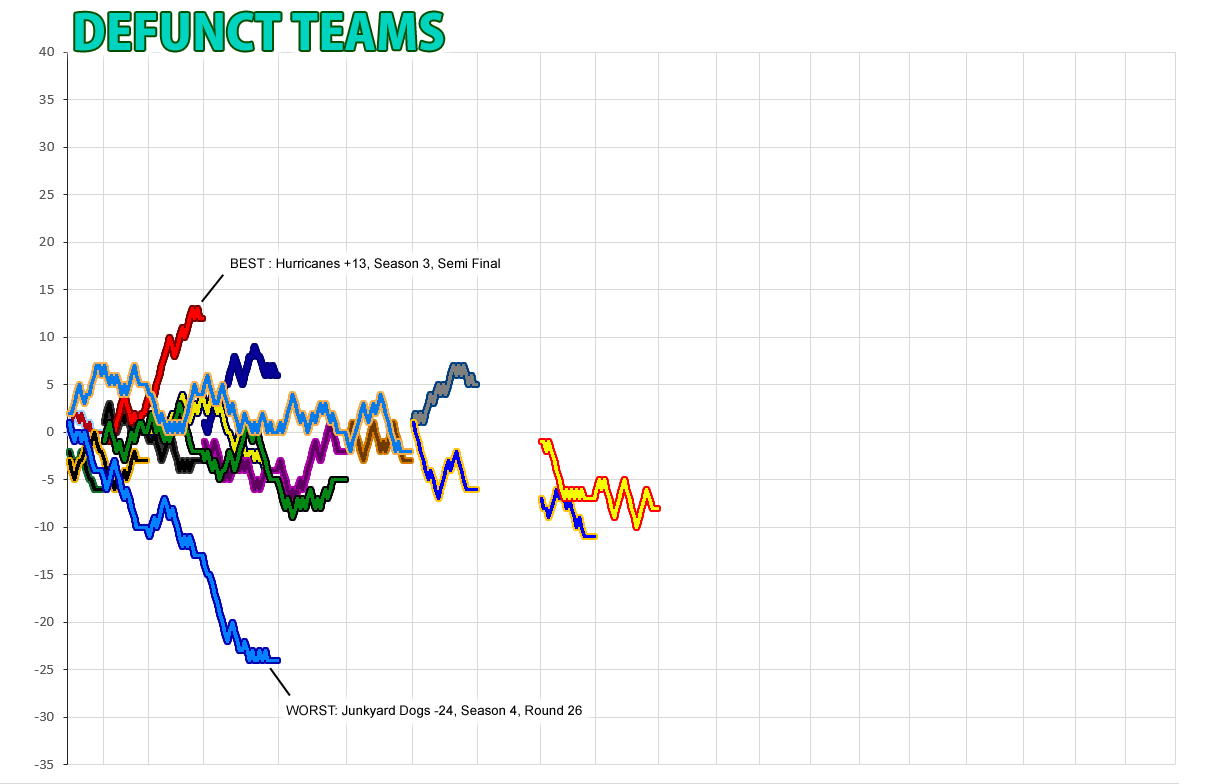
This data will be presented team by team, with the defunct teams appearing first and the current teams following (once the Season 20 Grand Final is decided)
The data will appear on a grid like this:

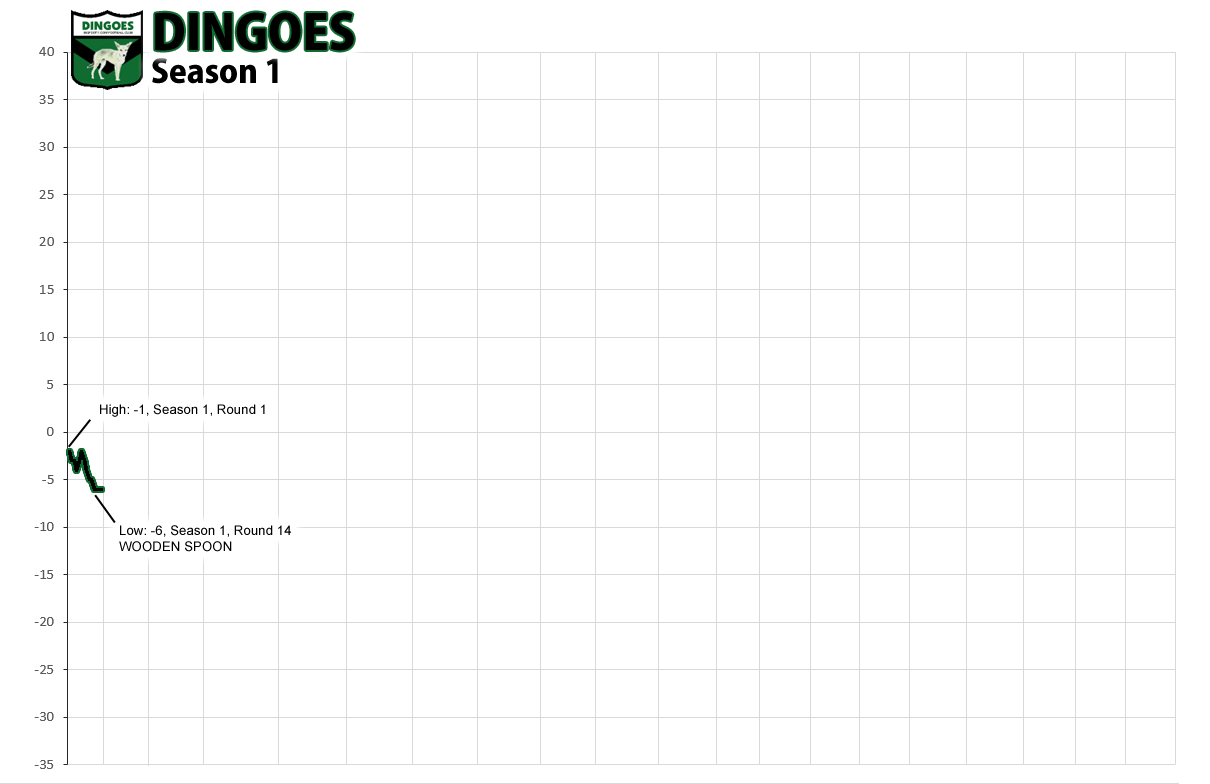
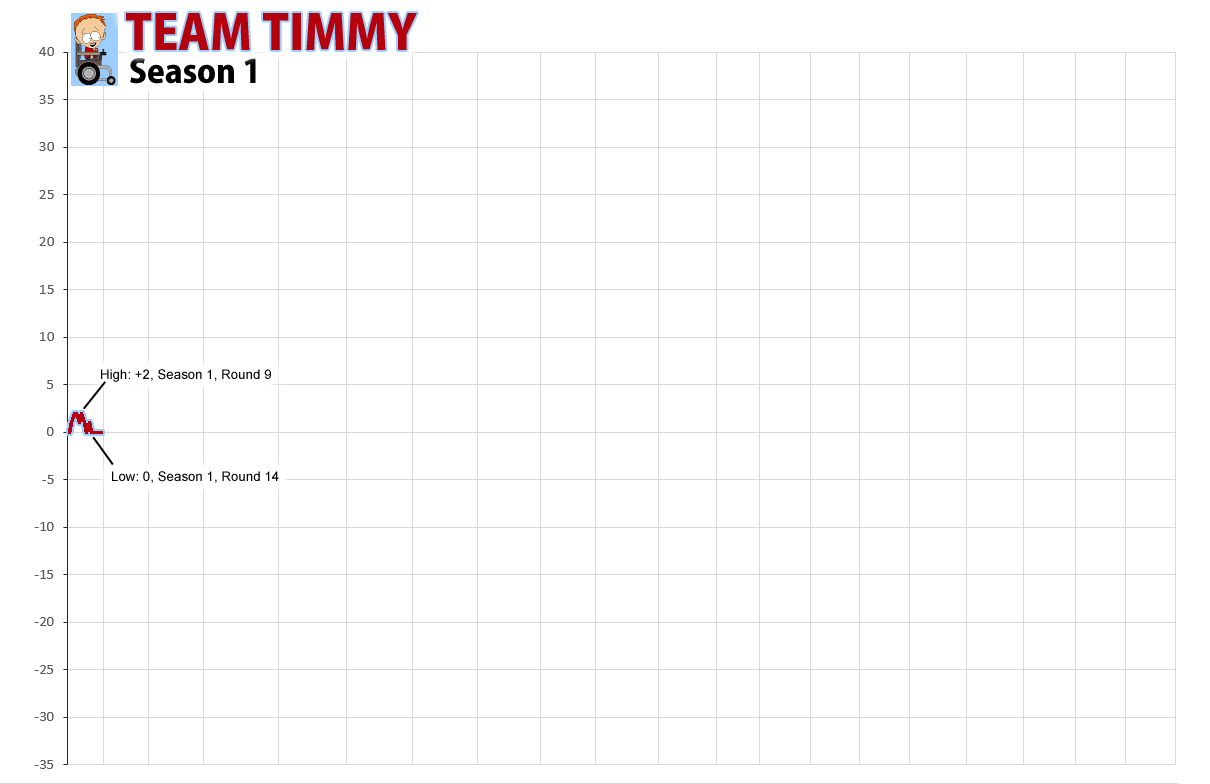
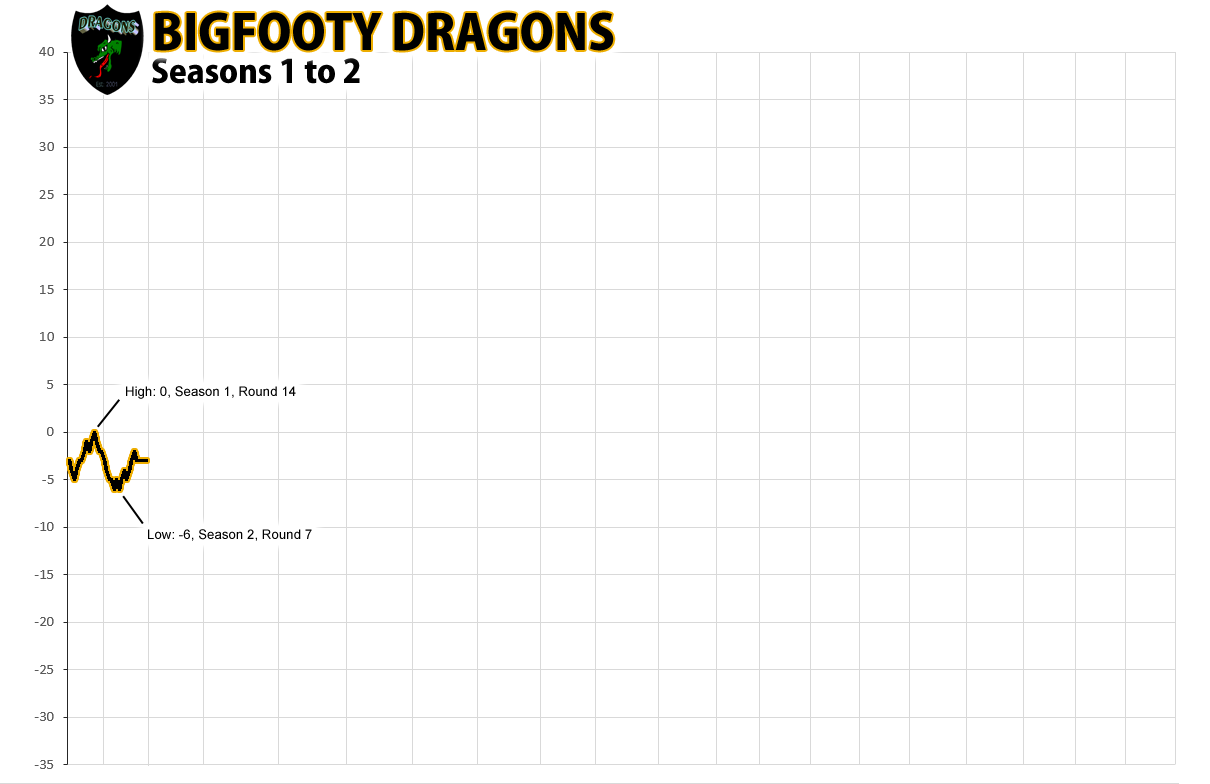
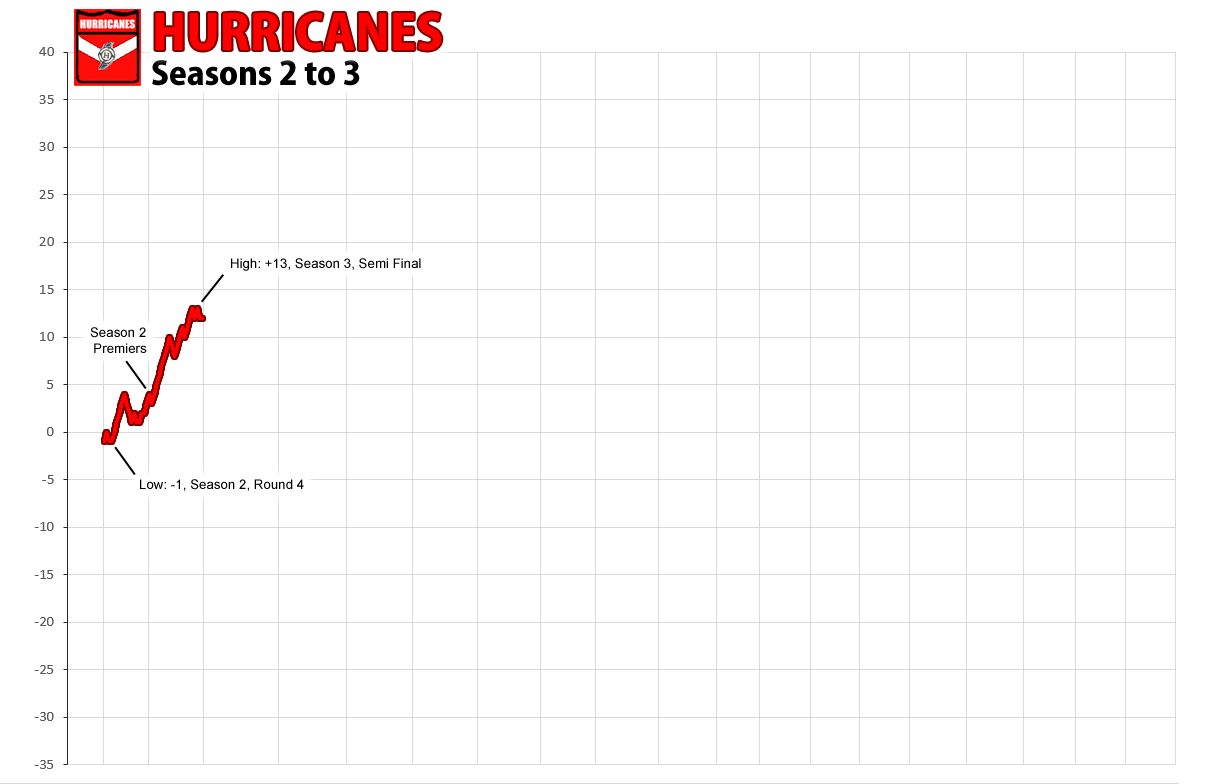
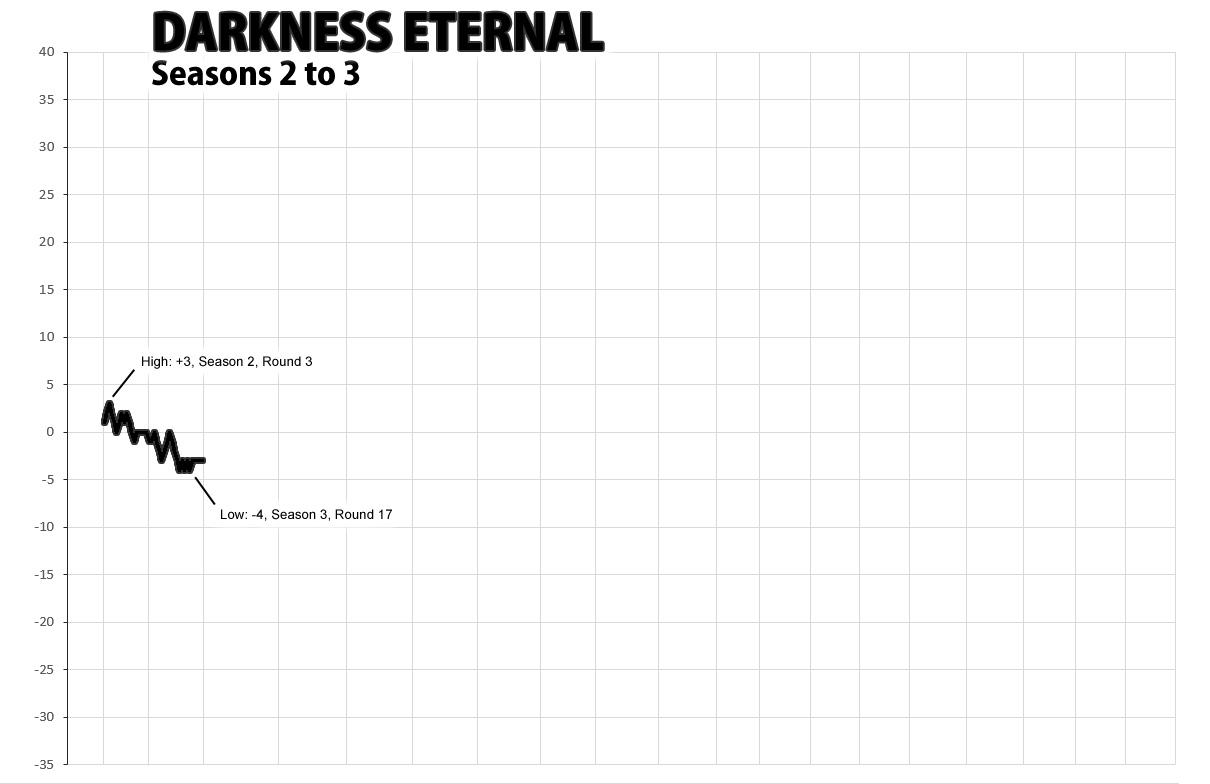
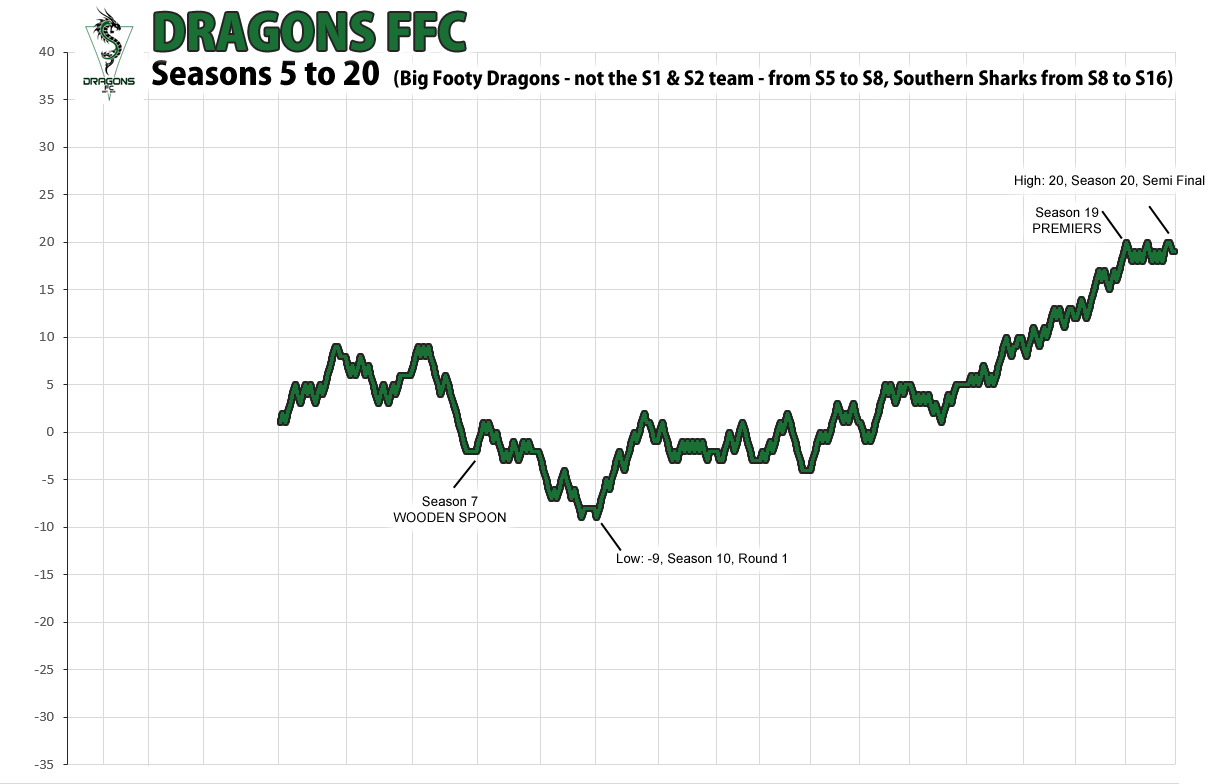
The leftmost axis is a positive/negative value tracking wins and losses. A win is +1, a loss is -1. This means that if a team is +10 at a certain point it means that they have won 10 more games than they had lost at that point in their existence. Each column, seperated by a vertical line, identifies a season in the SweetFA.
I'll offer an explaination of it with the first team which should, hopefully, make it easy to understand for the rest of the teams.
This data will be presented team by team, with the defunct teams appearing first and the current teams following (once the Season 20 Grand Final is decided)
The data will appear on a grid like this:
The leftmost axis is a positive/negative value tracking wins and losses. A win is +1, a loss is -1. This means that if a team is +10 at a certain point it means that they have won 10 more games than they had lost at that point in their existence. Each column, seperated by a vertical line, identifies a season in the SweetFA.
I'll offer an explaination of it with the first team which should, hopefully, make it easy to understand for the rest of the teams.
Order of teams to be displayed
Dingoes
Team Timmy
BigFooty Dragons
Hurricanes
Darkness Eternal
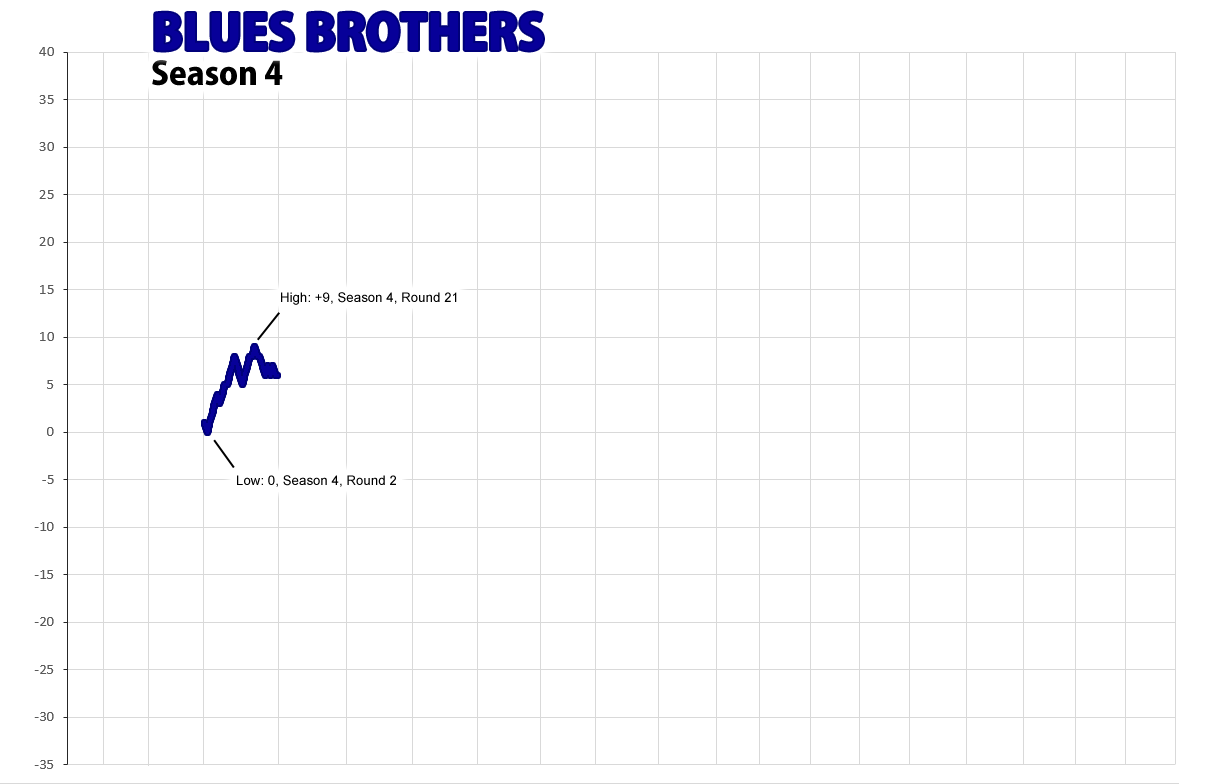
Blues Brothers
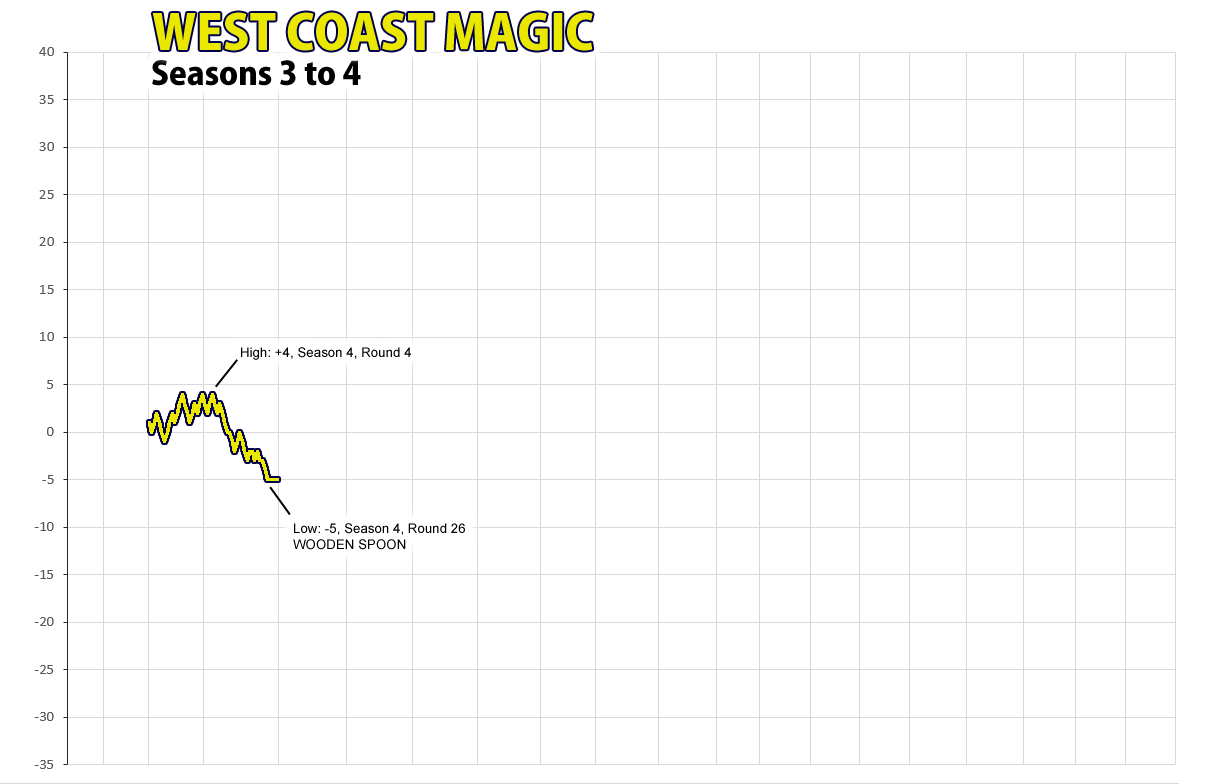
West Coast Magic
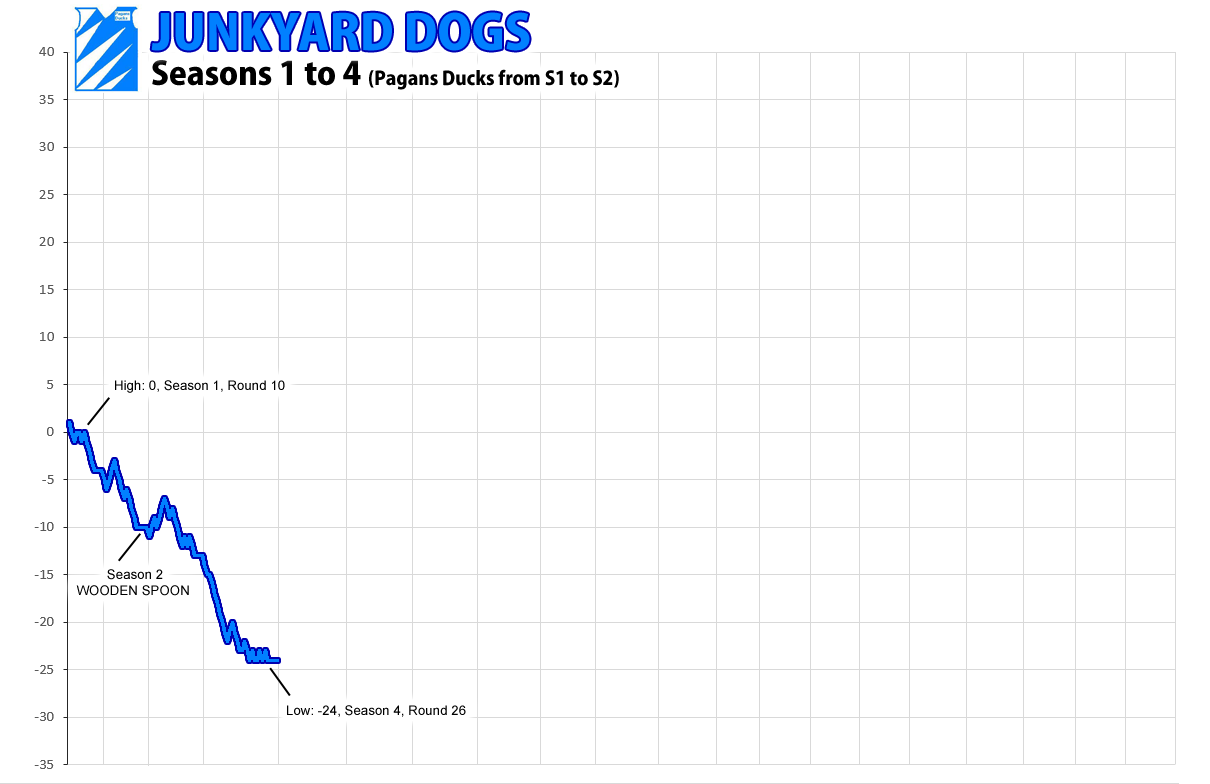
Junkyard Dogs / Pagans Ducks
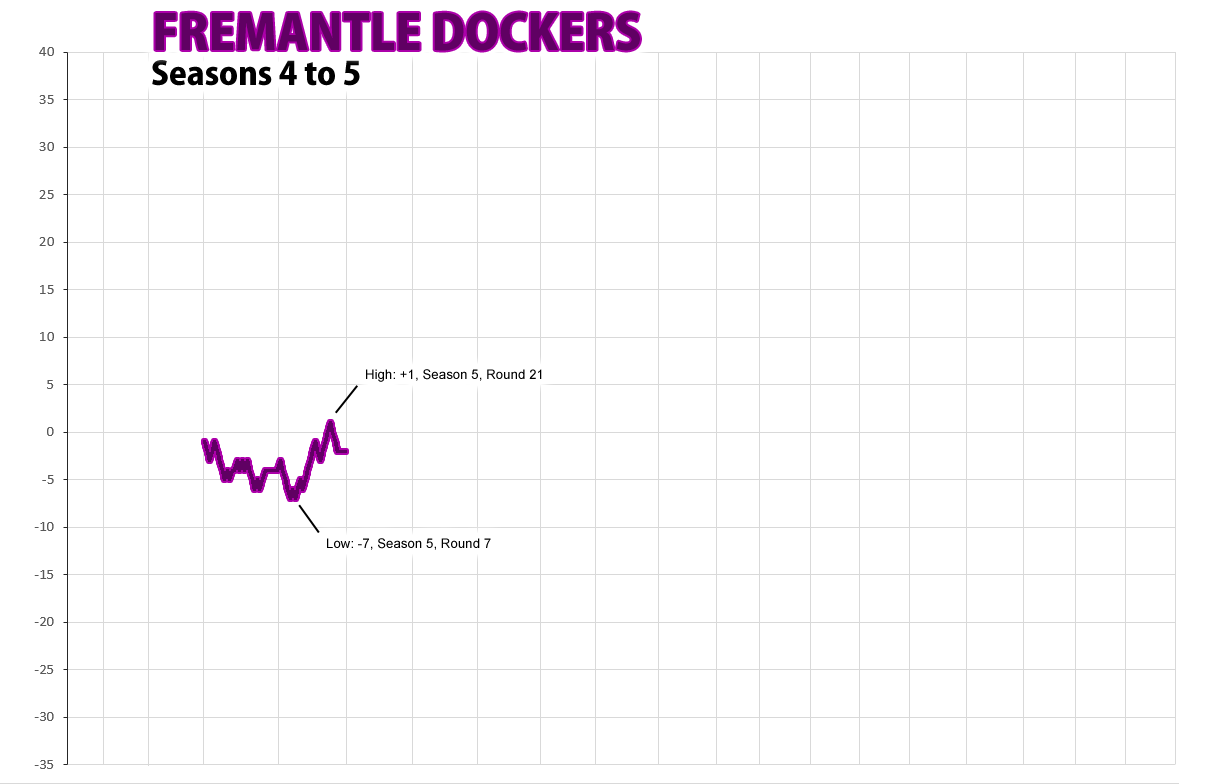
Fremantle Dockers
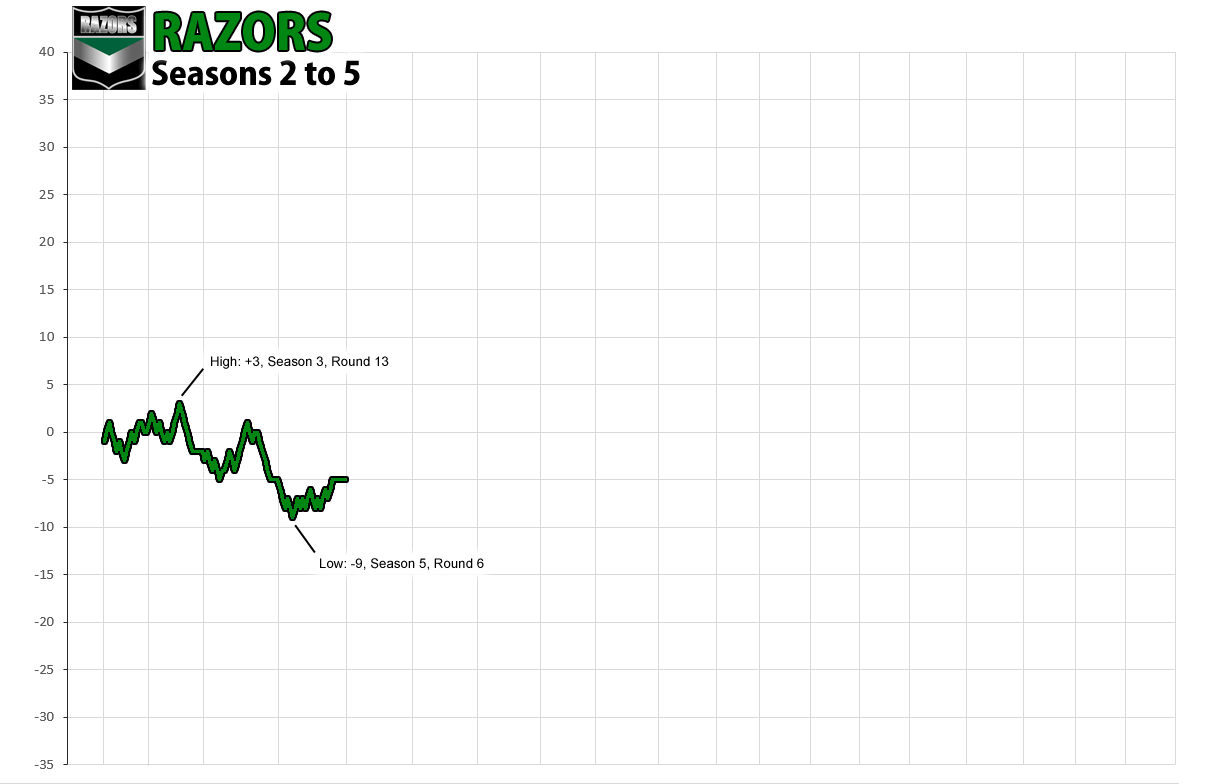
Razors
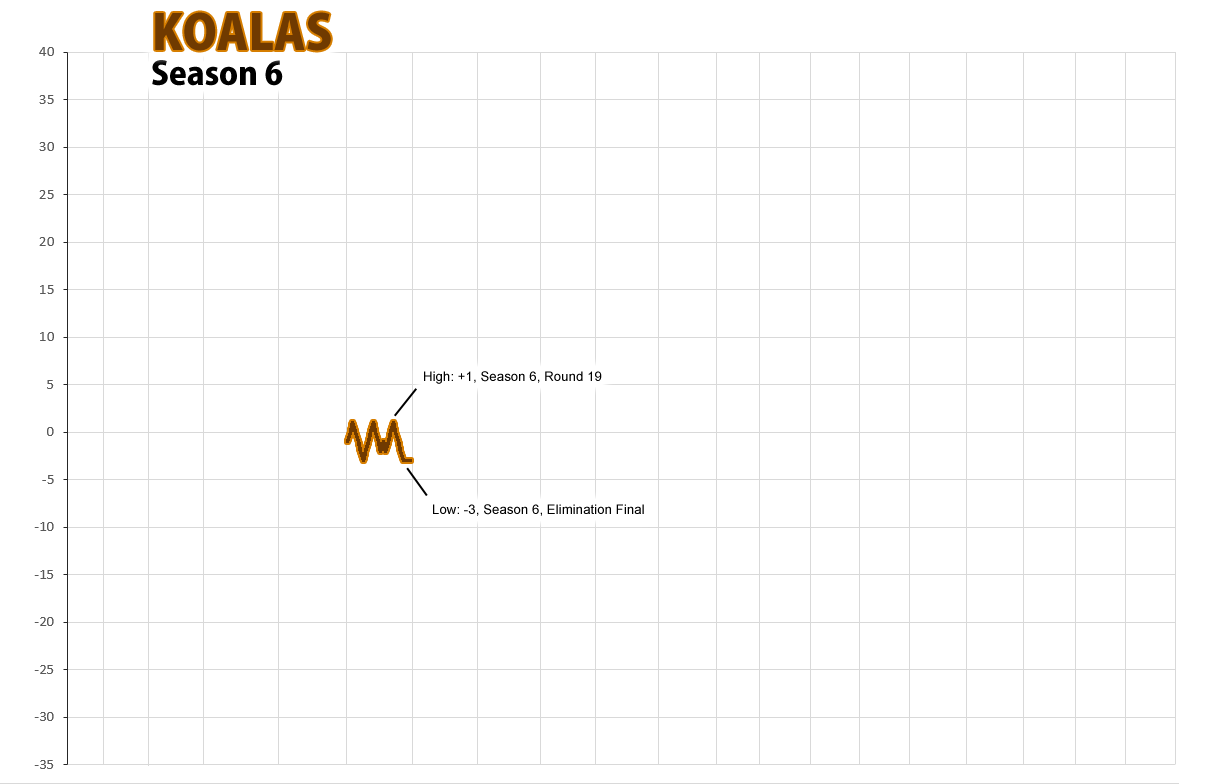
Koalas
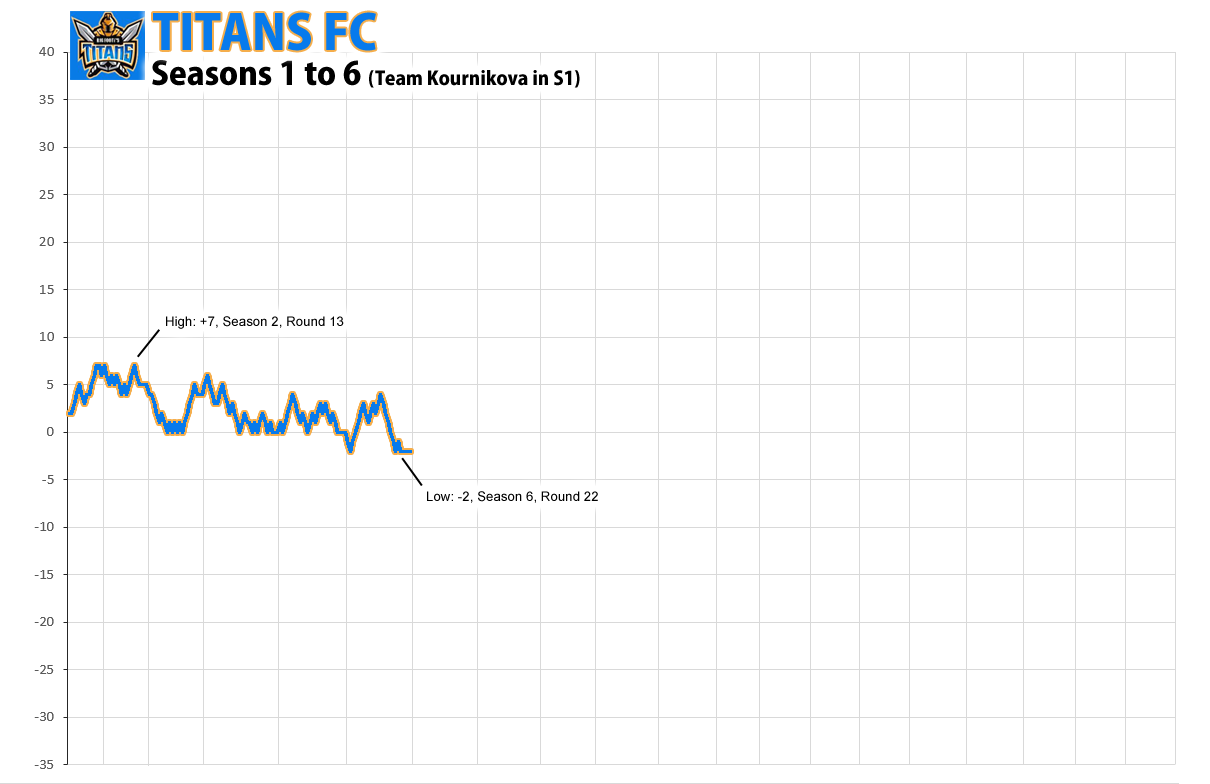
Titans FC / Team Kournikova
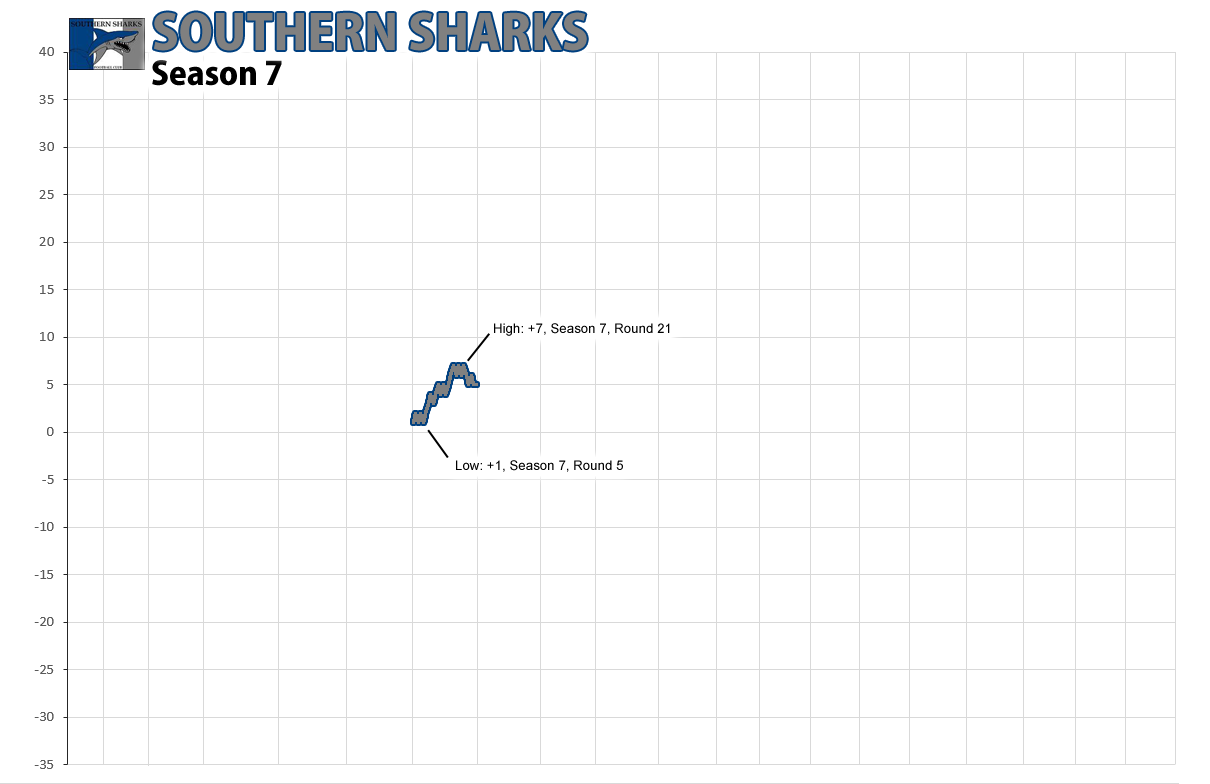
Southern Sharks
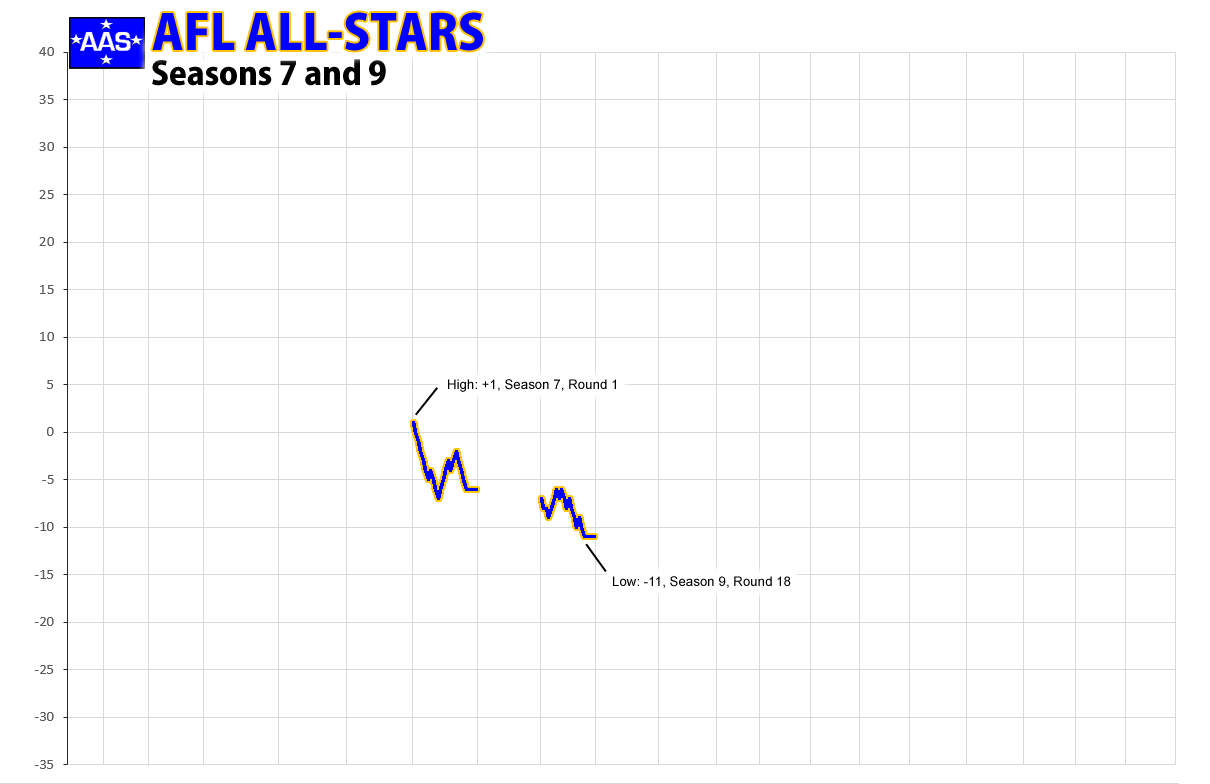
AFL All-Stars
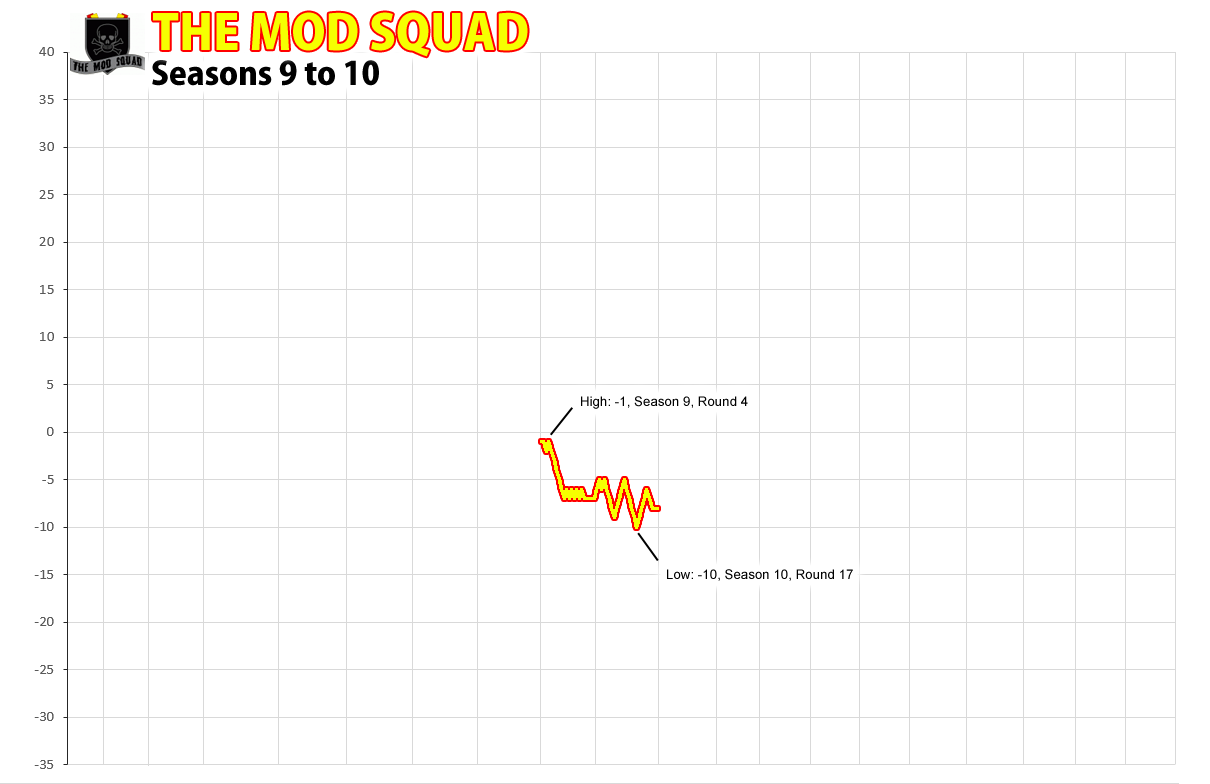
The Mod Squad
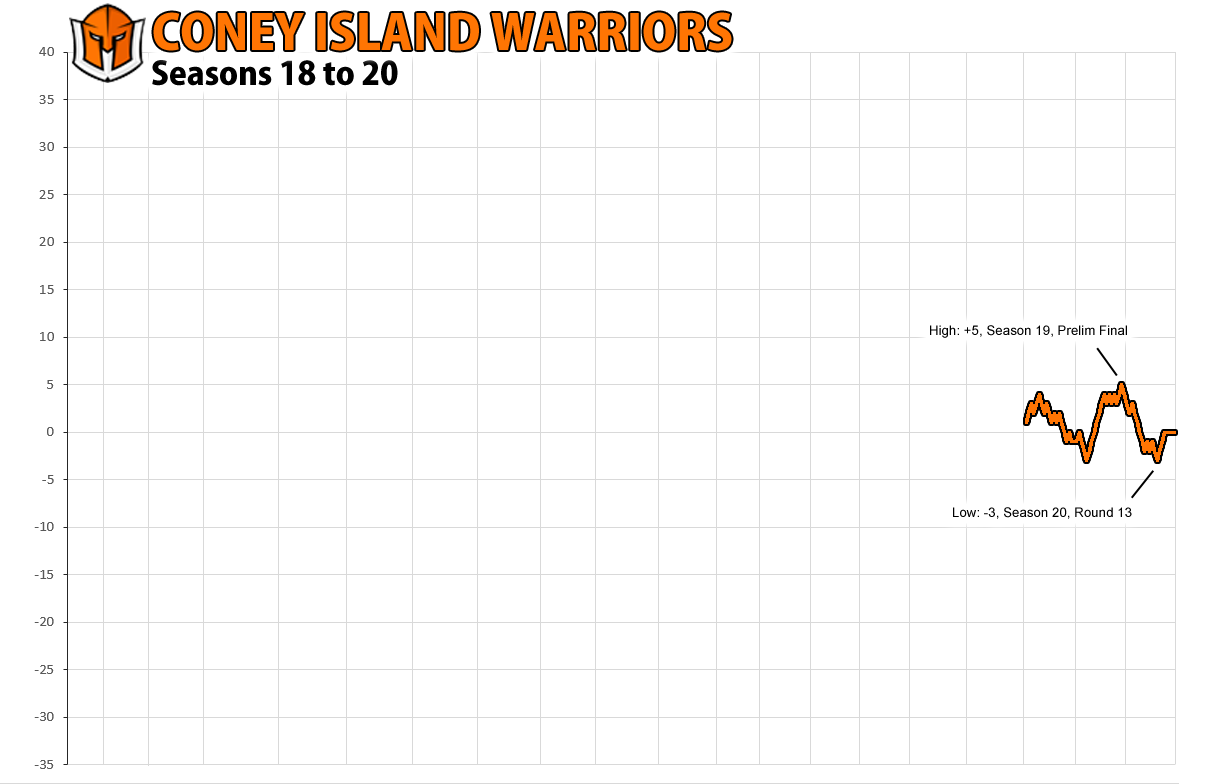
Coney Island Warriors
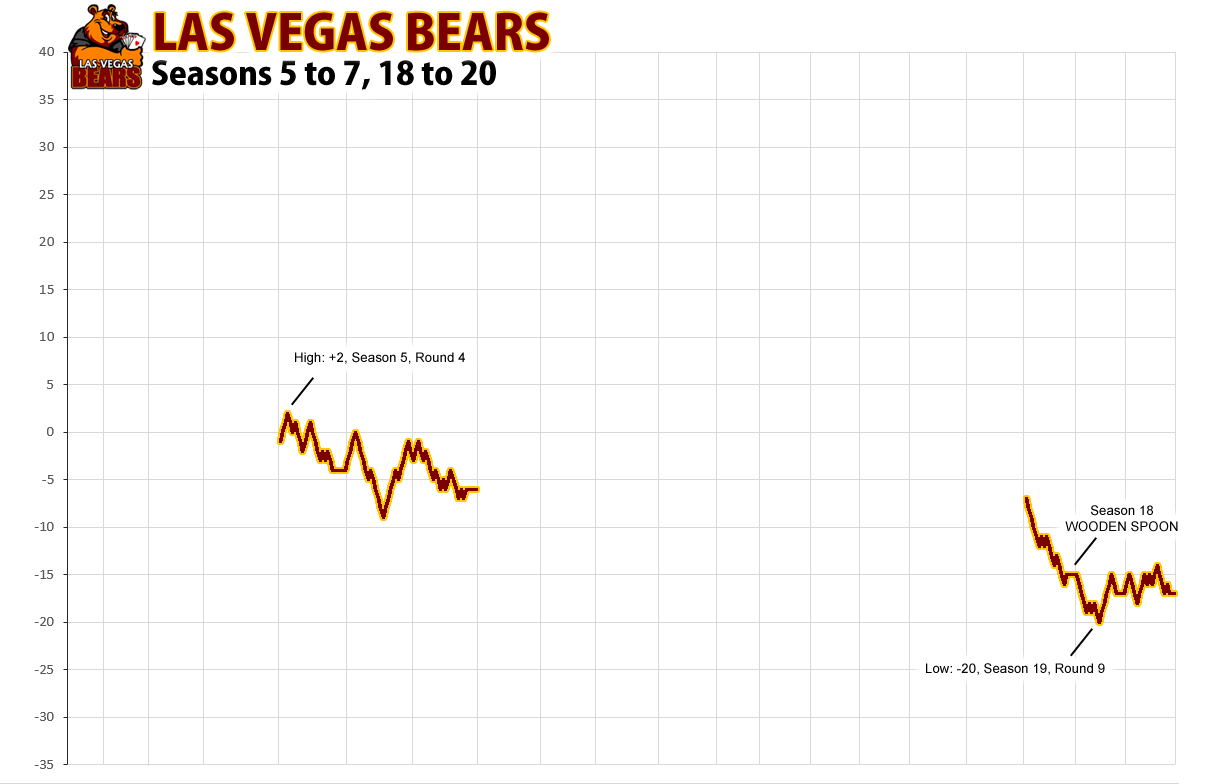
Las Vegas Bears
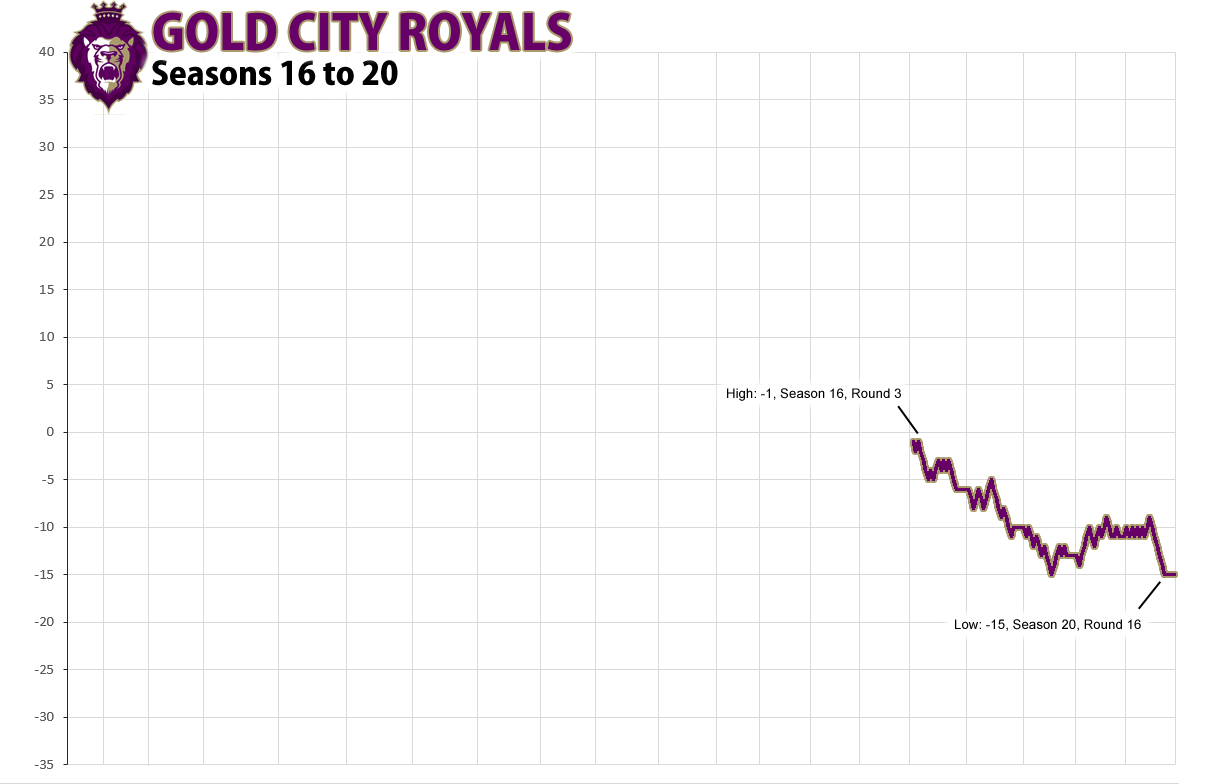
Gold City Royals
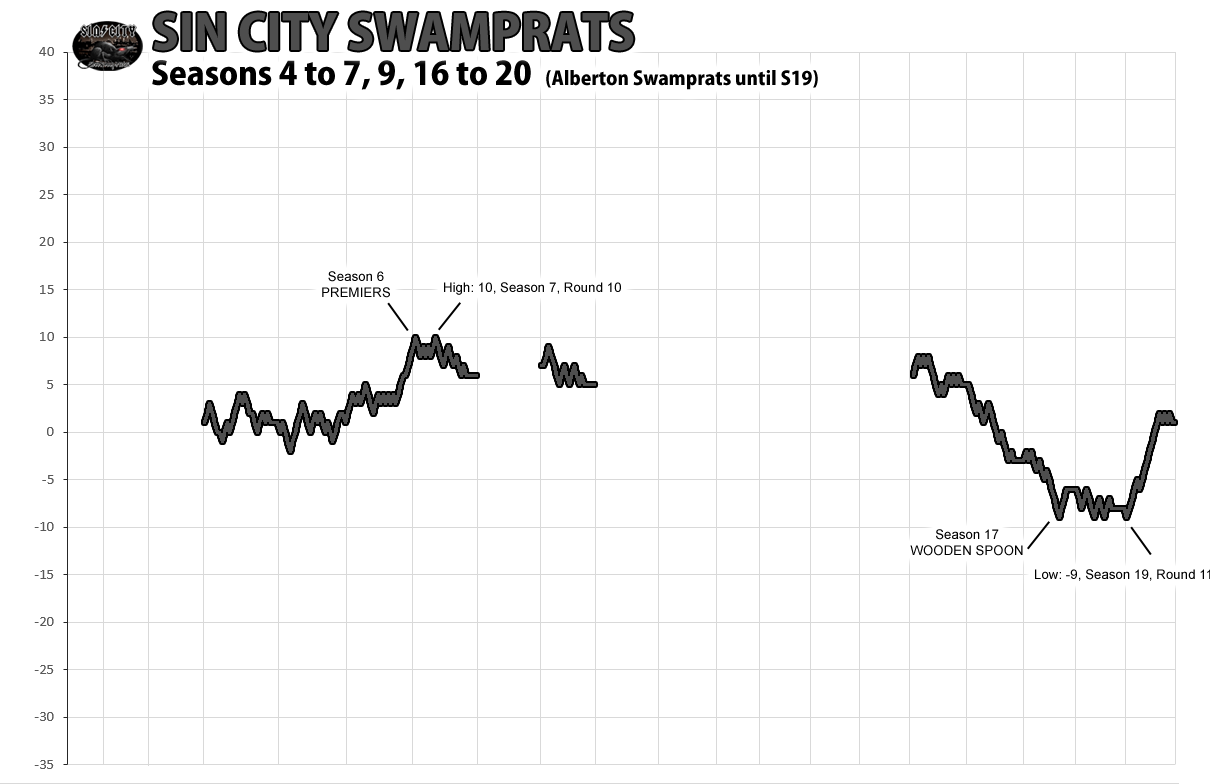
Sin City Swamprats / Alberton Swamprats
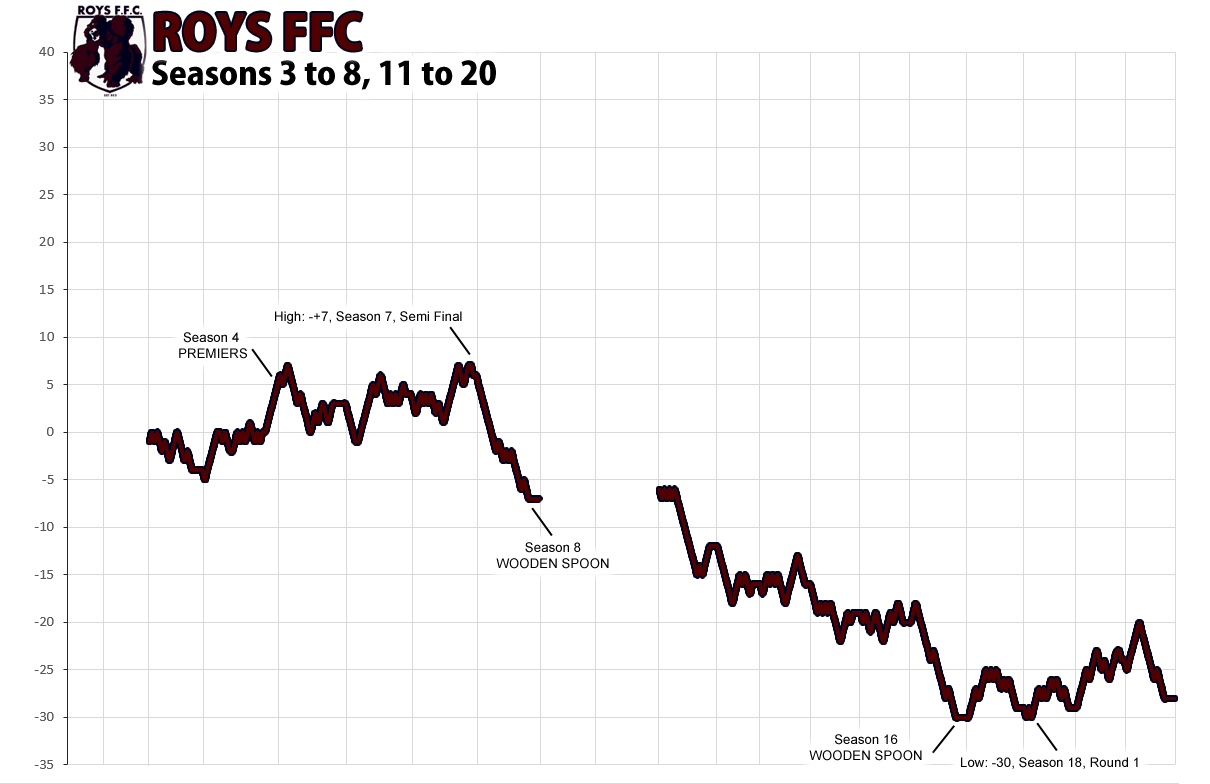
Roys FFC
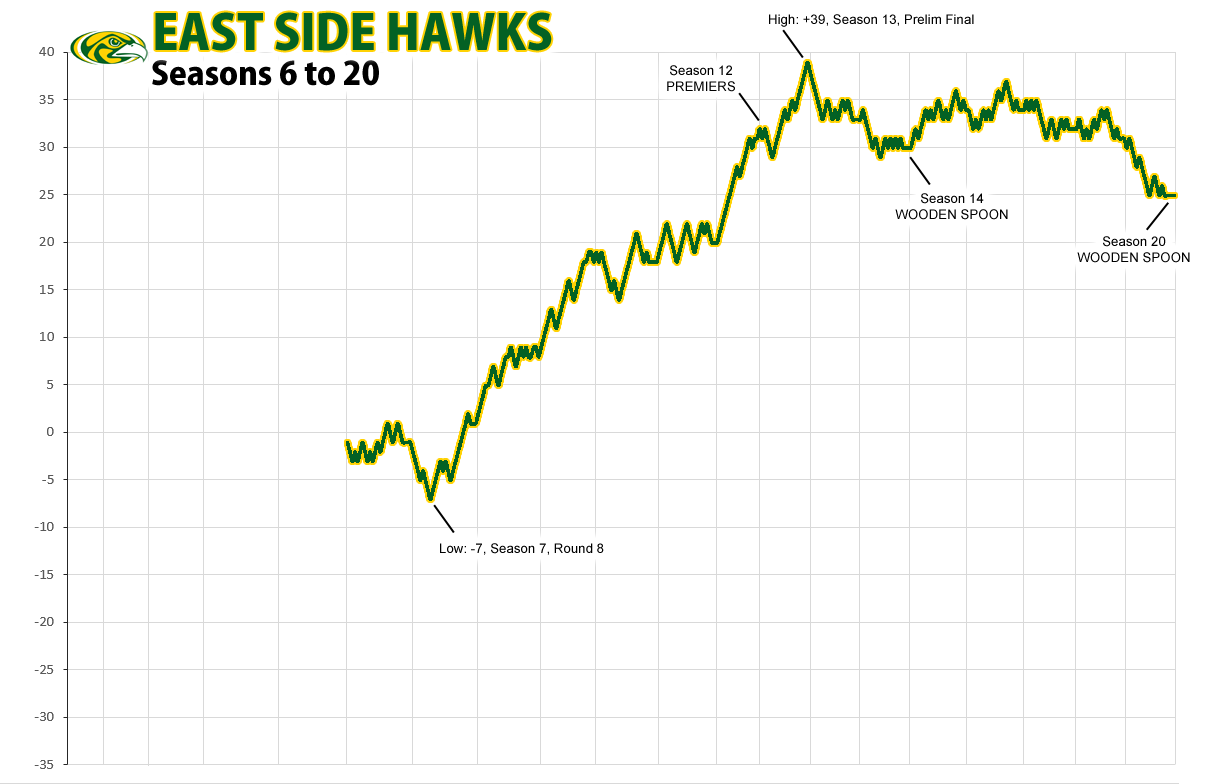
East Side Hawks / Eastside Hawks / East-Side Hawks
Dragons FFC / Southern Dragons / BigFooty Dragons
Geelong Wolves / Geelong Gumbies
Baghdad Bandits / Baghdad Bombers / BigFooty Bombers
Fighting Furies
West Coast Wonders / Seventh Wonders
Mount Buller Demons / Team Pump
Dingoes
Team Timmy
BigFooty Dragons
Hurricanes
Darkness Eternal
Blues Brothers
West Coast Magic
Junkyard Dogs / Pagans Ducks
Fremantle Dockers
Razors
Koalas
Titans FC / Team Kournikova
Southern Sharks
AFL All-Stars
The Mod Squad
Coney Island Warriors
Las Vegas Bears
Gold City Royals
Sin City Swamprats / Alberton Swamprats
Roys FFC
East Side Hawks / Eastside Hawks / East-Side Hawks
Dragons FFC / Southern Dragons / BigFooty Dragons
Geelong Wolves / Geelong Gumbies
Baghdad Bandits / Baghdad Bombers / BigFooty Bombers
Fighting Furies
West Coast Wonders / Seventh Wonders
Mount Buller Demons / Team Pump
Last edited: