cryptor
Brownlow Medallist
- May 11, 2008
- 23,534
- 58,954
- AFL Club
- Hawthorn
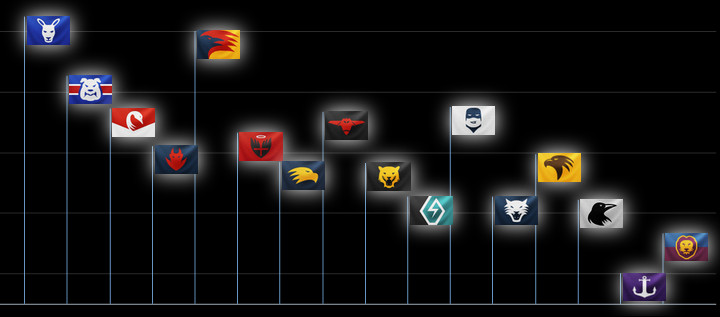
Go drink some paint. I'm obviously referring to the squiggle.Its called the ladder.
Follow along with the video below to see how to install our site as a web app on your home screen.
Note: This feature may not be available in some browsers.
Go drink some paint. I'm obviously referring to the squiggle.Its called the ladder.
boohoo, you asked for a comparative position based on 2015 results only.Go drink some paint. I'm obviously referring to the squiggle.
That's significant, yes, because there's an assumed 12-pt home game advantage to the Lions. So the actual scores of 38-110 are treated as 32-116 in neutral territory. And 32 points is very low.Why is North keeping the worst attacking team to a low score worth so much?
is it just because it's at the Gabba?
I had a look but it's almost identical to now. Some teams (all the ones you'd expect) would be a little worse if we ignore 2014: Hawthorn, Sydney, Freo, Port Adelaide, Essendon. Collingwood would be slightly better. But not enough to change anything.Final Siren how much is last years data effecting the difference in position of Hawthorn and West Coast? I'd be interested to see where each side would be relative to the other just based on this years results if every side started in the same spot.
I hear Tuabams Endure has a more robust, full taste than Duluxboohoo, you asked for a comparative position based on 2015 results only.
Only trying to help. Happy to drink paint, which brand do you recommend? How will this help me answer your question better?

Just looked at the flagpole and yep Port's flag is standing firmer than a honeymooners di**.???? Is this taking into account their strong form late last year?? According to the Regular Season form for the year. North is sitting 5th. Stronger in Attack AND defence.The flagpole clearly indicates how confusing it is to be a Port supporter this year.
Each week I think, ok now we will start playing to our ability, and each week I get frustrated.
Roll the dice, anything could happen against the Saints this week.
Maybe the Port that's third on the flagpole will show up, maybe not.
AFAIK, It's a quirk of sorts in the predictions where Saints aren't actually tipped to win, but they are to go close in a few games, which means there is a good chance of getting 2 wins.Predictor has 2 more wins for the Saints, squinting but still can't see em'. Which games Final Siren ?
I am actually relying on Fremantle to lose to St Kilda so top 2 is West Coast and Hawthorn ahaAFAIK, It's a quirk of sorts in the predictions where Saints aren't actually tipped to win, but they are to go close in a few games, which means there is a good chance of getting 2 wins.
You'll beat Freo though. bunny team.
Infected by a virus called 'Roby' perhaps?I find it quite amusing that the Flag Pole gives Port a better chance of winning the flag than either Freo or the Swans despite the fact that they're unlikely to even make the 8.
Cats eat birds.How is the Squiggle splitting Geelong and Adelaide on the finals predictor? Same win/loss, percentage and a draw head-to-head?
I am actually relying on Fremantle to lose to St Kilda so top 2 is West Coast and Hawthorn aha
I'm still figuring out exactly why the flagpole algorithm seems to be good at what it does (picking premiers). It's only a little different to the regular squiggle but it plays out seasons quite differently.Just looked at the flagpole and yep Port's flag is standing firmer than a honeymooners di**.???? Is this taking into account their strong form late last year?? According to the Regular Season form for the year. North is sitting 5th. Stronger in Attack AND defence.
If it includes Ports strong 2014 (or any part of it) that makes sense and play on. It gives the Power supporters hope.
Great to see North less than a whole point from 3rd. Hopefully big wins against Carlton, St Kilda and Melbourne will see that improve. Then again I was looking forward to seeing the squiggle jump heading into the Suns game. So basically I'll be content to just win them.
Not that the predictor has anywhere near this kind of accuracy, but it's putting Geelong on 103.64% and Adelaide on 103.60%. The numbers are just rounded off for display.How is the Squiggle splitting Geelong and Adelaide on the finals predictor? Same win/loss, percentage and a draw head-to-head?
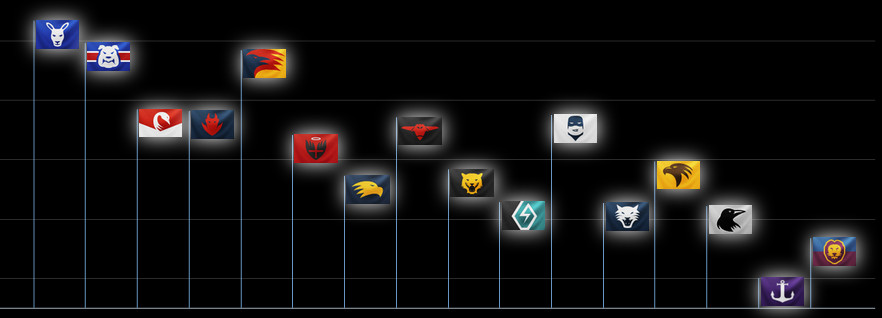
wow, im shocked at Adelaide being 3rd on the flagpole at that point.Oh right. After the 1998 QFs, during which Adelaide (13-9, 5th) got thumped by Melbourne (14-8, 4th), it looked like this:

Flagpole did pretty well in 1998, I think, having the Crows 1-3 almost the whole year and North 1-2 for the back half. For the GF, it tipped Adelaide 108-89 over North and they ended up winning 105-70.
Hard to score when your opponent is attacking and an efficient user. Also, both teams score from the centre bounce which means each goal, puts either in a favourable position to mount a scoring chain.Very interesting that Hawthorn is the best defensive team according to the Squiggle, with West Coast being the second best.
Really making a mockery of the defence first mantra of most team. Maybe the best defence is a good offence.
Had the best percentage at the end of the minor round by 6% over North. Bulldogs were the only other team within 10%.wow, im shocked at Adelaide being 3rd on the flagpole at that point.
Before that game, maybe, but after that loss, I'd expect in the 4th-6th range. Not 3rd!
Yeah, it's a good effort, considering 1998 is generally considered one of the less likely flags. It's because of this effect I described a couple of posts up, where the algorithm doesn't really penalize teams for bad losses. So when Melbourne defeated Adelaide in the QF, that boosted Melbourne but didn't do much harm to Adelaide.wow, im shocked at Adelaide being 3rd on the flagpole at that point.
Before that game, maybe, but after that loss, I'd expect in the 4th-6th range. Not 3rd!