Stats observations

Remove this Banner Ad

No over 50,000 attendances 1982-2013
All v Fitzroy except Collingwood, Essendon and Hawthorn
Carlton v WB/Footscray (Highest attendance 49,406 round 7, 1992 at the MCG - highest ever attendance at a match between these two.)

No over 30,000 attendances 1982-2013
Fitzroy v Geelong
Fitzroy v Nth Melbourne
Fitzroy v WB/Footscray
 
Highest/Lowest Score and Biggest Win/Loss of the Season.​

It is over 40 years each since two current teams have had the biggest win of the year and over 60 years for one current team.

The team that has had highest percentage of seasons competed scoring the highest score of the year and the highest percentage of seasons competed conceding the lowest score of the year, has also never registered the lowest score of the year nor conceded the season’s highest score.

2014 will be 40 years since one current team scored the lowest score of the year. The same team has not conceded the lowest score of the year in 70 years.

Collingwood last had the biggest loss of the year in the same year as Essendon last conceded the lowest score for the year. You’d have to be well into middle age to have witnessed either.

The Giants are the first team to concede the highest score in consecutive seasons since Fitzroy 1995-6.
(St Kilda conceded the highest score of the year in each of their first 7 seasons. Hawthorn conceded the highest score of the year in 4 consecutive seasons 1966-9.)

Tables and full lists: Click Here.
 
100 Highest Scores

40 of the all-time highest scores are shared between Hawthorn, Geelong and Nth Melbourne.

Collingwood’s last entry is from 1985, WB/Footscray’s from 1978.

None of Melbourne’s scores make it into the list of the 100 highest scores.

39 of the 100 highest scores date from the 1980s.

None of the 100 highest scores have been scored against Collingwood or Fremantle.

In scores from the just the last 7 seasons none of the 100 highest in that period have been scored against Geelong, Hawthorn, St Kilda or Sydney – the most have been scored against Essendon (13) and 12 were scored against the Giants from their 2 seasons in the competition.

100 Lowest scores.

Only 3 of the all-time lowest scores have occurred in the last 30 seasons with the last three entries in the list dating from 2009, 1991 and 1989.

Of teams that were in the competition before 1987 only Nth Melbourne does not have an entry in the list of 100 all-time lowest scores.

Of teams that were in the competition before 1987 only Hawthorn does not have an entry in the list of 100 all-time lowest scores conceded.

100 Biggest wins.

The teams whose highest percentage of matches have been entries in the list of the all-time 100 biggest wins are: Adelaide, Geelong, West Coast and Nth MelbourneFremantle and Port Adelaide have no entries.

WB/Footscray’s only entry is from 1985.

The season with the biggest share of 100 biggest wins is 2011 followed by 2012 and 1991.

70 of the all-time biggest wins date from the period 1984-2012.

In the period 2000-2013, 31 of the 100 biggest losses in that period (94-186 pts.) are shared by GWS, Gold Coast and Melbourne – 5 of the entries are taken by Brisbane (2), WB/Footscray (2) and Geelong (1).

None of the 100 biggest losses 2000-2013 have been suffered by the Swans.

Full Tables: Start by clicking here.
 

Log in to remove this ad.

No over 50,000 attendances 1982-2013
All v Fitzroy except Collingwood, Essendon and Hawthorn
Carlton v WB/Footscray (Highest attendance 49,406 round 7, 1992 at the MCG - highest ever attendance at a match between these two.)

No over 30,000 attendances 1982-2013
Fitzroy v Geelong
Fitzroy v Nth Melbourne
Fitzroy v WB/Footscray

Fitzroy did, however have attendance above 50,000 against Richmond, North Melbourne, St Kilda Melbourne, Carlton and Geelong before 1982:

v Carlton:
R14 1979, Waverley- 58736
SF, 1952, MCG- 59970

v Richmond:
SF 1947, MCG- 82570

v St Kilda:
PF 1913, MCG- 54846
GF 1913, MCG- 59556

v North Melbourne:
SF 1958, MCG- 68213

v Geelong:
SF 1923, MCG- 56240

v Melbourne:
SF 1960, MCG- 79796

v South Melbourne
PF 1923, MCG- 55039


They also drew 65,763 against Sydney for the 1986 first semi final at the MCG.

Carlton v Footscray and Footscray v Fitzroy were the two combinations I was looking for, in terms of never drawing a crowd of 50,000 or more.

Footscray v Fitzroy never drew 30,000 or more.
 
The longest alphabetical sequence of teams in any completed home and away ladder occurred in 1911 when eight teams, from 3rd to 10th, finished in alphabetical order, namely Carlton, Collingwood, Fitzroy, Geelong, Melbourne, Richmond, St. Kilda, University.
The next longest sequence, seven, occurred in 2009 when the teams from 5th to 11th finished in alphabetical order, namely Adelaide, Brisbane Lions, Carlton, Essendon, Hawthorn, Port Adelaide, West Coast.
 
20 Best and Worst Overall Half Seasons 1970-2013.
(Ranked by match/win percentage and then for and against percentage.)

Some observations.

2013 saw Hawthorn and Geelong progress to having just under half the positions on a table of the top 20 best first half season results since the introduction of the 22 match season in 1970.

There were no additions to the table of the 20 best 2nd half season results in 2013.

There were two additions to the table of the 20 worst 1st half season results including the worst ever 1970-2013 and 2 additions to the table of the 20 worst 2nd half season results.

Best and Worst Half Seasons for Each Team.

Two teams in 2013 recorded their best ever 1st half season results – ranking 63rd and 379th respectively from all 1st half season results 1970-2013.

Gold Coast’s best 2nd half of a season so far ranks 493rd from all 2nd half season results 1970-2013.

GWS Giant’s and Gold Coast’s worst 1st half seasons results are ranked 1st and 2nd worst from all 1st half season results 1970-2013 but their worst 2nd half results are ranked 7th and 13th worst overall.

Full Tables Click Here.
 
Number of Matches Required to Win/Lose Last 100. (At end of 2013)
Some observations:

Geelong’s last 100 wins have come from 159 fewer matches than have Melbourne’s.

Hawthorn’s last 100 wins have come from 1 fewer matches than have Collingwood’s.

Fremantle’s and West Coast’s last 100 wins have come from the same number of matches.

Hawthorn’s last 100 wins and Melbourne’s last 100 losses date from the same round in 2008.

Geelong’s last 100 losses to the end of 2013 have come from exactly the same number of matches as did Collingwood’s first 100 losses 1897-1913.

Full Tables: Click Here.
 
The Last 6 in How Many Years?

Some observations:

Premierships:

Hawthorn’s last 6 flags have come from 53 fewer seasons than have Collingwood’s last 6.

Grand Finals:

Geelong’s last 6 Grand Final appearances have come from the fewest number of seasons (21) while St Kilda’s last 6 appearances have come from the most - an even 100 seasons.

Finals Series:

Collingwood’s and Geelong’s last 6 finals series have come from 32 fewer seasons than have Richmond’s last 6.

‘Wooden Spoons’:

Of clubs that have won at least 6 ‘wooden spoons’, Richmond’s last 6 have taken 31 more seasons longer to accumulate than the next longest.

Seasons with more wins than losses:

Richmond’s last 6 seasons with more wins than losses have come from their last 31 seasons – 12 more seasons than the next most – Melbourne.

Full Tables: Click Here.
 
3/4 time - 4 Goals or more behind but won or drew!

Some observations:

Three current teams have never won a match after being 24 points or more down at 3/4 time.

One team established and based outside of Victoria has won two and half times as many matches after trailing by 4 goals at 3/4 time as has one of the Victorian based teams. (The last time the Victorian team won after trailing by such a margin was in 1956.)

Two teams established and based outside of Victoria has won every match where they were 4 goals or more ahead at 3/4 time.

The team that has failed to win the highest percentage of their matches where they led by 4 goals at 3/4 time is a non-Victorian team.

The Victorian team that has gone the longest without winning a match where they were 4 goals ahead at 3/4 time, last surrendered that lead in a Grand Final.

In the last 25 seasons 33 matches have been won and 2 have been drawn by teams trailing by 4 goals or more at 3/4 time.

Only one team has ever lost 3 matches in one season after leading by 4 goals at 3/4 time.


Full Tables and More: Click Here.
 
QUARTERS:

Some observations:

In 2013 Gold Coast and GWS Giants both won their highest percentage of 1st quarters in a season and a much longer established team also won their highest percentage of 1st quarters ever – the 7th highest of all teams that have competed in the League 1897-2013.

In 2013 the Giants improved their 2nd quarter win rate over 2012 and another team recorded their best ever results in 2nd quarters but still remained ranked 17th against all other team’s best 2nd quarter results.

Gold Coast and the Giants also both recorded their best 3rd quarter win percentages in 2013.

Gold Coast’s last quarter win percentage in 2013 was their best so far and one of the longer established teams registered their best ever win percentage from last quarter results.

In 2013 11 new club records were set for highest for and against percentage from quarter results.

In 2013 one team equaled their lowest ever win percentage in 2nd quarters – a low that had been set only 5 years ago.

The Hawks and the Swans both equaled their records for consecutive 1st quarters won in 2013 and the Bulldogs equaled their records for the most consecutive 1st and 2nd quarters lost. Port Adelaide set their new club record for consecutive 3rd quarters lost and Brisbane equaled theirs.

Full Tables: Click Here.
 
A Rare Way to Win.

What is it that you would imagine coaches would mostly encourage their teams to do in winning a match, but up to the end of the 2013 season has happened only 94 times in 14,373 matches (1 in 153)?

Nearly one third (31) of these winning feats have occurred after 1996, with nearly 64.5% of that number (20/31) being achieved by non-Victorian teams.

There have been more occurrences at Subiaco Oval 2001-13, than occurrences at the MCG and Docklands Stadium combined.

Only 4 teams have ever won in this particular way, more than once in the season - the last occurrence in 2012.

None has even occurred in a final.

Gold Coast and GWS are yet to do it but all other teams have done it at least once this century, with the exceptions of Richmond (last done in 1988), Melbourne (last done in 1987) and Carlton (last done in 1960).

Answer: Click Here.
 
On The Day

With the exceptions of the 1897 and 1924 seasons where you had to play all the other finalists and have the best record from those matches, the Premiership has been decided by winning the last match of the season.
Supporters of some other clubs in some seasons may have cause to wonder, ‘if only’.

Some observations.

26 Premiers have lost 2 (and in one case 3) matches during the season against opponents that they never met in a final.

Carlton have won 30.65% of their matches against the eventual Premiers (Nth Melbourne 12.35%).

The last Premiers not to lose to a team outside of the top four on the ladder at the time of the match was Melbourne in 1955 and 1956.

From 1926 to 1938 Collingwood were Premiers 6 times and managed to win matches against the eventual Premiers in each of the other 7 seasons.

From 1965 to 1974 Richmond defeated the eventual Premiers in each of the 6 seasons that they were not Premiers.

The Bulldogs haven't made a Grand Final since 1961 but have in recent times won matches against the eventual Premiers in 5 consecutive seasons 1997-2001 and 4 consecutive seasons 2006-2009.


Melbourne and Nth Melbourne have never won matches against the eventual Premiers in consecutive seasons.

Trouble with the ‘Wooden Spooner’

Leaving out Gold Coast and Greater Western Sydney, Port Adelaide are the only team to have won less than 80% of their matches against the eventual wooden spoon recipient.

Of current teams, Carlton and Nth Melbourne have gone the longest (the same year last century) without losing a match to the eventual wooden spooner.

The last time a finalist lost to the eventual wooden spooner was in 2006.

Three of the foundation members of the League are the only teams to lose two matches in a season to the wooden spooners this century.

Fitzroy 1961-5 and Richmond 1986-90 each won 2 wooden spoons and lost matches to the wooden spooner in the other 3 seasons.

Full Tables: Click Here.
 
One Point Matches – Lesser Known Facts:


More matches (AFL) have been won by 1 point than any other margin.

The most ladder positions gained by a 1-point win is 5.

Only one team has lost matches by 1 point in consecutive finals series.

More than a third of finals lost by 1 point have been lost by the same team.

Four of one team’s last 7 one point wins have been against the same opponent.

Only 1 team has lost 2 Grand Finals by 1 point.

Only one team has loss 2 finals by 1 point in the same finals series.

Fremantle have played the highest percentage of 1-point matches.

Of current teams, Hawthorn has the lowest success rate in 1-point matches.

In one season over 10% of the matches were 1-point results.

Details and More: Click Here.
 

(Log in to remove this ad.)

Has one of the scores from this round been officially altered? Had always believed there were four one-point results from the six games.
Just seeing if anyone was paying attention :)

3/6 was a typo should be 4/6 - has been corrected. (Four 1s that round and a 41 and a 43)

Also gratifying to know than someone is looking at this stuff.

Cheers.
 
25 Greatest Points For and Against Surpluses and Deficits
22 Match Seasons

Some observations:

10 teams that have competed in 22 match seasons have no place in the top 25 points surpluses.

More than half of the top 25 surplus places are taken by two teams.

One long established team’s greatest points surplus ranks as 122nd highest overall.

The top two in the table are equal.

Eight teams to not have a place in the table of 25 greatest points deficits.

One team’s greatest points deficit from a 22 match season is over 1,000 points lower than each of the three greatest recorded.

25 Highest/Lowest Average Points Differences - All Complete Seasons
(APD = Points For minus Points Against divided by Matches Played)

Some observations:

Eleven teams do not have a place in the top 25.

Of current teams that competed before 2011, one’s highest APD in a season ranks 176th overall.

The top 10 highest range from a result in 1950 to one in 2012.

The 10 lowest range from a result in 1899 to two in 2013.

One team’s lowest APD ranks 212th lowest from all season results 1897-2013.

Gold Coast in 2012 had exactly the same APD as Brisbane did twenty years earlier.

Click Here for Full Tables:
 
2007/2008?
(love your work this page btw, been a great read.)
Statement was referring to the list of "Teams that defeated the eventual Premier in 3 or more consecutive seasons:"
Should have read "Melbourne and Nth Melbourne have never won matches against the eventual Premiers in 3 consecutive seasons."
Sorry about the confusion.

North have beaten the eventual premier in 2 consecutive seasons, 1978-9, 1997-8, 2004-5 and 2006-7
Melbourne in 1924-5, 1945-6, 1988-9 and 2004-5.

Thanks for your interest.
 
Scores Doubled or More:
Some observations:

The percentage of matches played where one team doubled or more than doubled their opponent’s score in 2013 was down over 5% on 2012 which saw the highest percentage since the end of World War One.

The range of score factors up to 8 times have been seen in the last three seasons and a factor of 10 times has occurred in the last five but it is nearly 50 years ago that the last factor of 9 (or 9 and a fraction) has happened.

Two teams in 2013 won matches with their highest score factor so far.

One team in 2013 equalled their record number of matches in a season where they doubled or more than doubled their opponent’s score while another equalled their record number of matches in a season having their score doubled by their opponent.

Adelaide and Geelong have played the same percentage matches where their score was 2 times or more their opponent’s score and Port Adelaide have the same percentage as Fitzroy.

In the last 10 season’s Geelong have doubled their opponent’s score twice as many times as Hawthorn have.

St Kilda’s opponents have scored more than twice the Saint’s points more than 3 times as often as have Collingwood’s opponents.

The Giants in two seasons have had their scored double 6 times more than the Swans have had their's doubled by opponents in the last 10 seasons.

St Kilda have never doubled an opponent’s score in a final – Brisbane have scored at least twice as much as their opponent in 20% of the finals that they have played.

WB/Footscray have scored half or less of their opponent’s score in a percentage of their finals matches 10 times greater than Hawthorn have.

The longest a team has gone without their opponent scoring twice as much as them is 192 matches.

The longest a team has gone without doubling their opponent's score is 247 matches. (Ending in 1955).

The number of matches since Geelong last had their score doubled is same as the number Brisbane had to play before they scored twice as many points as their opponent.

Currently 4 teams have gone 50 or more matches without their opponent doubling their score.

Details and More: Click Here.
 
Each Team's Longest Winning/Losing Streak at One Venue 1897-2013

Some observations:

In 2013 two teams set their new longest winning streaks at a single venue, one of which goes unbroken in 2014.

One team has ended other teams’ record winning streaks at a single venue three times more than any other team has.

One team’s longest winning streak at a single venue was not at their ‘home’ venue.

Six teams’ longest losing streaks at the one venue have been at their ‘home’ venue.

One team in 2014 will be one defeat away from equalling their longest losing streak at the one venue.

Each Team's Longest Winning/Losing Streak at the MCG

Five teams have had best winning streaks at the MCG of 10 or more matches.
Ten teams has had worst losing streaks at the MCG of 10 or more matches.

The team with the longest winning streak at the MCG also has a losing streak there only one match less.

Full Tables: Click Here.
 
Drawn:

Essendon have averaged 1 draw every 69 matches – Geelong 1 draw every 110 matches.

No match even at 1/4 time in the 21st century has ended in a draw.

The last 3 matches where the scores were even at 1/4 and 1/2 time were all won by the same team with an average margin of 57 points.

The first and last match played where both teams scored the same points in the 3rd and last quarters were between the same two teams.

A higher percentage of matches have ended as draws at the Gabba than have at the MCG.

The longest consecutive number of seasons with a draw is 14 – 1987-2000.

More – Click Here


Something else that's interesting is Essendon beat GWS by 66 points in their first clash and Geelong beat GWS by 65 points in their first clash but were neck and neck in that game up to half time.
 
Each Team's Best and Worst Match/Win Percentage From 5-10, 15 and 20 Consecutive Seasons.

In 2013 a fourth club joined three other clubs in having five discrete (non overlapping) periods of winning more than 70% of their matches over five consecutive seasons. (That club was not Geelong.)

In 2013 a second club joined St Kilda in having more than four discrete (non overlapping) periods of winning less than 30% of their matches over five consecutive seasons. The same club also established their equal lowest match/win% from six consecutive seasons and lowest from seven.

Two other clubs (including one of the 2013 finalists) established their lowest match/win% from six consecutive seasons – one of those clubs also recorded their lowest match/win% from seven consecutive seasons

Two clubs recorded their highest match/win% from seven consecutive seasons – one of which set a new League record.

A new club record for match/win% over eight consecutive seasons set in 2013 was only 1.9% below the League record.

Two new club records for match/win% from nine consecutive seasons were also set in 2013. The same clubs also recorded their highest match/win% from 10 consecutive seasons.

One of the 2013 finalists recorded their lowest match/win% from nine and 10 consecutive seasons.

One of the teams that acceded to the League in 1987 established their lowest match/win% from 20 consecutive seasons while the other recorded their highest from 20 consecutive seasons.

Find out who: Click here for full tables.
 
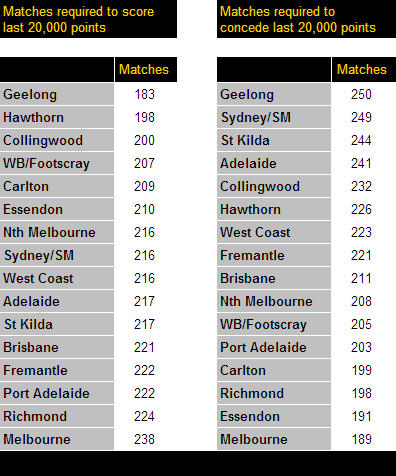
last20000_zpse6052827.png
 
Most Brownlow votes at each age since 1984 (e.g. '24yo' is the period from the player's 24th birthday to the day before he turns 25, and may span consecutive seasons):

Age|Votes|Player(s)
\17yo|10|Leon Cameron
\18yo|8|Byron Schammer, Scott West
\19yo|13|Nathan Fyfe, Gavin Wanganeen
\20yo|30|Chris Judd
\21yo|20|Wayne Carey, Lance Franklin, Tony Lockett, Paul Roos
\22yo|31|Trent Cotchin
\23yo|29|Jimmy Bartel
\24yo|28|Gary Ablett jnr, Shane Crawford
\25yo|31|Peter Matera
\26yo|30|Robert Harvey, Chris Judd
\27yo|34|Dane Swan
\28yo|30|Sam Mitchell, Mark Ricciuto
\29yo|27|Brent Harvey
\30yo|30|Greg Williams
\31yo|23|Scott West
\32yo|20|Todd Viney
\33yo|22|Matthew Richardson
\34yo|14|Tony Liberatore
\35yo|18|Craig Bradley
\36yo|16|David Cloke
\37yo|10|Craig Bradley
\38yo|6|Michael Tuck
A couple of eyebrow-raisers in there...
 

Remove this Banner Ad

Back
Top