Stats observations

Remove this Banner Ad

As above, but for goals:

Age|Goals|Player(s)
\15yo|8|Tim Watson
\16yo|22|Keith Bromage, Mick Maguire
\17yo|52|Des Fothergill
\18yo|77|Tony Lockett
\19yo|98|John Longmire
\20yo|100|John Coleman
\21yo|141|Bob Pratt
\22yo|125|Peter Hudson
\23yo|133|Peter McKenna
\24yo|150|Peter McKenna
\25yo|150|Peter Hudson
\26yo|132|Tony Lockett
\27yo|146|Jason Dunstall
\28yo|122|Jason Dunstall
\29yo|110|Tony Lockett
\30yo|121|Tony Lockett
\31yo|124|Gary Ablett snr
\32yo|128|Gary Ablett snr
\33yo|123|Gary Ablett snr
\34yo|79|Alastair Lynch
\35yo|69|Gordon Coventry
\36yo|37|Kevin Bartlett, Tom Fitzmaurice
\37yo|14|Craig Bradley
\38yo|7|Craig Bradley
\39yo|3|Jack Leith
\40yo|-|-
\41yo|-|-
\42yo|1|Vic Cumberland
 
Century Scores: A few observations:


From 1987 to 2013 Geelong and Nth Melbourne each scored centuries in 52.82% of their matches.

From 1987 to 2013 Collingwood conceded centuries in 33.17% of their matches – Richmond in 52.25%

From 1997 to 2013, no team scored centuries in more than half their matches. From 1977 to 1993, nine of the 15 teams that competed in the period scored centuries in more than half their matches.

Carlton are the only team to have scored 20 centuries in a season and conceded 20 centuries in another season.

The last season where Collingwood didn’t score a century was 1916 – the last season where Nth Melbourne didn’t score a century was 1972.

The last season where two teams didn’t concede a century was 1965 (Essendon and Richmond).

Nth Melbourne have conceded at least 2 centuries in every season that they have played.

Every team that competed in the League from 1925 (and before 1987) has conceded 8 or more consecutive centuries at least once except Hawthorn – most 6 in 1941 and 2006.

Six teams that scored a century have been beaten by a century. (Three of them represented the same club.)

Full Tables and More: Click Here.
 
Most matches played without losing/winning 2,3 or 4 consecutively

Geelong and Hawthorn have gone the equal 5th longest without losing consecutive matches. Geelong are currently 18 matches off their record and Hawthorn 34 matches off theirs’.


Carlton have with Fitzroy, the equal 6th longest run of matches without consecutive defeats.


Fremantle are currently 7 matches short of their record of matches played without losing consecutively.


The League’s longest run of matches played by a team without losing more than two consecutively is currently open.


Collingwood are currently in their third longest run without losing more than 3 matches in succession.


Geelong are currently in their second longest run without losing more than 3 matches in succession.

Melbourne are currently in their longest run of matches without winning consecutive matches.


Melbourne are currently in their second longest run of matches without winning more than three consecutive matches.


Full Tables and More Click Here:
 

Log in to remove this ad.

Results in Finals Compered to the Previous Match Between the Two Teams.

Every team that has played finals (except West Coast) has played in a final at least once were the result against their opponent in the previous meeting between the two was turned around by 100 points or more.

The biggest turnaround in a final is 170 points from the previous match between the two.

The most even turnaround is a 68-point win after losing to the opponent in the final by 67 points in the previous match between the two.

Five finals have had the same result and margin as the previous match between the two teams. Three of those matches were in consecutive finals series.

Six finals have been won by the same margin that the winner lost by in the previous encounter with their opponent in the final.

Twelve teams have beaten their opponent in a final by margins increased 60 points or more from their previous meeting.

Twelve losing teams have reduced their losing margin by 60 points or more compared to their previous match against their finals opponent.

Details and More: Click Here.
 
RogersResults , I have been going over some stats to compare some of the past and present day champs.

Trying to work out a table which gives us an idea of how players went against teams whenever they exceeded their goal average (by 1 or more) for that particular season.
Do you know if anyone has a personal table like this already?
 
eg. Wayne Carey (excluding Adelaide days)

exceeded goal average 46% of the time against teams who finished 1st to 8th
exceeded goal average 25% of the time against teams who finished 1st to 4th
exceeded goal average 54% of the time against teams who finished 8th to 16th
exceeded goal average against the 14th placed team on eight separate occasions throughout his career
 
Last edited:
RogersResults , I have been going over some stats to compare some of the past and present day champs.

Trying to work out a table which gives us an idea of how players went against teams whenever they exceeded their goal average (by 1 or more) for that particular season.
Do you know if anyone has a personal table like this already?
'Ron the Bear' and 'Paul' have the data that could generate this sort of information. Try your query in the 'Stats Questions' thread.
 
One Saturday night in 1996, a game between St Kilda and Essendon had to be stopped half-way through because the lights went out. Luckily, the teams returned to finish the game on the following Tuesday. It is the only AFL game that ever has taken place over two different days.
 
Just trying something here. Those of us that have persisted with inline tables, I suggest you try embedding Google Spreadsheets instead. You get to keep a copy for future reference, formatting is much easier, etc etc. But yet to figure out how to reduce the width and length to just the table size.

EDIT: been playing around with filename and worksheet name and how they are presented here.

 
Last edited:
Just trying something here. Those of us that have persisted with inline tables, I suggest you try embedding Google Spreadsheets instead. You get to keep a copy for future reference, formatting is much easier, etc etc. But yet to figure out how to reduce the width and length to just the table size.

EDIT: been playing around with filename and worksheet name and how they are presented here.

Good suggestion - definitely look neater and must be easier to construct.

Finals played outside of home state.

outside_finals_zps9942fc24.png


(In case anyone has wondered: The above is generated in Filemaker Pro,
then pasted into Irfanview, saved as a PNG graphic file and uploaded to photobucket
.com/‎)
 
Good suggestion - definitely look neater and must be easier to construct.

(In case anyone has wondered: The above is generated in Filemaker Pro,
then pasted into Irfanview, saved as a PNG graphic file and uploaded to photobucket
.com/‎)

Of course your tables look awesome. I assume your site uses Filemaker Pro? You wouldn't have a Mac Pro backend would you?
 
Of course your tables look awesome. I assume your site uses Filemaker Pro? You wouldn't have a Mac Pro backend would you?
Filemaker Pro's origins in ClarisWorks which became an Apple subsidiary means it has a graphical orientation. It is very easy to set up the data in any graphical format.
My copies of Filemaker Pro run under Windows XP on a home-built desktop and a venerable IBM Thinkpad.

Another alternate to imbedding Google Docs is a screen capture from a spreadsheet program.

Anyone guess what this shows?

lead1q_zps95e20a3e.png


Made with LibreOffice open source spreadsheet. Screenshot processed by freeware Irfanview and uploaded to Photobucket.
LibreOffice also has a database program compatible with Microsoft Access.
(Filemaker Pro is probably the easiest to use and learn from scratch and has better
graphics tools.)
 

(Log in to remove this ad.)

Filemaker Pro's origins in ClarisWorks which became an Apple subsidiary means it has a graphical orientation. It is very easy to set up the data in any graphical format.
My copies of Filemaker Pro run under Windows XP on a home-built desktop and a venerable IBM Thinkpad.

Another alternate to imbedding Google Docs is a screen capture from a spreadsheet program.

Anyone guess what this shows?

lead1q_zps95e20a3e.png


Made with LibreOffice open source spreadsheet. Screenshot processed by freeware Irfanview and uploaded to Photobucket.
LibreOffice also has a database program compatible with Microsoft Access.
(Filemaker Pro is probably the easiest to use and learn from scratch and has better
graphics tools.)
Probably something like games played at the MCG 2007-present.
 
Filemaker Pro's origins in ClarisWorks which became an Apple subsidiary means it has a graphical orientation. It is very easy to set up the data in any graphical format.
My copies of Filemaker Pro run under Windows XP on a home-built desktop and a venerable IBM Thinkpad.

Another alternate to imbedding Google Docs is a screen capture from a spreadsheet program.

Anyone guess what this shows?

lead1q_zps95e20a3e.png


Made with LibreOffice open source spreadsheet. Screenshot processed by freeware Irfanview and uploaded to Photobucket.
LibreOffice also has a database program compatible with Microsoft Access.
(Filemaker Pro is probably the easiest to use and learn from scratch and has better
graphics tools.)
Let's go games leading at a certain break, 2009-present.
 
In 2013, Hawthorn and Richmond participated in the same finals series for the seventh time (1971, 1974, 1975, 1977, 1982, 2001, 2013), but once again there was no finals meeting between the Hawks and Tigers.

Of the other Victorian clubs, Richmond and the Bulldogs have never played a final, but have paid only in the same finals series twice, in 1944 and 1995. Carlton and the Bulldogs have played in the same finals series nine times - 1938, 1976, 1985, 1994, 1995, 1999, 2000, 2009 & 2010, and there are plenty of examples of one making the finals at the expense of the other, yet the only September games between the Blues and Bulldogs would be a last round match of a home & away season that encroached into the ninth month.

Of clubs that have played finals, but not for some time, a remarkable case is Melbourne and Richmond. The Demons and Tigers last played a final in 1940 when Melbourne trounced Richmond in the Grand Final, but have not met in the finals since, and the last finals series containing both Richmond and Melbourne was in 1941.

When counting Fitzroy, the Lions never played the Bulldogs in a final, and the only finals series containing these teams was in 1944. Fitzroy's last finals match against St Kilda was the 1913 Grand Final, and the Lions last played finals against their feline cousins the Geelong Cats in 1923.

While the Fitzroy records obviously cannot change, I wonder if any of the other non-finals teams will meet in a final anytime soon? I think that the Melbourne vs Richmond drought will continue for some time.
 
From 1995 to 2011, Geelong played at least one final against all the other 15 teams that played finals in the period.

For a chart of all the finals meetings, plus
  • Most common pairings.

  • Most consecutive.

  • Most in 10 years

  • 20% or more against 1 opponent.

  • Longest gaps between meetings.

    Click here.
 
Each Team's Least/Most Number of Matches Played for 50/100 Wins:

In 2013, Fremantle had their 50th win from their last 86 matches – the least number of matches that they have needed for 50 wins since joining the League. (Fremantle also established their new club record for the least number of matches played for 100 wins.)

Despite a greatly improved season last year, 2013 saw Port Adelaide complete their longest sequence of matches needed to realise 50 wins.

Carlton in 2013 established their new club record of the most matches that they have had to play to amass 100 wins.

Geelong have played 159 fewer matches for their last 100 wins than have Melbourne.

Hawthorn have played 120 fewer matches for their last 50 wins than have Melbourne.


Full tables: Click here.
 
eg. Wayne Carey (excluding Adelaide days)

exceeded goal average 46% of the time against teams who finished 1st to 8th
exceeded goal average 25% of the time against teams who finished 1st to 4th
exceeded goal average 54% of the time against teams who finished 8th to 16th
exceeded goal average against the 14th placed team on eight separate occasions throughout his career

Are they just random examples or exact criteria?
 
Are they just random examples or exact criteria?

nah tried my best with exact criteria. Wanted to get an idea of how often certain players performed above their usual means against better teams but in the end, most of them were pretty similar in output.

Another example of what I was trying to work out...Lance Franklin's output against the better teams:

2006 goal average is 2.2 (any game he scored 3.2 or more has been included)
6 goals against Richmond, final ladder position 9th
6 goals against Richmond, final ladder position 16th


2007 goal average is 3.3
9 goals against Essendon, final ladder position 12th
7 goals against Adelaide, final ladder position 8th
6 goals against Bulldogs, final ladder position 13th
6 goals against Sydney, final ladder position 7th
5 goals against St Kilda, final ladder position 9th
5 goals against Brisbane, final ladder position 10th


2008 goal average is 4.5
9 goals against Essendon, final ladder position 12th
8 goals against Brisbane, final ladder position 10th
8 goals against Collingwood, final ladder position 8th
8 goals against Bulldogs, final ladder position 3rd
6 goals against Melbourne, final ladder position 16th
6 goals against Adelaide, final ladder position 5th
6 goals against Collingwood, final ladder position 8th
6 goals against Port Adelaide, final ladder position 13th
6 goals against Brisbane, final ladder position 10th


2009 goal average is 3.2
5 goals against Geelong, final ladder position 2nd
5 goals against Essendon, final ladder position 8th
5 goals against Collingwood, final ladder position 4th
5 goals against Geelong, final ladder position 2nd
5 goals against Richmond, final ladder position 14th


2010 goal average is 3.5
6 goals against Collingwood, final ladder position 1st
5 goals against Kangaroos, final ladder position 9th
5 goals against Essendon, final ladder position 14th
5 goals against Carlton, final ladder position 8th
5 goals against Essendon, final ladder position 14th
5 goals against St Kilda, final ladder position 3rd
5 goals against Fremantle, final ladder position 6th


2011 goal average is 3.7
8 goals against Port Adelaide, final ladder position 16th
6 goals against West Coast, final ladder position 4th
6 goals against Sydney, final ladder position 7th
5 goals against Richmond, final ladder position 12th
5 goals against St Kilda, final ladder position 6th
5 goals against Melbourne, final ladder position 13th
5 goals against Bulldogs, final ladder position 10th


2012 goal average is 3.6
13 goals against Kangaroos, final ladder position 8th
5 goals against Collingwood, final ladder position 4th
5 goals against St Kilda, final ladder position 9th
5 goals against Brisbane, final ladder position 13th


2013 goal average is 2.8
8 goals against Essendon, final ladder position 9th
5 goals against West Coast, final ladder position 13th
5 goals against Gold Coast, final ladder position 14th
5 goals against Kangaroos, final ladder position 10th
4 goals against Collingwood, final ladder position 6th
4 goals against Fremantle, final ladder position 3rd
4 goals against Carlton, final ladder position 8th
4 goals against Brisbane, final ladder position 12th
4 goals against Collingwood, final ladder position 6th


so it basically comes out like this

1
2, 2
3, 3, 3
4, 4, 4
5
6, 6, 6, 6
7, 7
8, 8, 8, 8, 8, 8, 8
9, 9, 9, 9, 9
10, 10, 10, 10, 10
12, 12, 12, 12
13, 13, 13, 13, 13
14, 14, 14, 14
16, 16, 16
-----------------------------------------------------------------------------------------------

49 times Franklin has exceeded his goal average for that particular season
47% record against teams who have finished 1st to 8th
18% record against teams who finished 1st to 4th


Obviously his career is only halfway through so all of the above will be irrelevant in a couple months time but that's sort of what I was trying to get at with the stats.
 
The occasional series of Mystery Tables:

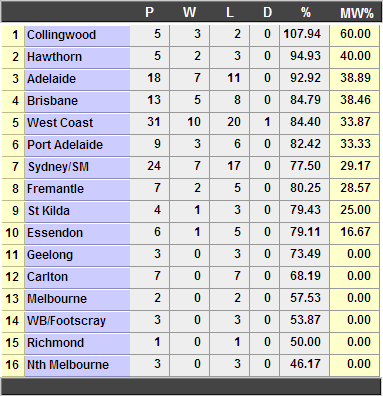
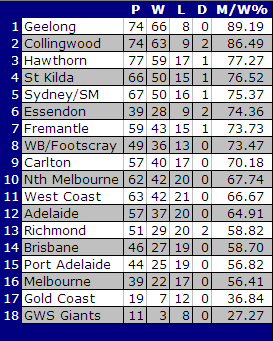
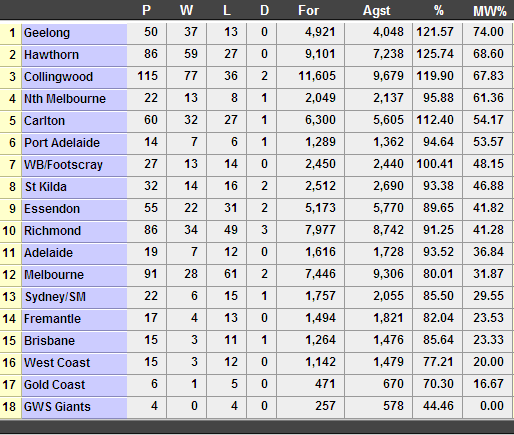
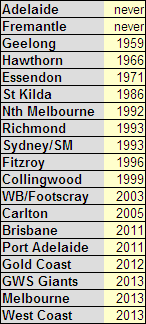
no_finalist_win_zps0ebdf9fe.png


What is shown in the above table?

I have been going crazy trying to figure this out for days. Most of the sides listed were struggling teams, but not all were wooden spooners, and in any case Fremantle finished last in 2001, while North (1992) and West Coast (2013) were more disappointing teams than bad teams. I thought it might be failing to win interstate, but 4 of these occurrences took place in the 50s, 60s, 70s and 80s. I also thought it might have something to do with changing coaches, but Adelaide and Fremantle have both dismissed coaches mid season. Please let me know what the common link is.
 

Remove this Banner Ad

Back
Top