

AN
away game.
away game.
Follow along with the video below to see how to install our site as a web app on your home screen.
Note: This feature may not be available in some browsers.
Have you met Snake Baker? Reckon you guys could get along just fine at a BBQ.AN
away game.
Envy. Pure and simple.I’ve not seen as many “neutral” posters ruffled by another team winning the flag as some are with Richmond.
Envy?Envy. Pure and simple.
You forgot one column| West Coast 2006 | Richmond 2017 \Grand Final Margin|1 pt|48 pts\Preliminary Final Margin|10 pts|36 pts\Qualifying Final Margin|Lost by 1 pt|51 pts\Drug scandals|1|0
Didn't West Coast 2006 lose their home final? Then beat the same team at the 'G? Where was that mystical home ground advantage that's suddenly now worth 50 points?You forgot one column
Home finals gifted not earned
West Coast - 0
Richmond - 2
The only mystical thing about home ground advantage is the fact that there are some out there who deny the simple truth that you’re more likely to win at homeDidn't West Coast 2006 lose their home final? Then beat the same team at the 'G? Where was that mystical home ground advantage that's suddenly now worth 50 points?
A flag's a flag IMO.For those that voted 2008 take a moment to look at these results in the finals series:
Hawthorn 18.19 (127) Western Bulldogs 11.10 (76) (51 point win to Hawthorn)
Hawthorn 18.10 (118) St Kilda 9.10 (64) (54 point win to Hawthorn)
Geelong 11.23 (89) Hawthorn 18.7 (115) (26 point win to Hawthorn)
This was in a year where the top 3 sides were dominant compared to the rest of the competition, including a team that had the most dominant home and away season of all time in Geelong.
If you have voted for a team that has dominated a finals series after and solid home and away season, you are clearly showing your bias. Teams like North in 1996 & 1999, Essendon in 2000, Lions 2001, Hawthorn 2008, Geelong 2011 and Richmond in 2017 shouldn't even be a poll option IMO.
Don't worry. People are just memeing.For those that voted 2008 take a moment to look at these results in the finals series:
Hawthorn 18.19 (127) Western Bulldogs 11.10 (76) (51 point win to Hawthorn)
Hawthorn 18.10 (118) St Kilda 9.10 (64) (54 point win to Hawthorn)
Geelong 11.23 (89) Hawthorn 18.7 (115) (26 point win to Hawthorn)
This was in a year where the top 3 sides were dominant compared to the rest of the competition, including a team that had the most dominant home and away season of all time in Geelong.
If you have voted for a team that has dominated a finals series after and solid home and away season, you are clearly showing your bias. Teams like North in 1996 & 1999, Essendon in 2000, Lions 2001, Hawthorn 2008, Geelong 2011 and Richmond in 2017 shouldn't even be a poll option IMO.
But no-one thinks home ground advantage is worth 50 points. If that were true, the home side would win every game.The only mystical thing about home ground advantage is the fact that there are some out there who deny the simple truth that you’re more likely to win at home
Behold Richmond's fearsome home-ground advantage:You lot are mcg queens
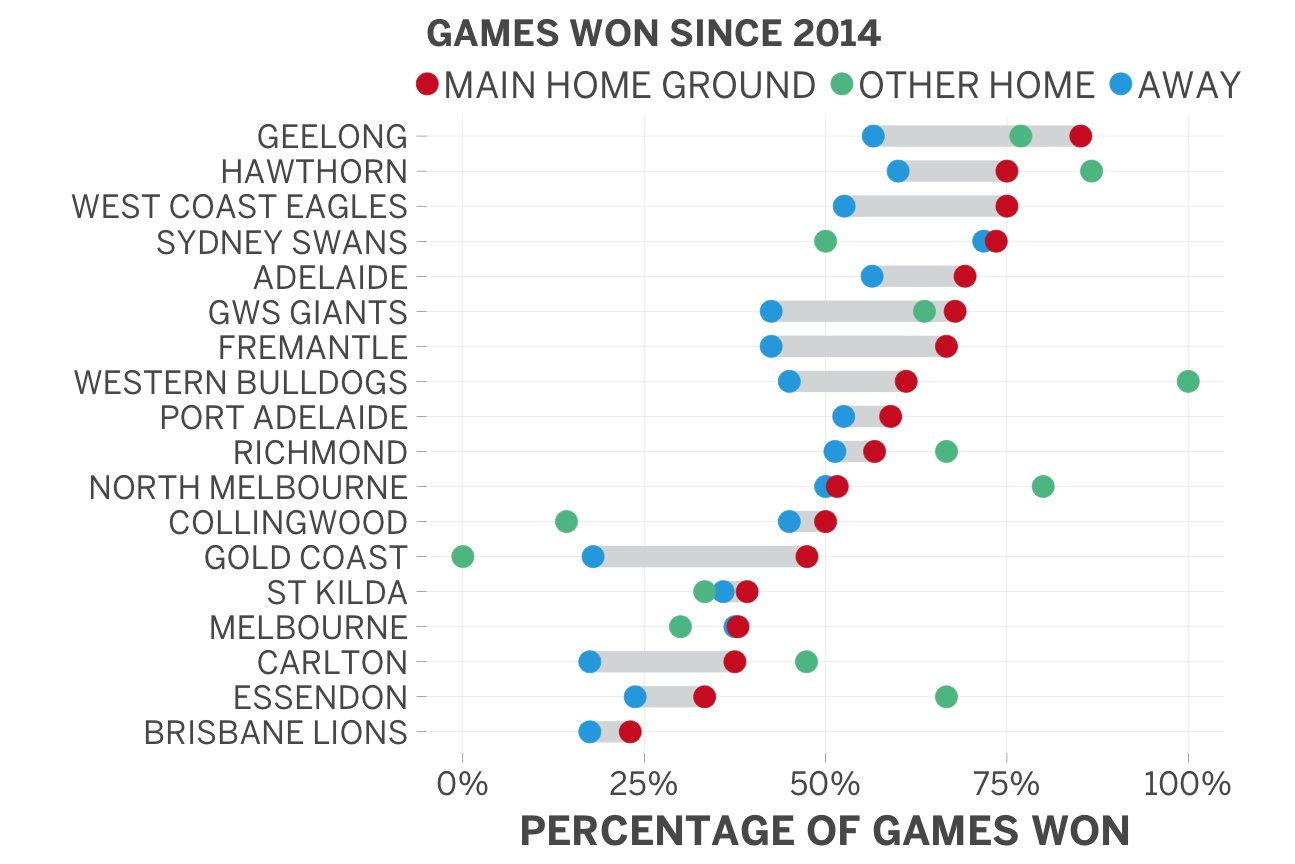
So Geelong go from 80% games won at home to 50% wins awayBehold Richmond's fearsome home-ground advantage:

A flag's a flag IMO.
Oh boy! No, that's not how the maths works. You have managed to combine misreading the graph with double counting.So Geelong go from 80% games won at home to 50% wins away
Richmond go from 50% wins away to 60% wins at home
The result of being gifted home games against Geelong is a 40% greater chance of winning for Richmond
You have to add the advantage for one team and the disadvantage for the other
We're better at Etihad than the G?Behold Richmond's fearsome home-ground advantage:
I guess? Probably a pretty small sample size. That article is here.We're better at Etihad than the G?
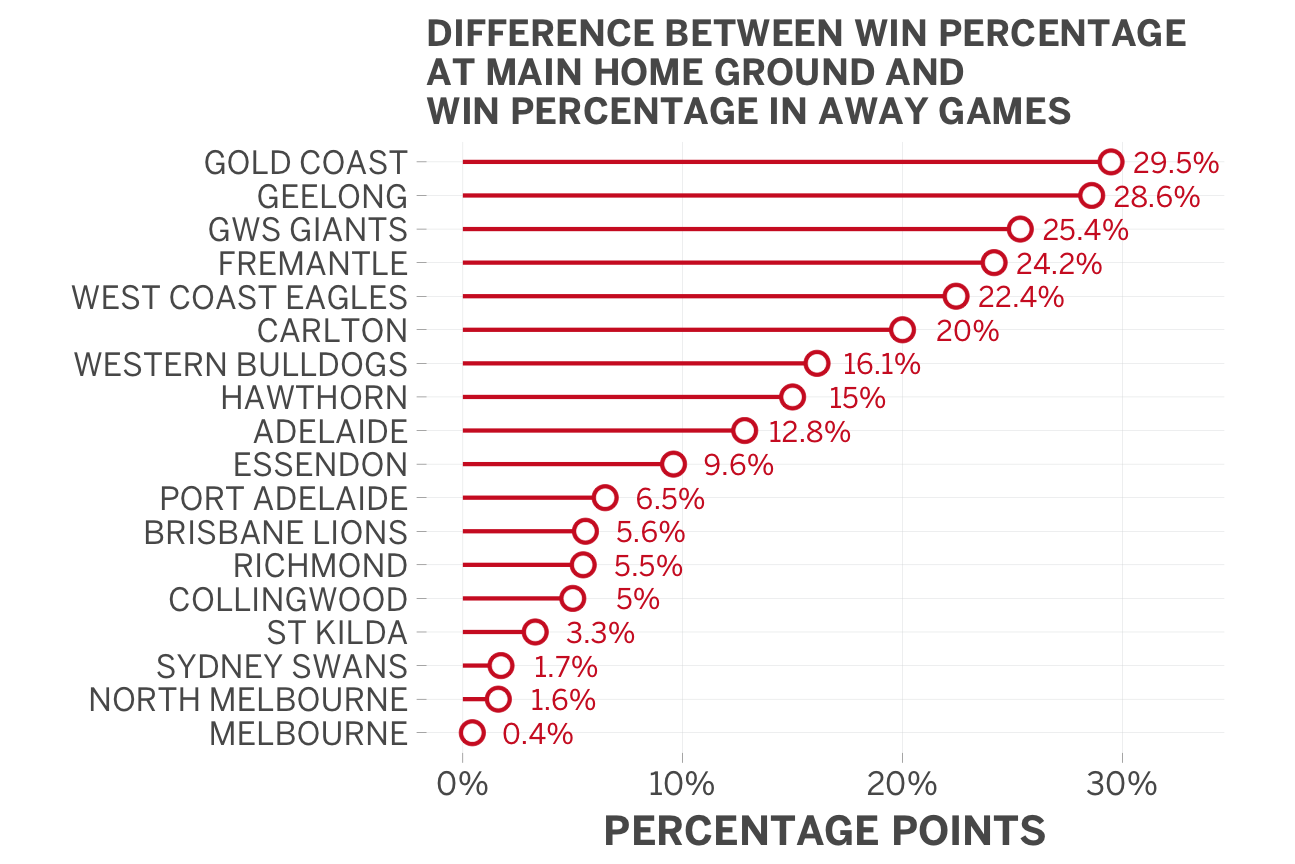
Wow. Looks like a lot of work to try and somehow disprove the simple fact that Geelong lose a 30% winning home ground advantage that they have earned in finals or deserve during the regular season while Richmond are gifted a 6% better chance of winning.Oh boy! No, that's not how the maths works. You have managed to combine misreading the graph with double counting.
First, the difference between Richmond's home & away win performance is 5.5%, not 10%:
That's one of the smallest in the league, and why the "MCG queens" argument is a weird one.
Geelong does have a big advantage at the Cattery! (Although they are 0-1 for finals.) That is 28.6%. So you could reasonably conclude that they'd be a significantly better shot if they got to play all their finals there.
But you are double counting if you take the Richmond difference and add it to the Geelong difference, because those numbers already account for the opposition. You should average +28.6 and -5.5, since the fact that Geelong is (much) stronger than average at home is somewhat countered by the fact that Richmond isn't as weak as average away.
Still, let's take a generous interpretation! We'll use Geelong's number, i.e. one of the most extreme in the league.
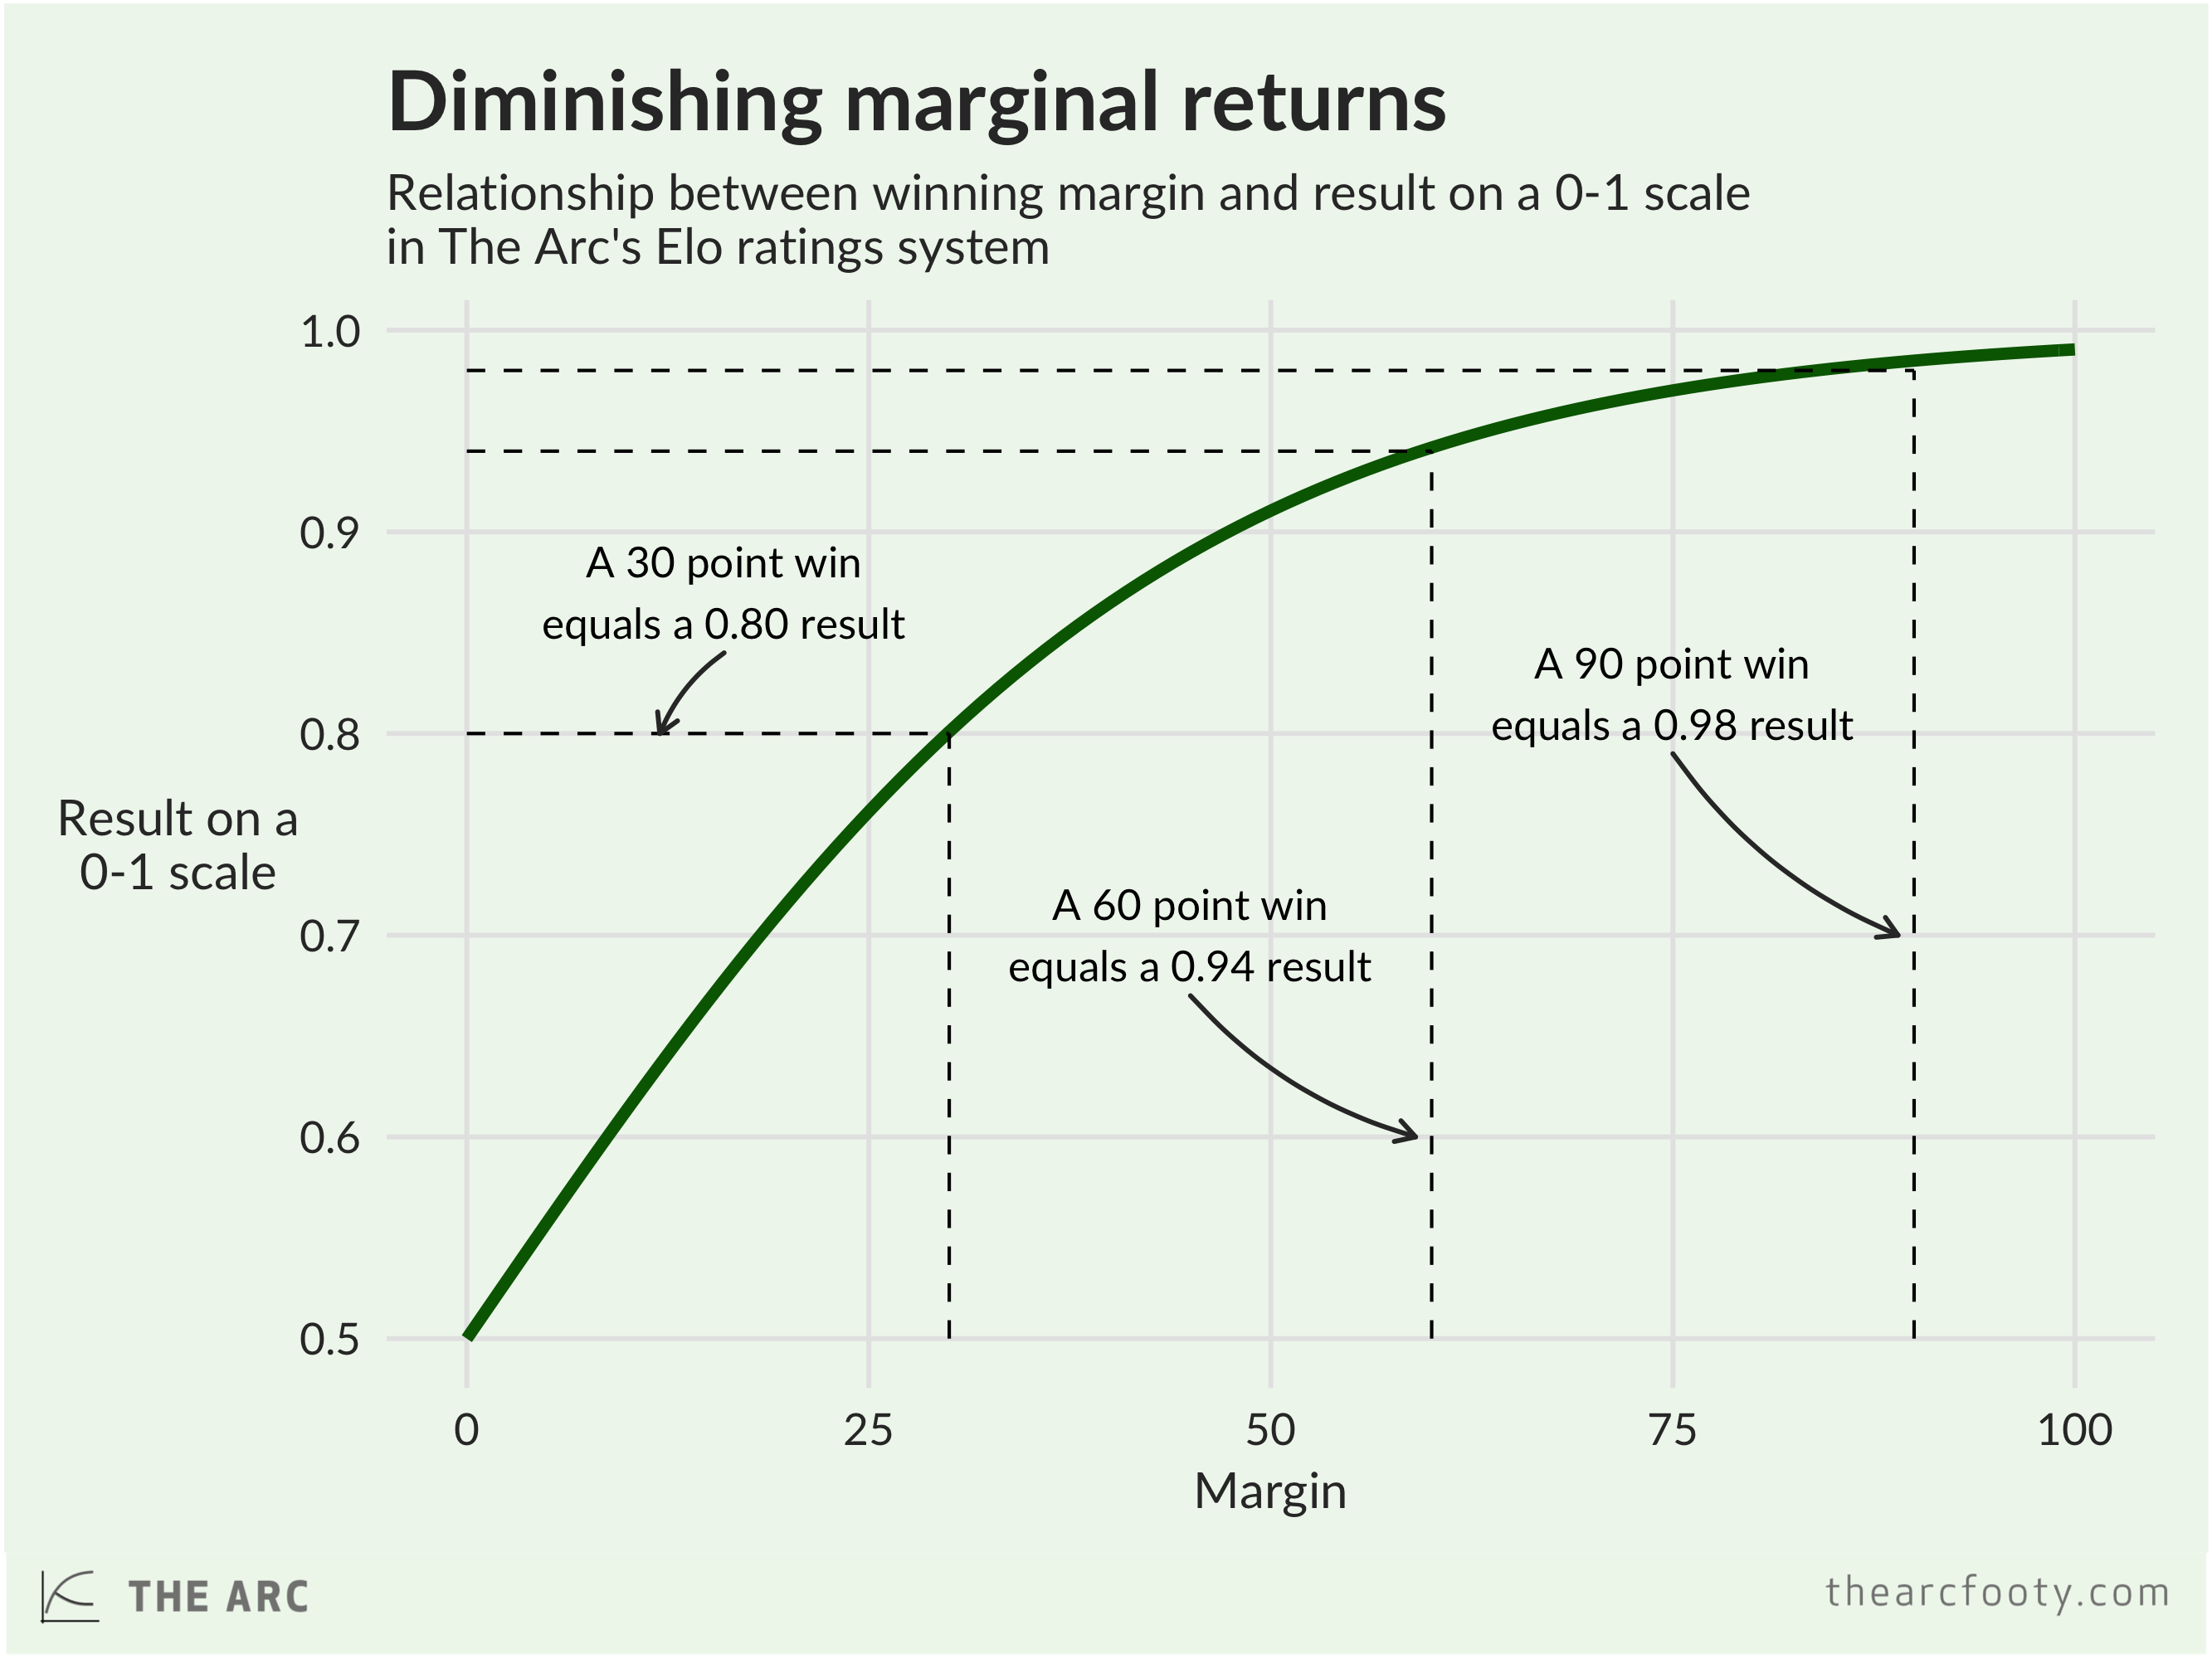
Now when viewed retrospectively, margin matters. If a game was close, a lot of things could have made a crucial difference. But if it was a thrashing, it's less likely that any single factor could have changed the outcome.
In fact, there's already a lot of statistical work on this, and you can very roughly translate a 1% win likelihood into about 0.5 pts of margin. That is, if you think a team has a 60/40 chance, that's equivalent to expecting a 10-point win. If you think it's 80/20, that's roughly a 30-pt win. Here is a pictorial representation:
Richmond defeated Geelong by 51 points, which is a lot: about 0.92 on the chart above. So what happens if you pull the result back by 0.286? You're at 0.64, which is still a comfortable Richmond victory.
Even with the most favourable interpretation, and ignoring things like how Geelong's actual finals record at Kardinia is 0%, or that home ground advantage is far less statistically significant in finals than home & away games, you can't get close to the conclusion that it was the difference, because Richmond simply won by too much.
Explains why Geelong make the finals nearly every year you mean?Wow. Looks like a lot of work to try and somehow disprove the simple fact that Geelong lose a 30% winning home ground advantage that they have earned in finals or deserve during the regular season while Richmond are gifted a 6% better chance of winning.
It’s a swing of 36% in Richmond’s favour
Everything they have got they have EARNEDExplains why Geelong make the finals nearly every year you mean?
It's all swings and roundabouts in the AFL.Everything they have got they have EARNED
He knows how to maths.Wow. Looks like a lot of work to try and somehow disprove the simple fact that Geelong lose a 30% winning home ground advantage that they have earned in finals or deserve during the regular season while Richmond are gifted a 6% better chance of winning.
It’s a swing of 36% in Richmond’s favour
Leave the not so complicated math to the adults.Wow. Looks like a lot of work to try and somehow disprove the simple fact that Geelong lose a 30% winning home ground advantage that they have earned in finals or deserve during the regular season while Richmond are gifted a 6% better chance of winning.
It’s a swing of 36% in Richmond’s favour
