- Aug 22, 2009
- 24,555
- 29,452
- AFL Club
- West Coast
This is really on the nerdy end of trading/draft stuff.
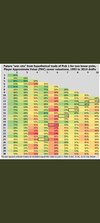
I get pretty frustrated with the AFL's points index as it doesn't reflect how clubs value picks. This is because the AFL based on it salary, which doesn't line up with the pick-for-pick trading market. It's basically garbage, and yet the entire industry still refers to it.
I took all the pick-for-pick trades over the years and calculated a points curve which more accurately reflects the value of picks relative to higher-lower picks. It's not perfect, but it's 100 times more accurate than the AFL's curve. If anything, it could probably be slightly steeper.
Feel free to use it or to provide feedback.

Edit: I think correct formula is actually
=(-850*LN(pick number))+(3000*(pick number^1.002725))


I get pretty frustrated with the AFL's points index as it doesn't reflect how clubs value picks. This is because the AFL based on it salary, which doesn't line up with the pick-for-pick trading market. It's basically garbage, and yet the entire industry still refers to it.
I took all the pick-for-pick trades over the years and calculated a points curve which more accurately reflects the value of picks relative to higher-lower picks. It's not perfect, but it's 100 times more accurate than the AFL's curve. If anything, it could probably be slightly steeper.
Feel free to use it or to provide feedback.
Edit: I think correct formula is actually
=(-850*LN(pick number))+(3000*(pick number^1.002725))
Last edited: