- Joined
- May 10, 2009
- Posts
- 59,885
- Reaction score
- 47,128
Fingers crossed mate, but it looks a great position to long from. I can’t believe how bad that PayPal chart looks though hahaI fomo'd in most of my last stables when we hit 43k. Pray for me.
Follow along with the video below to see how to install our site as a web app on your home screen.
Note: This feature may not be available in some browsers.

PLUS Your club board comp is now up!
 BigFooty Tipping Notice Img
Weekly Prize - Join Any Time - Tip Opening Round
The Golden Ticket - Official AFL on-seller of MCG and Marvel Medallion Club tickets and Corporate Box tickets at the Gabba, MCG and Marvel.
Fingers crossed mate, but it looks a great position to long from. I can’t believe how bad that PayPal chart looks though hahaI fomo'd in most of my last stables when we hit 43k. Pray for me.
I've learned that if you're gonna fomo, make sure it's early in the pump.Fingers crossed mate, but it looks a great position to long from. I can’t believe how bad that PayPal chart looks though haha
Log in to remove this Banner Ad
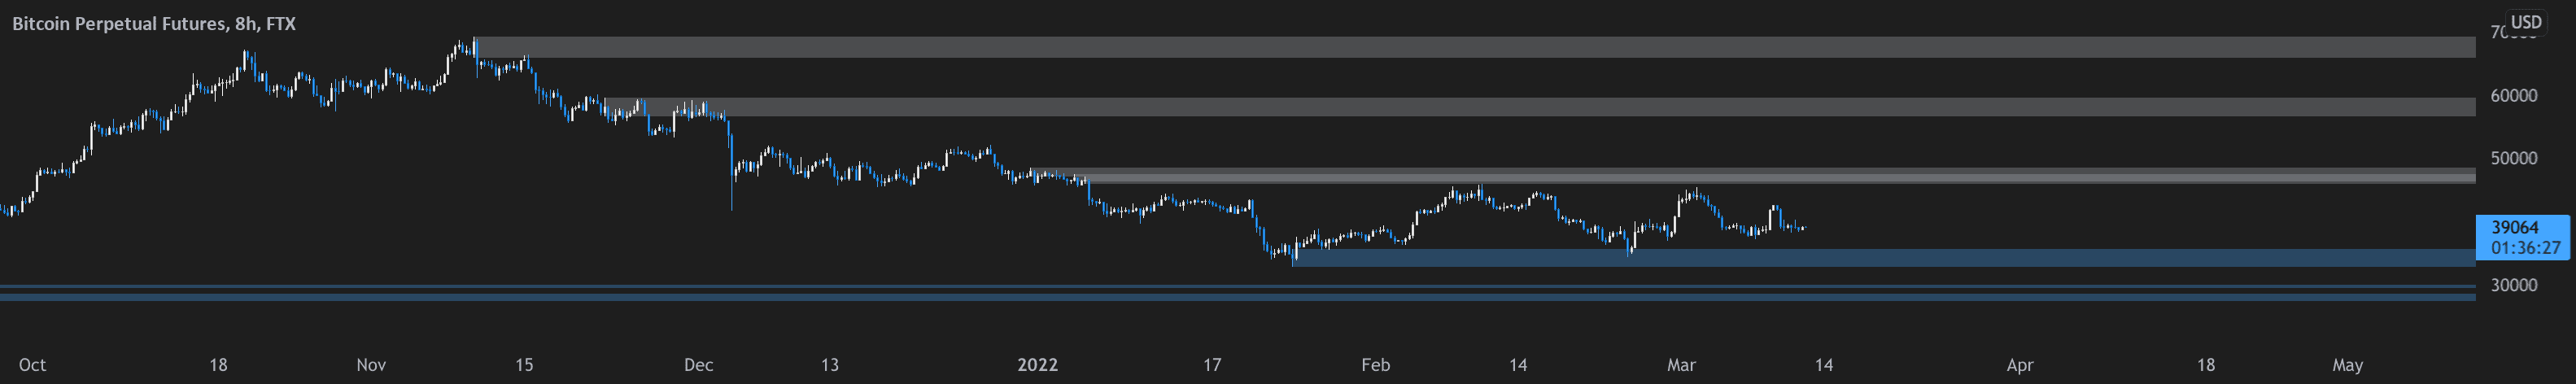
This tool is handy to identify supply and demand zones. Free on tv.
True Supplies and Demands — Indicator by truenomic
This indicator automatically helps you find supplies & demands using different detection methods. Methods for classification: i) Supply: High/Low; Demand: High/Low https://www.tradingview.com/x/SzWiWLp2 ii) Supply: High/Open; Demand: Low/Open https://www.tradingview.com/x/jfiH4clD Also in...www.tradingview.com
The results look better for smaller timeframes from my the minimal time I've spent experimenting. Anything up to 12hours seems clean.Thanks mate, best timeframes to use on? I just have weekly Heikin Ashi candles on my charts these days


