Analysis Stats Thread

Remove this Banner Ad

ansonholt

Premiership Player
May 12, 2009
4,000
9,262
All in Sunbury
AFL Club
North Melbourne
Okay. So during the game yesterday I noticed that our inside 50 count wasn't too bad and was close to our opponent's. I also recall that in round 2 we smashed them in this area but still lost. I was curious to know how we're tracking because it FEELS like we are playing better this year, but just facing some good teams. Here's what I found:

Averages per game
Season​
i50s
i50s Agn
Goals
Goals Agn
Score Efficiency
Opp Score Efficiency
Games
2016​
54.0​
55.0​
13.5​
13.0​
24.9​
23.6​
22​
2017​
52.9​
55.2​
13.2​
15.0​
24.9​
27.2​
22​
2018​
52.1​
52.7​
13.0​
11.8​
24.8​
22.3​
22​
2019​
51.8​
51.0​
12.0​
12.0​
23.2​
23.6​
22​
2020​
39.1​
45.0​
7.3​
10.0​
18.6​
22.2​
17​
2021​
47.3​
54.8​
9.5​
13.6​
20.2​
24.8​
22​
2022​
43.5​
62.7​
8.8​
15.9​
20.1​
25.3​
22​
2023​
46.8​
58.4​
10.6​
14.7​
22.6​
25.2​
23​
2024​
51.3​
55.7​
12.0​
17.7​
23.4​
31.7​
3​

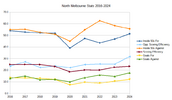
In graphical form:

1711765116265.png

Opposition scoring efficiency is killing us. Clearly, we are not defending well enough, that is obvious. However, our offensive output has improved and that is encouraging. We are getting the ball inside our 50 more often. We need to find a way to prevent the opposition hurting us on the rebound. These stats show that. However, we are back up at 2016 levels of offence, which was when we last played finals.

Hoping that others of a stats mindset will post here too, in future. Mods please merge if there is already such a thread.
 
Okay. So during the game yesterday I noticed that our inside 50 count wasn't too bad and was close to our opponent's. I also recall that in round 2 we smashed them in this area but still lost. I was curious to know how we're tracking because it FEELS like we are playing better this year, but just facing some good teams. Here's what I found:

Averages per game
Season​
i50s
i50s Agn
Goals
Goals Agn
Score Efficiency
Opp Score Efficiency
Games
2016​
54.0​
55.0​
13.5​
13.0​
24.9​
23.6​
22​
2017​
52.9​
55.2​
13.2​
15.0​
24.9​
27.2​
22​
2018​
52.1​
52.7​
13.0​
11.8​
24.8​
22.3​
22​
2019​
51.8​
51.0​
12.0​
12.0​
23.2​
23.6​
22​
2020​
39.1​
45.0​
7.3​
10.0​
18.6​
22.2​
17​
2021​
47.3​
54.8​
9.5​
13.6​
20.2​
24.8​
22​
2022​
43.5​
62.7​
8.8​
15.9​
20.1​
25.3​
22​
2023​
46.8​
58.4​
10.6​
14.7​
22.6​
25.2​
23​
2024​
51.3​
55.7​
12.0​
17.7​
23.4​
31.7​
3​

In graphical form:

View attachment 1944033

Opposition scoring efficiency is killing us. Clearly, we are not defending well enough, that is obvious. However, our offensive output has improved and that is encouraging. We are getting the ball inside our 50 more often. We need to find a way to prevent the opposition hurting us on the rebound. These stats show that. However, we are back up at 2016 levels of offence, which was when we last played finals.

Hoping that others of a stats mindset will post here too, in future. Mods please merge if there is already such a thread.
It hasn't helped that we have come up against GWS and Carlton in the first three weeks, two of the better offensive units and probably two of our worst defensive match ups.

Perhaps Geelong with Cameron and Hawkins would be the third team we may struggle with and we have them in a fortnight.
 
Okay. So during the game yesterday I noticed that our inside 50 count wasn't too bad and was close to our opponent's. I also recall that in round 2 we smashed them in this area but still lost. I was curious to know how we're tracking because it FEELS like we are playing better this year, but just facing some good teams. Here's what I found:

Averages per game
Season​
i50s
i50s Agn
Goals
Goals Agn
Score Efficiency
Opp Score Efficiency
Games
2016​
54.0​
55.0​
13.5​
13.0​
24.9​
23.6​
22​
2017​
52.9​
55.2​
13.2​
15.0​
24.9​
27.2​
22​
2018​
52.1​
52.7​
13.0​
11.8​
24.8​
22.3​
22​
2019​
51.8​
51.0​
12.0​
12.0​
23.2​
23.6​
22​
2020​
39.1​
45.0​
7.3​
10.0​
18.6​
22.2​
17​
2021​
47.3​
54.8​
9.5​
13.6​
20.2​
24.8​
22​
2022​
43.5​
62.7​
8.8​
15.9​
20.1​
25.3​
22​
2023​
46.8​
58.4​
10.6​
14.7​
22.6​
25.2​
23​
2024​
51.3​
55.7​
12.0​
17.7​
23.4​
31.7​
3​

In graphical form:

View attachment 1944033

Opposition scoring efficiency is killing us. Clearly, we are not defending well enough, that is obvious. However, our offensive output has improved and that is encouraging. We are getting the ball inside our 50 more often. We need to find a way to prevent the opposition hurting us on the rebound. These stats show that. However, we are back up at 2016 levels of offence, which was when we last played finals.

Hoping that others of a stats mindset will post here too, in future. Mods please merge if there is already such a thread.
Admittedly only a small sample size this year, but having played two top 4 teams from last year you'd have to say the first three categories are promising.
 

Log in to remove this ad.

Inside 50 differential (i50For minus i50Against) is a telling category.

2016 -1.0
2017 -2.3
2018 -0.6
2019 +0.8
2020 -5.7
2021 -7.5
2022 -19.2
2023 -11.6
2024 -4.2

Small sample size, I agree. But we've played 3 top teams so far in 2024 and we have the best result in this area since 2019. A good sign that things are turning.
 
More statistics from the past 9 seasons (including 3 games so far this year):

CP/gm​
UP/gm​
CL/gm​
TO/gm​
TO%​
2016​
149.6​
231.1​
38.8​
49.7​
13.0​
2017​
139.6​
228.7​
35.9​
51.8​
14.1​
2018​
148.6​
220.6​
34.7​
56.0​
15.2​
2019​
145.5​
231.4​
51.8​
53.5​
14.2​
2020​
118.8​
176.5​
29.8​
47.2​
16.0​
2021​
123.1​
226.4​
33.0​
59.8​
17.1​
2022​
127.7​
199.9​
36.4​
61.6​
18.8​
2023​
129.0​
219.9​
36.1​
57.9​
16.6​
2024​
120.3​
215.7​
37.7​
64.3​
19.1​

CP=Contested Possessions, UP=Uncontested Possessions, CL=Clearances, TO=Turnovers, TO%=percentage of possessions turned over

The turnover percentage in 2024 is the most alarming stat. I would say that this is partially because we are not hitting targets inside 50. It's partially a reflection of strong defences (GWS & Freo mostly) but also being less organised going forward. We know that our inside 50s are up, but we don't have a good working system going forward, nor a settled forward line.

With round 4 coming up, maybe a few marking types would help in our forward line. Sellars and/or Maley. Additionally, we need to turn it over less, through whatever magic we can come up with over the next few rounds.
Our attempts to play a faster, riskier, more aggressive style of offense would be a big reason for the higher turnover numbers, it will be interesting to see if those numbers drop as the team gains experience with each other and understands their capabilities a little more.

I don't know if it's possible, but I would like to see a comparison of our quarters because we are very competitive in the first and second quarters, but we seem to play a different game in the third before showing some fight in the fourth, I would love to know where the drop off is occurring and whether we see any resolution over the remaining rounds of the season.
 
Last edited:
Powell is rated the 7th best player in the comp by WheELO.

What might be hiding in those stats after Powelly that's super exciting is that LDU is rated 30th, X is rated 35th.

Even MORE exciting is that Sheezel and Wardlaw are 42 & 43. Ahead of Gulden, Brayshaw, Anderson, Miller, Bailey, McCluggage, Holmes and Dangerfield. They are the youngest players in the top 50 by a full year. The next best 20 year old is Cam McKenzie from Hawthorn, ranked around 106.
 

Remove this Banner Ad

Back
Top