Administration - The AFL v NRL *Moderator Approved* - Rules in OP

Remove this Banner Ad

Status
Not open for further replies.
Costs associated with running an aleague club are assumed to be far less than that associated with running an AFL club. For one, the Salary Cap is a quarter of an AFL club.
I am sure they are.

But one would hope that the A League weren't planning on having clubs just get by, but planning for there clubs to big powerful clubs. I mean really AFL/A league/NRL clubs could get by in a lot of places where they aren't because you want good clubs growing whichever game not just getting by.
 
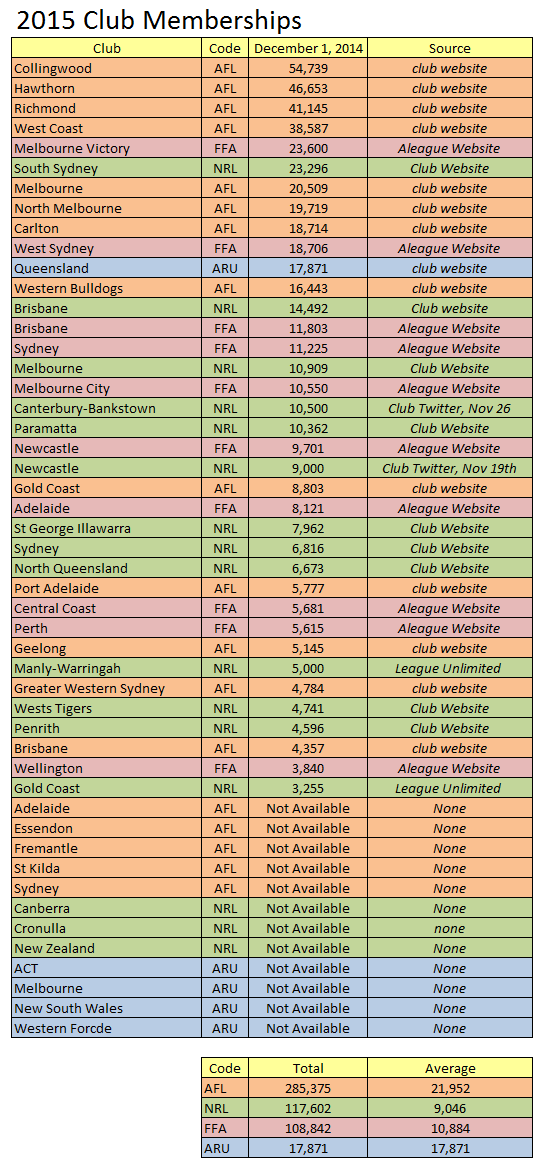
2015members01122014.png
 

Log in to remove this ad.

from where they were what souths have done post Russell has been huge.

I am surprised that so many nufty clubs have sold more memberships then carlton. I thought carlton was a way bigger club then numpties like Melbourne or North.
 
from where they were what souths have done post Russell has been huge.

I am surprised that so many nufty clubs have sold more memberships then carlton. I thought carlton was a way bigger club then numpties like Melbourne or North.

At this stage its all about when the auto-renewals take affect as to member levels. Also I think clubs such as Melbourne start earlier in the year to generate interest for the next year as sadly their seasons have been over very quickly recently.
 
Yes, obviously I know that, most premierships etc, but they were kicked out of the comp for a couple of years and have had to work their way up to a good number (for NRL) off what would have been a relatively small number.
they had a heap, of celebrity & powerful business men take the NRL to court to be allowed back in the comp, which is the only real reason why they are back
 

(Log in to remove this ad.)

SBS are paying something aren't they? Can't imagine it would be too much given they could get a similar audience with Inspector Rex reruns. I assume the FFA do it just to get it on FTA TV and increase exposure, and fair enough too.
Surely sbs can't justify keeping soccer on their main channel if it continues to pull fewer than 100k viewers. The network is meant to provide a service to non-English speakers, not be a sports platform.
 
AFL V NRL Google Search in 2014

NSW 18:50 = 0.38
Vic 51:5 = 10.2
Qld 25:49 = 0.51
SA 54:4 = 13.5
WA 54:6 = 9.0
Tas 52:3 = 17.3
NT (no info)
ACT 47:41 = 1.15
Australia 46:29 =1.59

What's important here are the ratio results, as this represents the multiple of which AFL was searched for in comparison to NRL in each region.

The ratio values themselves are derived from assigning the peak search week (AFL or NRL) for each region the number 100 and then determining an average based on that. There is no correlation between values from one region to another.


AFL Google Search state popularity
  1. Vic = 100
  2. Tas = 95
  3. SA = 91
  4. WA = 72
  5. NT = 68
  6. ACT = 34
  7. Qld = 24
  8. NSW = 22

NRL Google Search state popularity
  1. NSW = 100
  2. Qld = 72
  3. ACT = 46
  4. NT = 39
  5. Vic = 13
  6. WA = 12
  7. SA = 11
  8. Tas = 11

Numbers represent search volume relative to the highest state which is always 100. The data is normalised which means that sets of search data are divided by total searches so regions with the most search volume aren't necessarily on top.

That is a huge difference especially when you compare Victoria for the NRL and NSW and QLD for the AFL. It shows that the AFL is doing much better in our expansion states than the NRL is doing in their expansion state.
 
That is a huge difference especially when you compare Victoria for the NRL and NSW and QLD for the AFL. It shows that the AFL is doing much better in our expansion states than the NRL is doing in their expansion state.

Of course it is, although I don't see NSW or QLD as expansion states, you've had leg ups the Storm and Rugby league could only dream of and are 20 years ahead of where RL is here.
 
Status
Not open for further replies.

Remove this Banner Ad

Back
Top