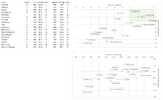
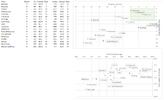
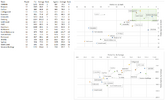
Should be average points (based on Ess and GC only playing 6 games).Try to reverse engineer their chart, it kind of looks similar but I think they also scale the points differential between teams. Not sure how to do that in excel.
View attachment 2300136
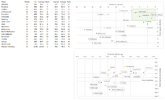
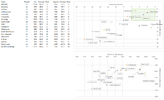
Edit, Chart based on points not rank.
View attachment 2300174
But still clearly skewed by the teams that have had multiple games against Richmond, West Coast, North and Carlton, and those who have played none or only one of those teams.


