Other Strategy, Playbooks, Schemes, Formations, Tactics, Coaching & Philosophy

Remove this Banner Ad

Log in to remove this ad.

(Log in to remove this ad.)

Interesting thought process....


And me chipping in....


Possibly portends more the demise of the HB than a change in the WR. Already the HB in recent years had become devalued, the 1st round grinder replaced by a committee approach of mid to late rounders on the cheap.

If teams start drafting their own Deebos more and more, YAC WRs able to run like RBs...then we may see the HB phased out. Especially in this pass happy league. Where this type of WR is semi-permanently lined up at HB...running most of his routes from there, carrying the ball, occasionally motioning out to the slot.

Still have your traditional WRs, and various types -- the downfield burner, the underneath chain mover, the big bodied redzone threat, the technician running the full route tree.

Then you may have your new "HB" -- Deebo Samuel, Laviska Shenault, Antonio Gibson, Cordarelle Patterson, off the top of my head.

Not all teams may do this....still your Henry, Taylor, and such, existing, teams staying traditional. But other teams re-envisioning the HB position.

Just hazarding a guess.


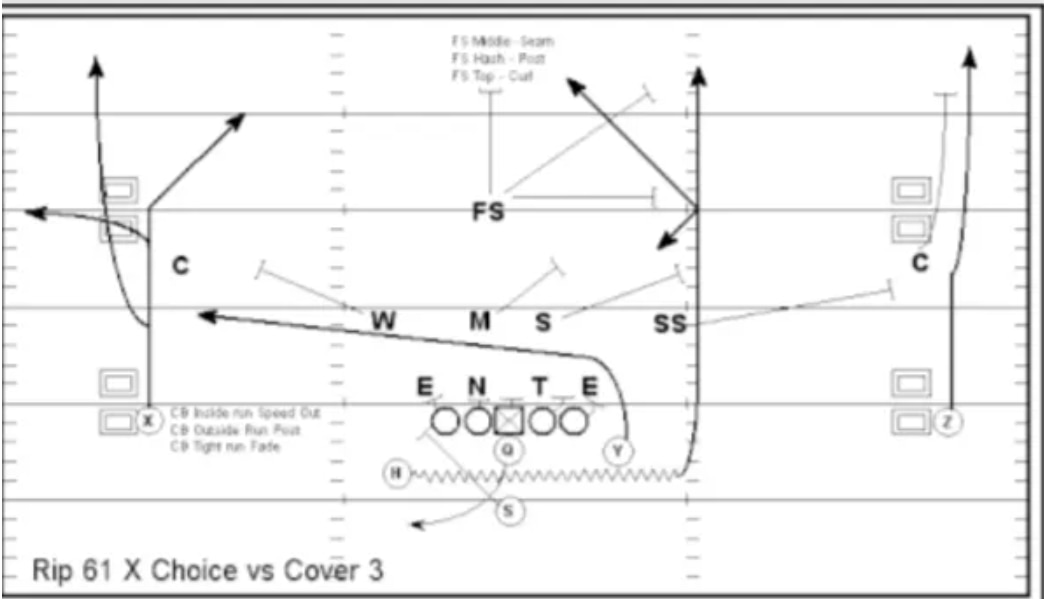
Adding versatility to a ‘chess piece’ (player), allows more strategic options. With the rise of receiving TE, you could potentially have a team put in 2xTE, 2WR & 1WR/HB and line up with an empty backfield…. IF the other team has gone DB heavy, change to a 2 WR formation and run between the tackles. IF the defence is in a run stopping mode, then just play empty backfield.

Just another way of exploring coverages or lack there of.
 
WRs that can throw like a QB should be a more regular thing rather than a gimmick play/deep heave here and there. The amount of plays you could run off a lateral to a person who can throw a football as well as a QB would be endless. Would seriously * defences up to have the threat of two players who can execute all sorts of throws on the field at once.
 
HB wont die because you wont be running those WR types inside zone 15 plays a game. Its also why RB's are now used more and more in the pass game, they dont have a pass playbook of 5 routes anymore they have more concepts and routes then ever.
 
A tracking system is installed in every NFL venue which is composed of:
  • 20–30 ultra-wide band receivers
  • 2–3 radio-frequency identification (RFID) tags installed into the players’ shoulder pads
  • RFID tags on officials, pylons, sticks, chains, and in the ball
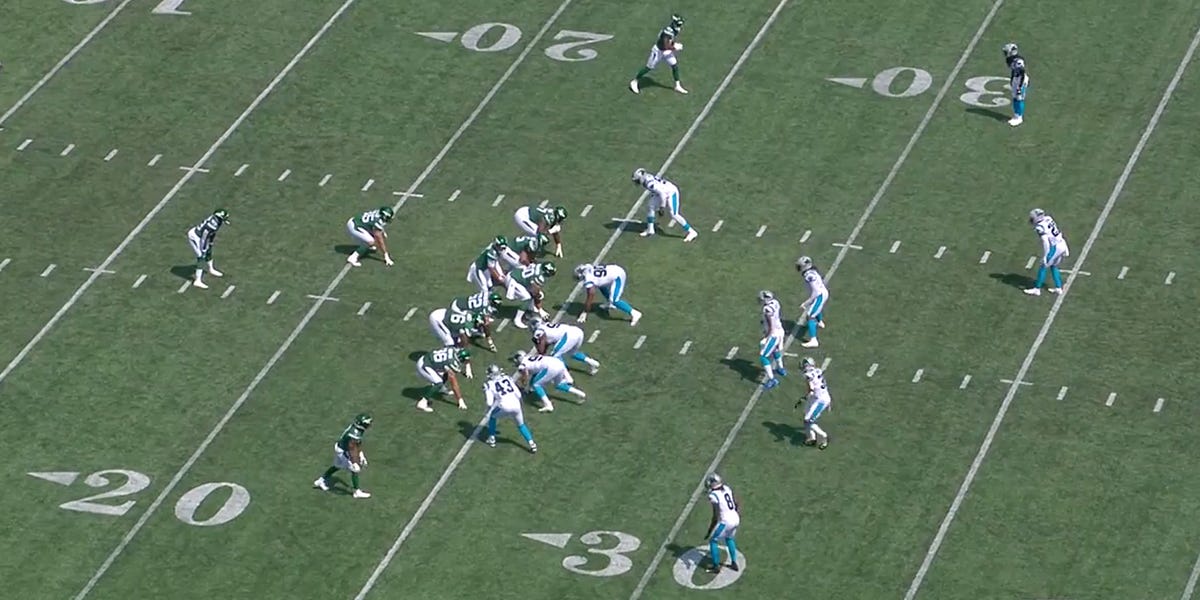
I don't know if this has been discussed before but the use of UWB (Ultra wideband) location technology in the NFL would likely make it a lot more easier for NFL teams to analyze formations and trends for each team. I don't know how much data is shared by the teams as I would assume such data would be team sensitive. The web page for NFL next gen stats say "the 32 clubs can look for ways to use data to assist in game planning"

At the very least NFL next gen stats gets access to the data and I would assume that TV would have access to the data during and after each telecast


I'm pretty sure the data that is presented in AFL games in the form of heat maps for various players is sourced from similar technology.
 
You would imagine teams would have limited access to the 31 other teams data, a bit more than what the live broadcasts get and is shown on the public NGS site, but full access to their own.
It seems like broadcasters have a bit more data for shows like the ESPN Match up show and NFL Networks Playbook.

I tried to click on the link to the NGS Glossary but the link is broken.
This is what I see at NGS | NFL Next Gen Stats:

What is Next Gen Stats?​

NFL player tracking, also known as Next Gen Stats, is the capture of real time location data, speed and acceleration for every player, every play on every inch of the field. Sensors throughout the stadium track tags placed on players' shoulder pads, charting individual movements within inches.


Passing Stats​

Time To Throw (TT)Time to Throw measures the average amount of time elapsed from the time of snap to throw on every pass attempt for a passer (sacks excluded).Average Completed Air Yards (CAY) and Average Intended Air Yards (IAY)Air Yards is the vertical yards on a pass attempt at the moment the ball is caught in relation to the line of scrimmage. CAY shows the average Air Yards a passer throws on completions, and IAY shows the average Air Yards a passer throws on all attempts. This metric shows how far the ball is being thrown ‘downfield’. Air Yards is recorded as a negative value when the pass is behind the Line of Scrimmage. Additionally Air Yards is calculated into the back of the end zone to better evaluate the true depth of the pass.Average Air Yards Differential (AYD)Air Yards Differential is calculated by subtracting the passer’s average Intended Air Yards from his average Completed Air Yards. This stat indicates if he is on average attempting deep passes than he on average completes.Longest Completed Air Distance (LCAD)Air Distance is the amount of yards the ball has traveled on a pass, from the point of release to the point of reception (as the crow flies). Unlike Air Yards, Air Distance measures the actual distance the passer throws the ball.Aggressiveness (AGG%)Aggressiveness tracks the amount of passing attempts a quarterback makes that are into tight coverage, where there is a defender within 1 yard or less of the receiver at the time of completion or incompletion. AGG is shown as a % of attempts into tight windows over all passing attempts.Air Yards to the Sticks (AYTS)Air Yards to the Sticks shows the amount of Air Yards ahead or behind the first down marker on all attempts for a passer. The metric indicates if the passer is attempting his passes past the 1st down marker, or if he is relying on his skill position players to make yards after catch.Completion ProbabilityThe probability of a pass completion, based on numerous factors such as receiver separation from the nearest defender, where the receiver is on the field, the separation the passer had at time of throw from the nearest pass rusher, and more.Expected Completion Percentage (xCOMP)Using a passer’s Completion Probability on every play, determine what a passer’s completion percentage is expected to be.Completion Percentage Above Expectation (+/-)A passer’s actual completion percentage compared to their Expected Completion Percentage.

Rushing Stats​

Efficiency (EFF)Rushing efficiency is calculated by taking the total distance a player traveled on rushing plays as a ball carrier according to Next Gen Stats (measured in yards) per rushing yards gained. The lower the number, the more of a North/South runner.8+ Defenders in the Box (8+D%)On every play, Next Gen Stats calculates how many defenders are stacked in the box at snap. Using that logic, DIB% calculates how often does a rusher see 8 or more defenders in the box against them.Avg Time Behind Line Of Scrimmage (TLOS)Next Gen Stats measures the amount of time a ball carrier spends (measured to the 10th of a second) before crossing the Line of Scrimmage. TLOS is the average time behind the LOS on all rushing plays where the player is the rusher.

Receiving Stats (WR’s and TE’s)​

Average Cushion (CUSH)The distance (in yards) measured between a WR/TE and the defender they’re lined up against at the time of snap on all targets.Average Separation (SEP)The distance (in yards) measured between a WR/TE and the nearest defender at the time of catch or incompletion.Average Targeted Air Yards (TAY)The average passing air yards per target for the receiver, by measuring the yards downfield at the time of all passing attempts that the receiver is the target. This stat indicates how far down the field they are being targeted on average.% Share of Team's Air Yards (TAY%)The sum of the receivers total intended air yards (all attempts) over the sum of his team’s total intended air yards. Represented as a percentage, this statistic represents how much of a team’s deep yards does the player account for.Yards After Catch (YAC)The yards gained after catch by a receiver.Expected Yards After Catch (xYAC)The expected yards after catch, based on numerous factors using tracking data such as how open the receiver is, how fast they’re traveling, how many defenders/blockers are in space, etcYAC Above Expectation (+/-)A receiver’s YAC compared to their Expected YAC.

Top Plays​

Fastest Ball CarriersFastest Ball Carriers shows the maximum speed, measured in Miles Per Hour (MPH), a player achieves on a given play when carrying the ball on offense (rusher, passer or receiver) or special teams (punt or kick returner). This stat highlights many of the fastest players in the league.Longest Plays (Ball Carriers)Longest Plays shows ball carriers that have travelled the farthest during a given play (measured in yards) regardless of yards gained. This stat highlights ball carriers that use the whole field.Fastest SacksNext Gen Stats measures the amount of time that elapses from the moment the ball is snapped, to the moment a defender sacks the quarterback. Represented in seconds, Fastest Sacks highlights defenders with some of the best instincts in the League.Longest TacklesA defensive player’s hustle can go unnoticed on the field. Longest Tackles measures the actual distance (in yards) a defender covered on a play to make a tackle. This stat reveals players who don’t give up on plays, and can also indicate players who can truly cover “sideline to sideline”.
 

Remove this Banner Ad

Back
Top