
Is there anything more Port Adelaide than finishing top of the ladder with the highest clearance differential, and then spending the next pre-season coming up with a gameplan built around losing the clearances.
Navigation
Install the app
How to install the app on iOS
Follow along with the video below to see how to install our site as a web app on your home screen.
Note: This feature may not be available in some browsers.
More options
-
 BigFooty Tipping Notice Img
Weekly Prize - Join Any Time - Tip Round 9
The Golden Ticket - MCG and Marvel Medallion Club tickets and Corporate Box tickets at the Gabba, MCG and Marvel.
Round 8 Winner: bearweger
You are using an out of date browser. It may not display this or other websites correctly.
You should upgrade or use an alternative browser.
You should upgrade or use an alternative browser.
Resource 2021 Stats Thread
- Thread starter JakeNeadeFan
- Start date
- Tagged users None
JakeNeadeFan
Premiership Player
- Nov 25, 2019
- 4,431
- 8,770
- AFL Club
- Port Adelaide
- Thread starter
- #27
What do you mean by "greatness"? I usually see that term used to describe a player who has been excellent over a long period of time (e.g. their whole career), but not necessarily at this instant in time.So you want Tex Walker elevated to greatness because he has had a good 10 games? Great players aren't great for a couple of weeks, they are great for a sustained period. That's what they are trying to show over 40 games.
For example, I would consider Buddy as a "great" player, but at this point in time I probably wouldn't rank him as one of the top footballers in the league. Conversely, no I would not say the Walker is a "great" player, but certainly at this point in time he is arguably the most dominant key forward.
When you are ranking players the intention, as I perceive it, is to assess the quality of one player compared to their peers at this point in time. Not last season, not five years ago, and not over the past ten years. And yes, to some extent you cannot make that evaluation on a small set of games, but equally you cannot make that assessment on games that were over a year ago. I don't think a game that Charlie Dixon played 2 years ago should be used to assess his quality now. It is irrelevant.
To illustrate the how ridiculous this approach is, a major driver of Dixon going up the ranking is poor games dropping out of his assessment period from 2019. So in effect the system is valuing him more highly because we are further away from 2019.
RussellEbertHandball
Flick pass expert
You can evaluate players at a point in time and over a career or in this case, a chunk of a career. 40 games is a decent mix of both to rank a floating 800 players a season.What do you mean by "greatness"? I usually see that term used to describe a player who has been excellent over a long period of time (e.g. their whole career), but not necessarily at this instant in time.
For example, I would consider Buddy as a "great" player, but at this point in time I probably wouldn't rank him as one of the top footballers in the league. Conversely, no I would not say the Walker is a "great" player, but certainly at this point in time he is arguably the most dominant key forward.
When you are ranking players the intention, as I perceive it, is to assess the quality of one player compared to their peers at this point in time. Not last season, not five years ago, and not over the past ten years. And yes, to some extent you cannot make that evaluation on a small set of games, but equally you cannot make that assessment on games that were over a year ago. I don't think a game that Charlie Dixon played 2 years ago should be used to assess his quality now. It is irrelevant.
To illustrate the how ridiculous this approach is, a major driver of Dixon going up the ranking is poor games dropping out of his assessment period from 2019. So in effect the system is valuing him more highly because we are further away from 2019.
So DBJ is s**t the moment and that's how we should assess him and completely forget he was an All Australian last years and near all oz player the year before. That's goldfish memory stuff.
JakeNeadeFan
Premiership Player
- Nov 25, 2019
- 4,431
- 8,770
- AFL Club
- Port Adelaide
- Thread starter
- #29
Yes he should be rated badly.You can evaluate players at a point in time and over a career or in this case, a chunk of a career. 40 games is a decent mix of both to rank a floating 800 players a season.
So DBJ is sh*t the moment and that's how we should assess him and completely forget he was an All Australian last years and near all oz player the year before. That's goldfish memory stuff.
Agree to disagree. Beauty is in the eye of the beholder.
Nicks' half time address must be pure gold.Adelaide is still yet to win a Q3
RussellEbertHandball
Flick pass expert
Rd 11 2021 team ratings

After we the 2020 season.have to use webarchive to get this page's imprint.

Port Adelaide Power Football Club AFL Statistics Home Page
Port Adelaide Power Football Club AFL Statistics Home Page
www.footywire.com

After we the 2020 season.have to use webarchive to get this page's imprint.
Port Adelaide Power Football Club AFL Statistics Home Page
Port Adelaide Power Football Club AFL Statistics Home Page
web.archive.org

Drew's last month of footy ranks him 21st of 324 players who have played at least 3 games.
I have never paid attention to the AFL ratings before and don't claim to understand how they arrive at their ratings. This I don't understand at all:
So -
1. top 5 Crows players all rank above every port player except Boak, our number one ranked player.
2. Amon, who has 21 AFLCA votes can't get a look in the top 5 above Drew who has 2 votes
3. Ben Seedsman is ranked 6 positions above Ollie Wines who must easily be in the top 5 most likely to win the Brownlow.
Hmmm...
I have never paid attention to the AFL ratings before and don't claim to understand how they arrive at their ratings. This I don't understand at all:
View attachment 1169421
So -
1. top 5 Crows players all rank above every port player except Boak, our number one ranked player.
2. Amon, who has 21 AFLCA votes can't get a look in the top 5 above Drew who has 2 votes
3. Ben Seedsman is ranked 6 positions above Ollie Wines who must easily be in the top 5 most likely to win the Brownlow.
Hmmm...
I have never paid attention to the AFL ratings before
RussellEbertHandball
Flick pass expert
I know Rd 16 has started but this is at end of Rd 15.
 www.matterofstats.com
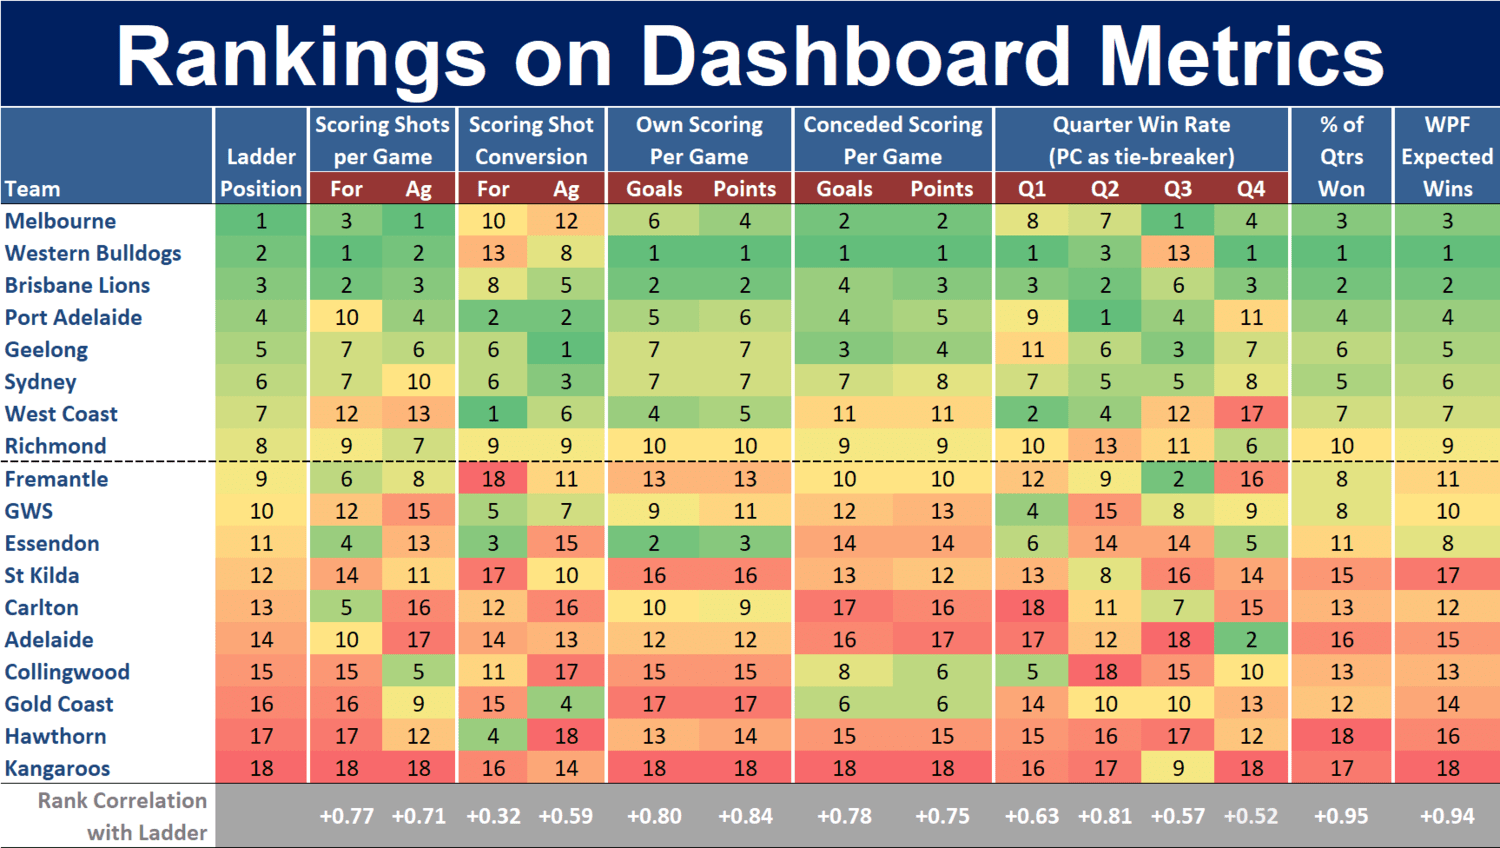
Below is the latest Ranking on Dashboard Metrics data, which shows, amongst other things, that:

The full Team Dashboard appears below, a few of the interesting things from which are that:

GremioPower I have blown up the middle table as it shows our goals / (goals+pts) at 56.8% conversion is second only tp WCE who have 3 tall forwards who have good set shot conversion rates and are fist with 58.4%
We either are good at forcing our oppo to take tough shots, or push it thru for pts or lucky but our opposition has the second worst conversion rate of 48.3% and Geelong are first at 47.3%.
It is a bit worrying that we are 10th for scoring shots per game but i guess as long as we keep the oppo to 4th worst it balances things out.

MatterOfStats 2021 : Team Dashboard for Round 15 — Matter of Stats
Below is the latest Ranking on Dashboard Metrics data, which shows, amongst other things, that: The teams that are 4th, 5th and 6th on Scoring Shot generation are all outside the Top 8 on the ladder The teams that are 3rd, 4th and 5th on Scoring Shot Conversion are all outside the Top 8 on the
www.matterofstats.com
Below is the latest Ranking on Dashboard Metrics data, which shows, amongst other things, that:
- The teams that are 4th, 5th and 6th on Scoring Shot generation are all outside the Top 8 on the ladder
- The teams that are 3rd, 4th and 5th on Scoring Shot Conversion are all outside the Top 8 on the ladder (and the team that’s 18th is currently 9th on the ladder)
- The team that is 3rd on Points Scored is in 11th spot on the ladder
- The team with the second-worst Q4 record currently sits in 7th spot on the ladder

The full Team Dashboard appears below, a few of the interesting things from which are that:
- West Coast have scored 32% of their points in Q2s
- Carlton have scored 18% of their points in Q4s
- West Coast have recorded 58.4% of their Scoring Shots as goals, Fremantle only 46.5%
- Hawthorn’s opponents have registered 55.6% of their Scoring Shots as goals, Geelong’s only 47.3%
- Gold Coast, Hawthorn, and North Melbourne are the only teams to have been outscored by their opponents in each of the four quarters considered separately
- Brisbane Lions, Melbourne, and Port Adelaide are the only teams to have outscored their opponents in each of the four quarters considered separately
- Western Bulldogs have outscored their opponents by over 2:1 in Q4s, but been narrowly outscored by them in Q3s
- Adelaide have the 2nd-best Q4 record in the competition
- Hawthorn have won only 18 quarters all season. Brisbane Lions and Western Bulldogs have each won exactly twice as many as Hawthorn

GremioPower I have blown up the middle table as it shows our goals / (goals+pts) at 56.8% conversion is second only tp WCE who have 3 tall forwards who have good set shot conversion rates and are fist with 58.4%
We either are good at forcing our oppo to take tough shots, or push it thru for pts or lucky but our opposition has the second worst conversion rate of 48.3% and Geelong are first at 47.3%.
It is a bit worrying that we are 10th for scoring shots per game but i guess as long as we keep the oppo to 4th worst it balances things out.

GremioPower
Taking notes of policy re: bikini/lingerie images
- May 26, 2017
- 21,001
- 43,287
- AFL Club
- Port Adelaide
- Other Teams
- Grêmio, DC United, Pistons
RussellEbertHandball, our slow starts and, more often, slow finishes can be seen in the bottom of the second image:
Q1 - 09th (W, 50%; Pts, 104%)
Q2 - 01st (W, 71%; Pts, 150%)
Q3 - 04th (W, 71%; Pts, 137%)
Q4 - 11th (W, 46%; Pts, 105%)
Oddly enough, if I understood the table correctly, our score distribution is somewhat balanced: 24-28-25-23. The difference for us, then, seems to be more in the defensive side of things.
Is it possible to see the distribution of Pts Against? Or do those numbers consider both for and against, instead?
RussellEbertHandball
Flick pass expert
Not that website.RussellEbertHandball, our slow starts and, more often, slow finishes can be seen in the bottom of the second image:
Q1 - 09th (W, 50%; Pts, 104%)
Q2 - 01st (W, 71%; Pts, 150%)
Q3 - 04th (W, 71%; Pts, 137%)
Q4 - 11th (W, 46%; Pts, 105%)
Oddly enough, if I understood the table correctly, our score distribution is somewhat balanced: 24-28-25-23. The difference for us, then, seems to be more in the defensive side of things.
Is it possible to see the distribution of Pts Against? Or do those numbers consider both for and against, instead?
Does this site provide what info you want but will have to do the quarter calculation manually? Click on the Quarter Statistics tab on this page and any team page
2021 Port Adelaide Team Page - FinalSiren.com
AFL football statistics on AFL teams, games and players.
finalsiren.com
GremioPower
Taking notes of policy re: bikini/lingerie images
- May 26, 2017
- 21,001
- 43,287
- AFL Club
- Port Adelaide
- Other Teams
- Grêmio, DC United, Pistons
RussellEbertHandball, there seems to be also a great correlation between the Scoring-Shot-Differential Ladder (C) and the Minor-Round Ladder — greater than between the Conversation-Rate-Differential Ladder (F) and the Minor-Round Ladder, for instance.
So, yes, it looks as if, ultimately, things do balance out in that regard.
So, yes, it looks as if, ultimately, things do balance out in that regard.
GremioPower
Taking notes of policy re: bikini/lingerie images
- May 26, 2017
- 21,001
- 43,287
- AFL Club
- Port Adelaide
- Other Teams
- Grêmio, DC United, Pistons
Have I read the distribution correctly? Is it only on Points For?Not that website.
Does this site provide what you want? Click on the Quarter Statistics tab on this page and any team page
2021 Port Adelaide Team Page - FinalSiren.com
AFL football statistics on AFL teams, games and players.finalsiren.com
RussellEbertHandball
Flick pass expert
Have I read the distribution correctly? Is it only on Points For?
Oppo have scored 990 points close enough to 1,000 points so in rounded terms its 28-23-22-26
GremioPower
Taking notes of policy re: bikini/lingerie images
- May 26, 2017
- 21,001
- 43,287
- AFL Club
- Port Adelaide
- Other Teams
- Grêmio, DC United, Pistons
The more I look into these matters, the less worried I get with behinds — at least, in the Minor Round. I can totally understand why we were so obsessed with forward pressure.
Excessive behinds might cost us a game or two, but in the end the side with most scoring shots wins way more often than not. Just keep the ball in our F50 and make it sure it crosses the endline. The rest usually will take care of itself.
Of course, conversation rates only makes it all even better. But that would be “Step 2.”
RussellEbertHandball
Flick pass expert
As I have written before the ratings punish you heavily if you fu** up and you get little points if you do the average thing as expected eg take an uncontested mark you don't get any points but do in Dream Team and Super Coach.I have never paid attention to the AFL ratings before and don't claim to understand how they arrive at their ratings. This I don't understand at all:
View attachment 1169421
So -
1. top 5 Crows players all rank above every port player except Boak, our number one ranked player.
2. Amon, who has 21 AFLCA votes can't get a look in the top 5 above Drew who has 2 votes
3. Ben Seedsman is ranked 6 positions above Ollie Wines who must easily be in the top 5 most likely to win the Brownlow.
Hmmm...
The spectacular things like kicking 50m or 60m goals as well as a lot of goals gets you more points than a goal from 15m. Spectacular marks get you the same pts as a standard contested mark.
Wines racks up a lot of clangers, kicks mainly, so he gets marked heavily with negative pts and his kicking has stopped him being graded as an elite player by CD despite having an elite rating for hardball gets.
Walker kicks a lot of long goals so he gets a lot of positive pts for that, he doesn't * up too many kicks to get negatives and he doesn't get negatives if he is a bit lazy and doesn't impact a contest.
CD data feeds this to the media and clubs and they use it as part of their analysis. This also goes to the All Oz selectors and they use it as part of their arguments for the players they are pushing.
Its also why CD does rankings by positions because they know those playing similar positions would get similar +ve and -ve pts for that position. It's also why every year CD come out with their elite or above average ratings for each position for each club, and most are reasonable ie elite is top 10% for that position ie key forward or mid fielder or general defender, but every year there are some players who get those high ratings and people say WTF, how is that guy considered elite.
It ain't perfect but its been a constant methodology with the odd tweak since 2012. I've said many times before that I'm sceptical of the algorithm but I found the document they published in 2013 earlier this year, and now understand better how it works. It has deficiencies but any system would as its done pretty close to real time.
The fact you don't hear the analysts at all the clubs either coming out publicly bagging the system or hear head or assistant coaches come out in public and say they are s**t and we totally ignore them, tells you that they use it as part of their analysis tools. Tom Mitchell might regularly get 35 disposal but if 18-20 are meaningless one two type handballs that will come out in these ratings.
In the collingwood game review thread I had a discussion with Sleezy between post #346 and #351 and cut and pasted some stuff from that 2013 document. See
Review - Rd 10 Port vs Collingwood
There are currently 65 players with a higher goals per game average than Todd this season. And 54 have kicked more goals than he has. If goals are not your thing, and you want a broader measure of contribution to scoring he is ranked 155th for score involvements per game. And if it is...
 www.bigfooty.com
The one glaring omission from the system is the undervaluation of defensive play. It seems to allocate a set number of ranking points to all the members of an offensive chain based on their influence on that offensive chain.As I have written before the ratings punish you heavily if you fu** up and you get little points if you do the average thing as expected eg take an uncontested mark you don't get any points but do in Dream Team and Super Coach.
The spectacular things like kicking 50m or 60m goals as well as a lot of goals gets you more points than a goal from 15m. Spectacular marks get you the same pts as a standard contested mark.
Wines racks up a lot of clangers, kicks mainly, so he gets marked heavily with negative pts and his kicking has stopped him being graded as an elite player by CD despite having an elite rating for hardball gets.
Walker kicks a lot of long goals so he gets a lot of positive pts for that, he doesn't fu** up too many kicks to get negatives and he doesn't get negatives if he is a bit lazy and doesn't impact a contest.
CD data feeds this to the media and clubs and they use it as part of their analysis. This also goes to the All Oz selectors and they use it as part of their arguments for the players they are pushing.
Its also why CD does rankings by positions because they know those playing similar positions would get similar +ve and -ve pts for that position. It's also why every year CD come out with their elite or above average ratings for each position for each club, and most are reasonable ie elite is top 10% for that position ie key forward or mid fielder or general defender, but every year there are some players who get those high ratings and people say WTF, how is that guy considered elite.
It ain't perfect but its been a constant methodology with the odd tweak since 2012. I've said many times before that I'm sceptical of the algorithm but I found the document they published in 2013 earlier this year, and now understand better how it works. It has deficiencies but any system would as its done pretty close to real time.
The fact you don't hear the analysts at all the clubs either coming out publicly bagging the system or hear head or assistant coaches come out in public and say they are sh*t and we totally ignore them, tells you that they use it as part of their analysis tools. Tom Mitchell might regularly get 35 disposal but if 18-20 are meaningless one two type handballs that will come out in these ratings.
In the collingwood game review thread I had a discussion with Sleezy between post #346 and #351 and cut and pasted some stuff from that 2013 document. See

Review - Rd 10 Port vs Collingwood
There are currently 65 players with a higher goals per game average than Todd this season. And 54 have kicked more goals than he has. If goals are not your thing, and you want a broader measure of contribution to scoring he is ranked 155th for score involvements per game. And if it is...
IMO defenders should gain ranking points for interrupting an offensive chain, with the points scaling based on the likelihood of an opposition goal being scored through that chain prior to the defenders action.
The way it's set up, it appears that players can lose points for messing up an offensive chain, but defender's don't gain points for defensive play as the points seem to be based solely on contribution to offensive chains.
At the very least, I'd like to see a defensive player's impact on their opponent's ranking for the game added to their score. IE - McKenize kept De Goey (Av 9.5 ranking points) to only 2 ranking point this year, so should gain 7.5 points for his defensive actions, in addition to his contribution to offensive chains for the game.
RussellEbertHandball
Flick pass expert
Have a read thru the 2013 document attached to see how defenders pick up pts.The one glaring omission from the system is the undervaluation of defensive play. It seems to allocate a set number of ranking points to all the members of an offensive chain based on their influence on that offensive chain.
IMO defenders should gain ranking points for interrupting an offensive chain, with the points scaling based on the likelihood of an opposition goal being scored through that chain prior to the defenders action.
The way it's set up, it appears that players can lose points for messing up an offensive chain, but defender's don't gain points for defensive play as the points seem to be based solely on contribution to offensive chains.
At the very least, I'd like to see a defensive player's impact on their opponent's ranking for the game added to their score. IE - McKenize kept De Goey (Av 9.5 ranking points) to only 2 ranking point this year, so should gain 7.5 points for his defensive actions, in addition to his contribution to offensive chains for the game.
Attachments
Interesting. It seems I'd misunderstood the way points are allocated. Defenders will always be undervalued in that system because of where they play. Defensive play so far from the offensive goal has an inherent disadvantage because of the negative equity of being so close to defensive goal.Have a read thru the 2013 document attached to see how defenders pick up pts.
The main weakness I see is that the equity distribution makes no distinction between a stationary marking contest and a situation where the defender makes the desperate lunging fingertip spoil. They are both counted as 'disposal to a marking contest'. The defender gets no credit for turning an uncontested possession into a contest. It's the disposer of the ball who who is penalised for kicking to a contest. The table detailing the application of pressure only refers to pressure on disposal, not pressure on the receiver, and the discussion of spoils only talks about the change in equity from marking contest to ground ball. I can't see any reference to the equity value of the most basic defensive act - creating the contest in the first place.
Makes me wonder how a goal saving touch on the goal line would be rated. From reading that, the opposition player who had the shot for goal would get the equity for a behind based on where they kicked it from. Would the defender get the equity from turning a goal (ie -6) to a behind and a kick-out, a set position disposal 140-160m from goal (-0.3, -1 for the behind), so +4.7? I doesn't seem like it.
Last edited:
GremioPower
Taking notes of policy re: bikini/lingerie images
- May 26, 2017
- 21,001
- 43,287
- AFL Club
- Port Adelaide
- Other Teams
- Grêmio, DC United, Pistons
Record against Top-4 sides (2016-2010) - including Finals

These are the 10 clubs that have finished the Minor Round in the Top-4 at least once in the previous 5 seasons.
The W-L record consider only matches between two Top-4 teams in any of the given seasons.
Rk = Ranking
Pts = Premiership Points
W% = Percentage of wins (considering draws as half-wins)
MP = Matches Played
Top-4 = # seasons in the Top-4
Last edited:
GremioPower
Taking notes of policy re: bikini/lingerie images
- May 26, 2017
- 21,001
- 43,287
- AFL Club
- Port Adelaide
- Other Teams
- Grêmio, DC United, Pistons
Record against Top-4 sides (2016-2010) - including Finals [II]
Considering the period, we have the 16th overall record against Top-4 sides.

Note: those 'W%' in yellow are all above average.
---
This is how our overall record from the period (2016-2020) was distributed:

I think this kind of distribution should be expected, but Port's looks too damn perfect!
Note: For a 22-game season, the equivalent record would vary depending on the double-ups and Port’s ladder position. The ground would be a 10-8 record (which puts us roughly within a 14-8/10-12 range).
*Overall, 10-8 (18)
Considering the period, we have the 16th overall record against Top-4 sides.

Note: those 'W%' in yellow are all above average.
---
This is how our overall record from the period (2016-2020) was distributed:
I think this kind of distribution should be expected, but Port's looks too damn perfect!
Note: For a 22-game season, the equivalent record would vary depending on the double-ups and Port’s ladder position. The ground would be a 10-8 record (which puts us roughly within a 14-8/10-12 range).
*Overall, 10-8 (18)
- v. Top-4, 0-4 (4)
- v. 5th-8th, 2-2 (4)
- v. Others, 8-2 (10)
Last edited:
GremioPower
Taking notes of policy re: bikini/lingerie images
- May 26, 2017
- 21,001
- 43,287
- AFL Club
- Port Adelaide
- Other Teams
- Grêmio, DC United, Pistons
I can see 5 levels:Record against Top-4 sides (2016-2010) - including Finals [II]
Considering the period, we have the 16th overall record against Top-4 sides.
View attachment 1172825
Note: those 'W%' in yellow are all above average.
---
This is how our overall record from the period was distributed:
View attachment 1172826
I think this kind of distribution should be expected, but Port's look too damn perfect!
Note: For a 22-game season, the equivalent record would vary depending on the double-ups and Port’s ladder position. The ground would be a 10-8 record (which puts us roughly within a 14-8/10-12 range).
*Overall, 10-8 (18)
- v. Top-4, 0-4 (4)- v. 5th-8th, 2-2 (4)- v. Others, 8-2 (10)
5. At the bottom, GC is on its own.
4. Next, there seems to be a group of 8 teams to which we belong: STK, NTH, BRI, MEL, CAR, FRE, ESS, and us.
3. Right above those, then come COL, HAW, and FOO.
2. The second-best group would be formed by SYD, WCE, GEE, and WL.
1. Finally, the best sides: RIC and GWS.
At least, considering the last 5 seasons, this would be the case.
Last edited:
RussellEbertHandball
Flick pass expert
Gee and WCE have played finals all 5 years, Richmond the last 4, GWS the first 4. Sydney have made finals in 3 years like WB and Coll, but they have a good history of being giant killers.
GremioPower
Taking notes of policy re: bikini/lingerie images
- May 26, 2017
- 21,001
- 43,287
- AFL Club
- Port Adelaide
- Other Teams
- Grêmio, DC United, Pistons
Giants seem to have totally blown it. Just 2 Top-4 indicates they have lost plenty of points they shouldn’t…Gee and WCE have played finals all 5 years, Richmond the last 4, GWS the first 4. Sydney have made finals in 3 years like WB and Coll, but they have a good history of being giant killers.
RossFC
Moderator
- Moderator
- #50
Marking stats for this season
Marks
1. Amon 101
2. Aliir 100
3. Jonas 91
4. Burton 76
5. Byrne-Jones 73
Marks inside 50
1. Dixon 68
2. Georgiades 67
3. Marshall 53
4. Gray 50
5. Fantasia 37
Contested marks
1. Dixon 42
2. Aliir 32
3. Georgiades 17
=4. Clurey and Marshall 16
Marks on lead
1. Georgaides 16
2. Fantasia 14
3. Dixon 13
4. Gray 12
=5. Wines and Motlop 8
Intercept marks
1. Aliir 45
2. Jonas 31
3. Clurey 24
=4. Burton and McKenzie 17
Similar threads
- Replies
- 11
- Views
- 1K
- Replies
- 700
- Views
- 22K
- Replies
- 6K
- Views
- 131K
- Replies
- 3
- Views
- 495
