Navigation
Install the app
How to install the app on iOS
Follow along with the video below to see how to install our site as a web app on your home screen.
Note: This feature may not be available in some browsers.
More options


You are using an out of date browser. It may not display this or other websites correctly.
You should upgrade or use an alternative browser.
You should upgrade or use an alternative browser.
Politics Benefits of mining in Australia?
- Thread starter hamohawk1
- Start date
- Tagged users None
read the report
- Norway has a larger net wealth factor tied up in real estate than Oz
- The report also highlights we have better wealth distribution
I would disagree with the report, i cannot see a stat on which they base their argument? what factors/assumptions are involved. The reports/stats that i can seeing say otherwise. Here is the ACOSS report.
http://www.acoss.org.au/wp-content/uploads/2015/06/Inequality_in_Australia_FINAL.pdf
Income inequality
• Inequality in Australia is higher than the OECD average.
• A person in the top 20% income group has around five times as much income as someone in the bottom 20%.
But as i said stats are meaningless, if italy ranks in the top 10, i dont need to go beyond that
Elroo
Premiership Player
- Jul 2, 2014
- 3,994
- 6,809
- AFL Club
- North Melbourne
again, others support my assessment
nothing from you? no numbers? no links? just chest puffing?
Nobody supports your rubbish that their is a 10% state based profit based royalty in place.
Nore does anyone support your clueless claims of converting the ad-valerom royalities into a 10% state based profit royalties.
As others have pointed out you're a known liar and a pest.
Power Raid
We Exist To Win Premierships
I would disagree with the report, i cannot see a stat on which they base their argument? what factors/assumptions are involved. The reports/stats that i can seeing say otherwise. Here is the ACOSS report.
http://www.acoss.org.au/wp-content/uploads/2015/06/Inequality_in_Australia_FINAL.pdf
I couldn't see norway
was it there?
Elroo
Premiership Player
- Jul 2, 2014
- 3,994
- 6,809
- AFL Club
- North Melbourne
Glad to see you're linking to Pietro Guj but the relevance?
Power Raid
We Exist To Win Premierships
Nobody supports your rubbish that their is a 10% state based profit based royalty in place.
Nore does anyone support your clueless claims of converting the ad-valerom royalities into a 10% state based profit royalties.
As others have pointed out you're a known liar and a pest.
lol........so you know the number has to be more than 5%. The FMG break down hows its less than 12% when normalised.
I called it 10%. your call? nothing but an emotional outburst!
feel free to come up with a number or continue too lose control of your emotions.
go on champ......take a punt!
lol
No, but norway is below OECD average, Australia is above.I couldn't see norway
was it there?
https://data.oecd.org/inequality/income-inequality.htm
Elroo
Premiership Player
- Jul 2, 2014
- 3,994
- 6,809
- AFL Club
- North Melbourne
lol........so you know the number has to be more than 5%. The FMG break down hows its less than 12% when normalised.
I called it 10%. your call? nothing but an emotional outburst!
feel free to come up with a number or continue too lose control of your emotions.
go on champ......take a punt!
lol
Ok champ you made a goose of youself again and got caught out lying.
Let me know when you understand the difference between the state based royalties and Commonwealth taxes on mining activities?
Power Raid
We Exist To Win Premierships
No, but norway is below OECD average, Australia is above.
https://data.oecd.org/inequality/income-inequality.htm
the wealth and wealth distribution stats tell a very different picture
Oz is wealthier with a higher mean and a much higher median. Wealth was chosen over income as the starting point was the $1 trillion dollar sovereign wealth fund.
http://usagainstgreed.org/GlobalWealthDatabook2013.pdf
the more recent report was posted earlier
Power Raid
We Exist To Win Premierships
Ok champ you made a goose of youself again and got caught out lying.
Let me know when you understand the difference between the state based royalties and Commonwealth taxes on mining activities?
giggle
all emotion no facts? no call on the estimated % of profit?
just more emotion and a deflection!
feel free to try
the wealth and wealth distribution stats tell a very different picture
Oz is wealthier with a higher mean and a much higher median. Wealth was chosen over income as the starting point was the $1 trillion dollar sovereign wealth fund.
http://usagainstgreed.org/GlobalWealthDatabook2013.pdf
the more recent report was posted earlier
Higher mean wealth is an useless stat mate, if Italy is in top 5, i do not need to look beyond that. Mean wealth has lots of factors contributing to this, including phony real estate growth which is nothing but paper wealth and will crash when the bubble pops. Also have you taken the 25 percent devaluation of the A$ into the stats?
Gini coefficient is widely accepted index in measuring income equality
Elroo
Premiership Player
- Jul 2, 2014
- 3,994
- 6,809
- AFL Club
- North Melbourne
giggle
all emotion no facts? no call on the estimated % or profit?
just more emotion and a deflection!
feel free to try
You're the usual struggler PR- you lied and tried to talk beyond your abilities.
Get back to me when you know about state mining taxes and Commonwealth taxes will you?
I'ii let Pietro know your linked to his paper; top bloke but any pest can link to it without knowing the contents.
Power Raid
We Exist To Win Premierships
Higher mean wealth is an useless stat mate, if Italy is in top 5, i do not need to look beyond that. Mean wealth has lots of factors contributing to this, including phony real estate growth which is nothing but paper wealth and will crash when the bubble pops. Also have you taken the 25 percent devaluation of the A$ into the stats?
Gini coefficient is widely accepted index in measuring income equality
doesn't gini just take into account the distribution and not the amount? thus its about inequality not wealth?
wouldn't median be the balance especially when bench marked off the mean?
Power Raid
We Exist To Win Premierships
You're the usual struggler PR- you lied and tried to talk beyond your abilities.
Get back to me when you know about state mining taxes and Commonwealth taxes will you?
I'ii let Pietro know your linked to his paper; top bloke but any pest can link to it without knowing the contents.
please provide your assessment if you think I lied? I called 10%
what is your call?
then consider the difference to the over all tax rate collected from federal, state and shire level and see if the difference is material.
but..............nothing!
Elroo
Premiership Player
- Jul 2, 2014
- 3,994
- 6,809
- AFL Club
- North Melbourne
please provide your assessment if you think I lied? I called 10%
what is your call?
then consider the difference to the over all tax rate collected from federal, state and shire level and see if the difference is material.
but..............nothing!
There is no 10% state based profit royalty in WA PR.
Once again you cannot compare a state based royalty which is the payment made to the community for the extraction of a non-renewable resource, with a profit based tax on the added value from downstream processing.
You cannot simply say here's a 10% royalty for extracting the resources, and therefore it equals a 10% profit based royalty system.
Show me were a Mineral Economist like Pietro supports your claims?
doesn't gini just take into account the distribution and not the amount? thus its about inequality not wealth?
wouldn't median be the balance especially when bench marked off the mean?
Problem with median is that it does not address the problem of outliers, but for something like income or you can say disposable income adjusted to PPP, what is meaningful in the curve and how much income is now being brought in overall and the shape of the curve of distribution of income.The problem with economics is that it does not use such data or do not use measures of outliers that integrate aggregate income. Hence you see Italy is above Germany cause Italian net median wealth is way higher than Germany.
For me to consider median data i would like to see distribution curves for the data on which the medians are calculated
Take this for example.
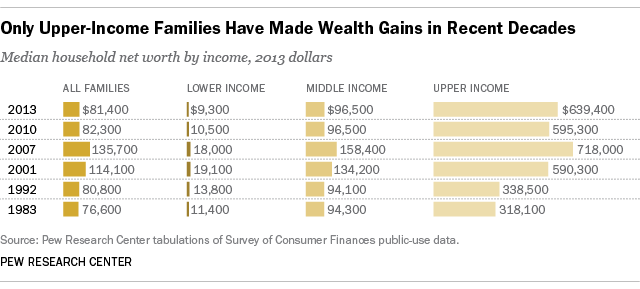
If you compare 1983 to 2013, you can see the median income for upper income class has doubled while the income for lower income families have fallen. While Middle class stayed the same. The middle class and lower class got wiped off in the housing crisis in 2007 (the point i was making regarding real estate, resulting in a substantial drop in median wealth of the country). The net result is an increase of median net worth overall, but it does not show you the real picture cause middle class and lower class have stagnated
Last edited:
Power Raid
We Exist To Win Premierships
There is no 10% state based profit royalty in WA PR.
Once again you cannot compare a state based royalty which is the payment made to the community for the extraction of a non-renewable resource, with a profit based tax on the added value from downstream processing.
You cannot simply say here's a 10% royalty for extracting the resources, and therefore it equals a 10% profit based royalty system.
Show me were a Mineral Economist like Pietro supports your claims?
Sure you can for the basis of a high level discussion. would you have preferred I converted corporate taxes to a mining royalty rate for the comparison rather than the other way around? would you have preferred to say its all to hard and not demonstrate we have effective taxes to compare to norway?
It is a "rough" guide. You're just upset that you felt the need to be 100% but precisely wrong.
Perhaps now that your sober you can relax and gain control of your emotions.
Last edited:
Power Raid
We Exist To Win Premierships
Problem with median is that it does not address the problem of outliers, but for something like income or you can say disposable income adjusted to PPP, what is meaningful in the curve and how much income is now being brought in overall and the shape of the curve of distribution of income.The problem with economics is that it does not use such data or do not use measures of outliers that integrate aggregate income. Hence you see Italy is above Germany cause Italian net median wealth is way higher than Germany.
For me to consider median data i would like to see distribution curves for the data on which the medians are calculated
Take this for example.

If you compare 1983 to 2013, you can see the median income for upper income class has doubled while the income for lower income families have fallen. While Middle class stayed the same. The middle class and lower class got wiped off in the housing crisis in 2007 (the point i was making regarding real estate, resulting in a substantial drop in median wealth of the country). The net result is an increase of median net worth overall, but it does not show you the real picture cause middle class and lower class have stagnated
Any ideas why norways median wealth is so low but the mean is high. Especially if their income disparity is so low?
Is it income shifting offshore? Tied up in property resulting in the same thing as above? Or other?
The disparity between median and mean is massive!
Elroo
Premiership Player
- Jul 2, 2014
- 3,994
- 6,809
- AFL Club
- North Melbourne
Sure you can for the basis of a high level discussion. would you have preferred I converted corporate taxes to a mining royalty rate for the comparison rather than the other way around? would you have preferred to say its all to hard and not demonstrate we have effective taxes to compare to norway?
It is a "rough" guide. You're just upset that you felt the need to be 100% but precisely wrong.
Perhaps now that your sober you can relax and gain control of your emotions.
Step back and take a deep breath before you make a goose of yourself again PR. Your repeated exposure as a liar pre-dates you posting here champ.
There is no such thing as "roughly" converting a state based royalty for the extraction of a non-renewable resource, with a profit based tax on the added value from downstream processing. Even if you had any understanding of mineral economics you'd know that.
Your inotital figures of simply lumping the 30% corporate tax rate along with th 10 % GST to somehow produce a 40% Commonwealth tax rates shows your out of your depth as usual.
As someone mentioned your just an ex-Navy Mullet who repeatedly lies.
Power Raid
We Exist To Win Premierships
Step back and take a deep breath before you make a goose of yourself again PR. Your repeated exposure as a liar pre-dates you posting here champ.
There is no such thing as "roughly" converting a state based royalty for the extraction of a non-renewable resource, with a profit based tax on the added value from downstream processing. Even if you had any understanding of mineral economics you'd know that.
Your inotital figures of simply lumping the 30% corporate tax rate along with th 10 % GST to somehow produce a 40% Commonwealth tax rates shows your out of your depth as usual.
As someone mentioned your just an ex-Navy Mullet who repeatedly lies.
again rough but materially correct
Elroo
Premiership Player
- Jul 2, 2014
- 3,994
- 6,809
- AFL Club
- North Melbourne
No wrong.again rough but materially correct
One is a rate imposed for acquiring a non-renewable resource from the community whilst another is based upon the accounting concept of a profit after "all in costs" are included.
If you actually read the presentations from Pietro Guj you linked to, or understood Mineral Economics you'd know that.
Power Raid
We Exist To Win Premierships
No wrong.
One is a rate imposed for acquiring a non-renewable resource from the community whilst another is based upon the accounting concept of a profit after "all in costs" are included.
If you actually read the presentations from Pietro Guj you linked to, or understood Mineral Economics you'd know that.
are you OK Elroo? This is a serious question.
I am reaching out here.
Are you OK?
Elroo
Premiership Player
- Jul 2, 2014
- 3,994
- 6,809
- AFL Club
- North Melbourne
are you OK Elroo? This is a serious question.
I am reaching out here.
Are you OK?
You should disappear for another day and thread PR when you can once again tell us about your worldly experience in the resource industry whilst make simple 1st year mistakes.
If you want to understand Mineral Economics I'ii point you in the direction of some courses you should take?
Power Raid
We Exist To Win Premierships
You should disappear for another day and thread PR when you can once again tell us about your worldly experience in the resource industry whilst make simple 1st year mistakes.
If you want to understand Mineral Economics I'ii point you in the direction of some courses you should take?
If you are Ok, great.
Care to produce some of your own numbers or links rather than abuse?
I have put forward some high level numbers to normalise the various tax regimes to compare to norway. Care to participate in a discussion or are you only capable of silliness?
Power Raid
We Exist To Win Premierships
Yes you did; "Nor does it include the rough 10% state royalties on a profit basis".
There is no way to roughly translate the WA imposed ad-valerom royalty system with a value added or profit based system. Totally different.
no way?
The tax survey shows the industry effective tax rate has remained high and stable at 41 per cent in 2011-12, with an average rate in excess of 41 per cent over the last five years.
http://www.minerals.org.au/news/mining_industry_pays_almost_117_billion_in_taxes_and_royalties
I guess there is no way if you don't try
Similar threads
- Replies
- 52
- Views
- 3K
- Replies
- 24
- Views
- 2K
- Replies
- 28
- Views
- 2K
- Replies
- 115
- Views
- 5K
- Replies
- 36
- Views
- 1K
- Locked
- Replies
- 29
- Views
- 902
