Neither has Adelaide. Never won a spoon either.
1994 Round 14 - St. Kilda and Adelaide drew at Waverley Park.
Follow along with the video below to see how to install our site as a web app on your home screen.
Note: This feature may not be available in some browsers.
Neither has Adelaide. Never won a spoon either.
Don't know exactly what the OP proposes to post for the 4th "ladder".
"1 - Head To Head - Taking into account the most recent result, home and away, between each club."
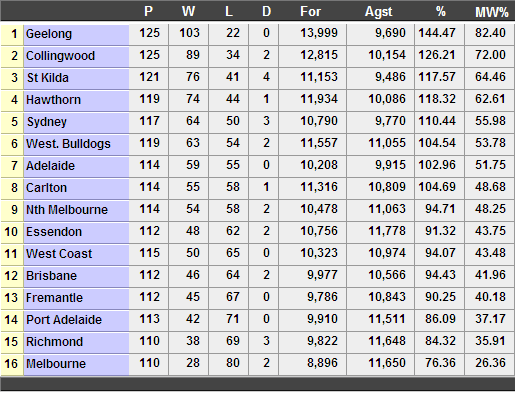
 All matches round 14 2007 to round 14 2012 including finals.Teams ranked by match/win percentage then for and against percentage.
HEAD TO HEAD
Club…………………………P………W………L………D………For……Agnt…………%………PtsCollingwood……………………32………29…………3…………0…………3413…………2301…………148.33………116Geelong………………………………33………25…………8…………0…………3534…………2571…………137.46………100Hawthorn……………………………32………24…………8…………0…………3503…………2537…………138.08…………96Sydney Swans…………………33………23…………9…………1…………3079…………2448…………125.78…………94West Coast………………………32………21………11…………0…………3289…………2552…………128.98…………84Essendon……………………………33………18………15…………0…………3371…………3107…………108.50…………72St Kilda……………………………32………17………15…………0…………3006…………2644…………113.69…………68Adelaide……………………………33………17………16…………0…………2859…………3086……………92.64…………68Carlton………………………………32………16………16…………0…………3015…………2734…………110.28…………64Fremantle…………………………32………16………16…………0…………2591…………2898……………89.41…………60North Melbourne…………33………15………18…………0…………3166…………3296……………96.06…………60Western Bulldogs………33………15………18…………0…………2899…………3069……………94.46…………60Richmond……………………………32………12………20…………0…………2936…………3182……………92.27…………48Brisbane Lions……………33………12………21…………0…………2852…………3186……………89.52…………48Melbourne…………………………33…………8………24…………1…………2814…………3392……………82.96…………34Port Adelaide………………32…………8………24…………0…………2560…………3453……………74.14…………32Gold Coast………………………29…………3………26…………0…………1995…………3618……………55.14…………12GWS Giants………………………13…………1………12…………0……………732…………1540……………47.53……………4
Nice. Collingwood's next 3 opponents are the only 3 losses on that ladder, plus we then play GWS for the first time. Have the opportunity to go to 33-0 if we can win all 4 games.
Does anyone know the number of times a side has won the most recent encounter (either home or away) against all opponents? I'm sure Collingwood have never done it in my lifetime (Geelong obviously the only one in the way last year).
I know that St Kilda (2009), Essendon (2000) and Geelong (2007-08) managed it, but the great Brisbane side of 2001 and Carlton of 1995 both narrowly missed out.
It says how good our recruiting has been that we have won the most games in the last 5 years. Buckley & Clement retired in 2007, Licuria & Wakelin in 2008 & Rocca in 2009.
Don't mean to nitpick, but why no Geelong in the 5 and 10 year tables????
SamesiePost 2007 results will absolutely slaughter our standing.
Almost right Manic. Your three losses are all away games against Carlton, Geelong and Hawthorn, so you can turn the Cats' one over next week, but the Blues and Hawks will have to wait until they are listed as the home team.
I'm sure Roger can work out your other question, but if I get a chance I'll have a look.
Love these threads designed to show off a single period of success of an otherwise failed club who were moved on by the AFL
FYI. If you want any of this kind of information you are able to access it here:Sorry mate, but:
is fairly provocative. No need for it.
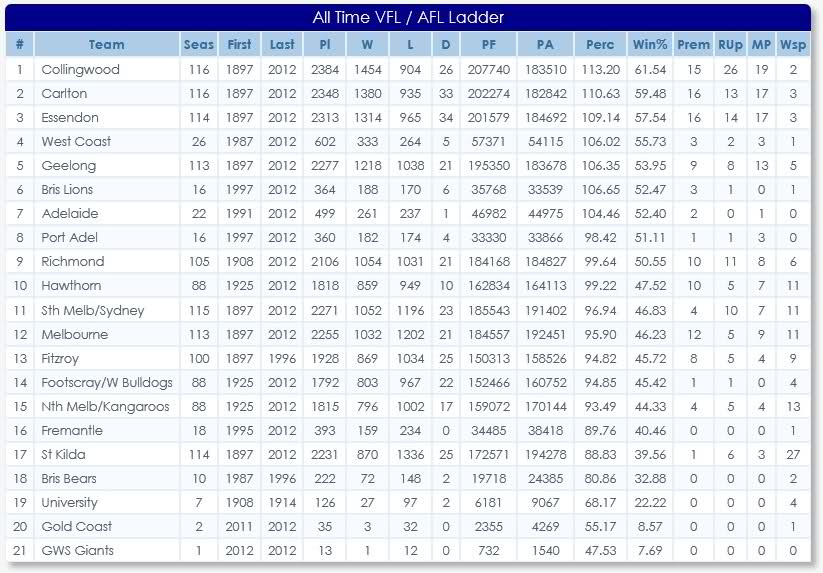
Of course, if you want to look at the records from 1897, Collingwood comes out on top nearly everywhere. But everyone knows that. Records from the last ten years are interesting to dissect, have direct relevance, and are probably not as easy to immediately access. How many tables showing records just from 2002 or 2007 would be in existence? That's why this thread is kind of interesting.
FYI. If you want any of this kind of information you are able to access it here:
http://afl.allthestats.com/?itm=111111
You can add any filter you want to create your custom table from/between any round/year/venue you can imagine.