

hawthorn only 16 away?27 woodens...there's a stat that will never be bettered by another team!!
Navigation
Install the app
How to install the app on iOS
Follow along with the video below to see how to install our site as a web app on your home screen.
Note: This feature may not be available in some browsers.
More options
You are using an out of date browser. It may not display this or other websites correctly.
You should upgrade or use an alternative browser.
You should upgrade or use an alternative browser.
Long Term Ladders - Most Successful Clubs
- Thread starter Here It Is
- Start date
- Tagged users None
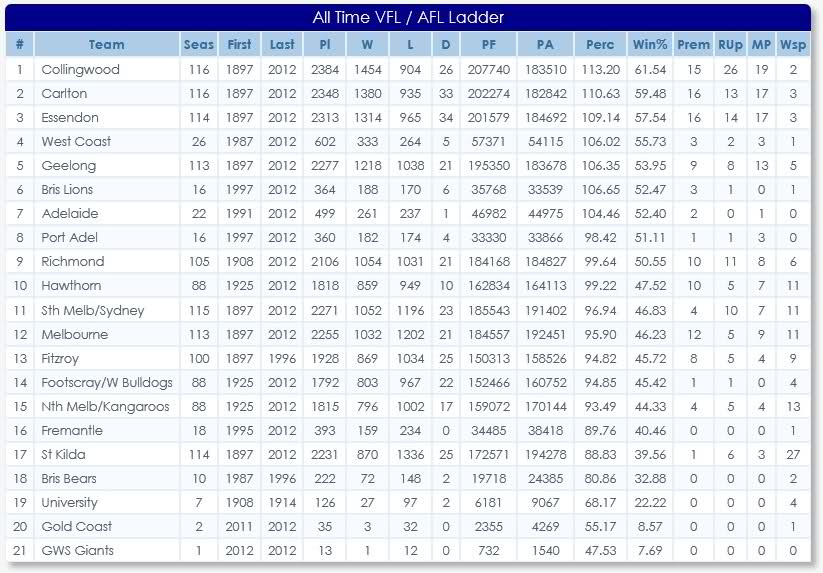
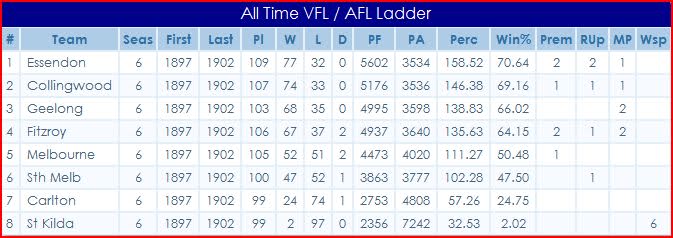
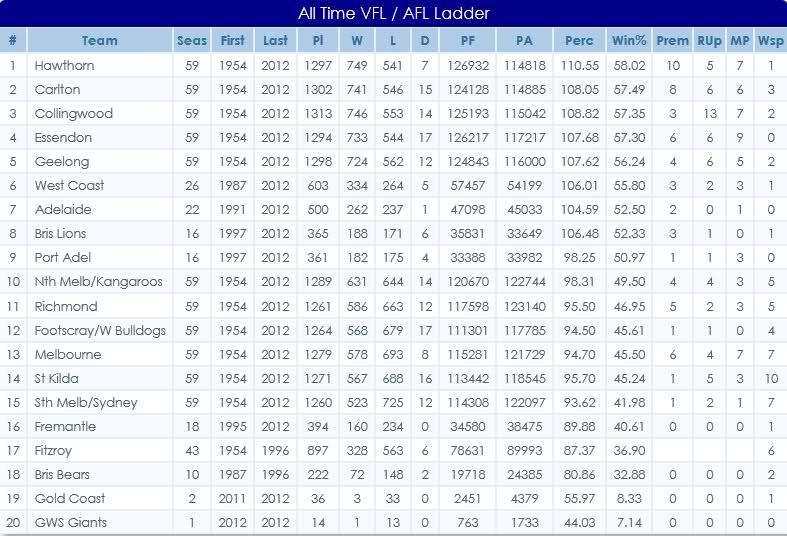
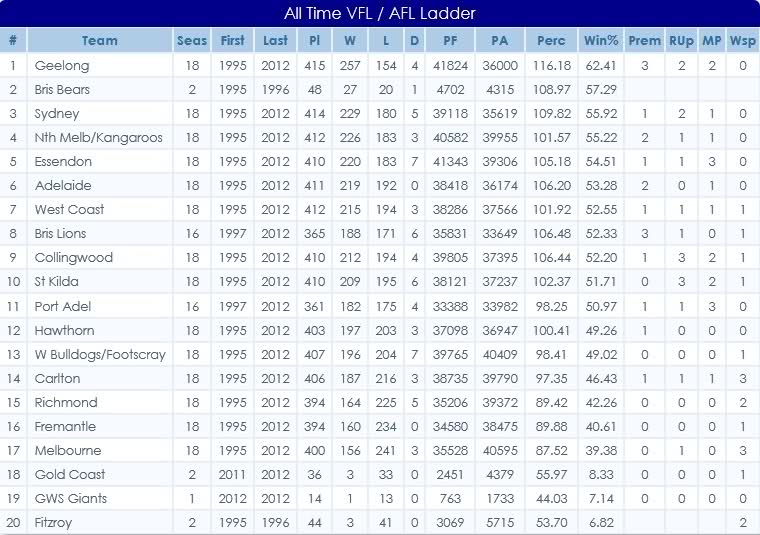
For those who may be interested and haven't seen them before, here are some ladders that you can't generate currently on All the Stats:FYI. If you want any of this kind of information you are able to access it here:
http://afl.allthestats.com/?itm=111111
You can add any filter you want to create your custom table from/between any round/year/venue you can imagine.
Retrospective Match/Win Ratio Tables
And performance in different categories in different eras
The League's 'Four Quarters'
St. Kilda have 27 wooden spoons? Sheesh, feel sorry for their long time supporters...
Yep, pretty glad we're not in the 80's anymore! Only one spoon in the past 24 years

And yeah, we're frequently the most out of place in the 'results last 10 years'...
- Thread starter
- #55
HEAD TO HEAD
Hawthorn takes 2 off Geelong on percentage;
St Kilda, Adelaide and Carlton move up a spot to 6, 7 and 8 as Essendon drops three spots to 9;
Western Bulldogs and North Melbourne swap places at 11 and 12.
A couple of changes from last week:Hawthorn takes 2 off Geelong on percentage;
St Kilda, Adelaide and Carlton move up a spot to 6, 7 and 8 as Essendon drops three spots to 9;
Western Bulldogs and North Melbourne swap places at 11 and 12.
Club…………………………………P………W………L………D…………%………Pts
1. Collingwood………………………32………28…………4…………0…………145.89………112
2. Hawthorn………………………………33………25…………8…………0…………143.93………100
3. Geelong…………………………………33………25…………8…………0…………135.12………100
4. Sydney Swans……………………33………23…………9…………1…………125.61…………94
5. West Coast…………………………32………22………10…………0…………130.32…………88
6. St Kilda………………………………32………18………14…………0…………118.87…………72
7. Adelaide………………………………33………18………15…………0……………95.50…………72
8. Carlton…………………………………32………17………15…………0…………112.32…………68
9. Essendon………………………………33………17………16…………0…………104.47…………68
10. Fremantle…………………………32………16………16…………0……………90.41…………64
11. Western Bulldogs………33………15………18…………0……………93.47…………60
12. North Melbourne…………33………14………19…………0……………95.23…………56
13. Richmond……………………………32………12………20…………0……………92.70…………48
14. Brisbane Lions……………33………12………21…………0……………89.64…………48
15. Melbourne…………………………33…………8………24…………1……………82.41…………34
16. Port Adelaide………………32…………7………25…………0……………71.94…………28
17. Gold Coast………………………29…………3………26…………0……………56.23…………12
18. GWS Giants………………………14…………1………13…………0……………44.03……………4
PAST YEAR
Only one change here:
Fremantle and Brisbane Lions swap places at 13 and 14
Club…………………………………P………W………L………D…………%………Pts
1. Collingwood………………………26………21…………5…………0…………131.46…………84
2. West Coast…………………………26………20…………6…………0…………130.32…………80
3. Hawthorn………………………………25………19…………6…………0…………151.83…………76
4. Geelong…………………………………25………18…………7…………0…………139.67…………72
5. Sydney Swans……………………24………17…………7…………0…………132.18…………68
6. Essendon………………………………23………15…………8…………0…………107.00…………60
7. St Kilda………………………………24………14………10…………0…………128.01…………56
8. Adelaide………………………………22………14…………8…………0…………106.44…………56
9. Carlton…………………………………24………12………12…………0…………114.07…………48
10. North Melbourne…………22………12………10…………0…………101.90…………48
11. Richmond……………………………22………10………12…………0……………99.07…………40
12. Western Bulldogs………22…………8………14…………0……………84.82…………32
13. Fremantle…………………………22…………8………14…………0……………80.22…………32
14. Brisbane Lions……………22…………7………15…………0……………89.20…………28
15. Port Adelaide………………22…………5………17…………0……………70.19…………20
16. Melbourne…………………………22…………4………18…………0……………65.18…………16
17. Gold Coast………………………23…………1………22…………0……………56.18……………4
18. GWS Giants………………………14…………1………13…………0……………44.03……………4
- Thread starter
- #56
PAST 5 YEARS
No changes
Club…………………………………P………W………L………D…………%………Pts
No changes
Club…………………………………P………W………L………D…………%………Pts
1. Geelong………………………………124……102………22…………0…………144.16………408
2. Collingwood……………………124………88………34…………2…………126.24………356
3. St Kilda……………………………120………76………40…………4…………118.61………312
4. Hawthorn……………………………118………74………43…………1…………120.40………298
5. Sydney Swans…………………116………63………50…………3…………110.10………258
6. Western Bulldogs………118………61………55…………2…………103.76………248
7. Adelaide……………………………113………59………54…………0…………102.86………236
8. Carlton………………………………113………56………56…………1…………105.81………226
9. North Melbourne…………113………53………58…………2……………94.43………216
10. West Coast……………………114………51………63…………0……………95.09………204
11. Essendon…………………………111………48………61…………2……………91.33………196
12. Brisbane Lions…………111………44………65…………2……………93.29………180
13. Fremantle………………………111………45………66…………0……………90.80………180
14. Port Adelaide……………112………41………71…………0……………84.87………164
15. Richmond…………………………109………39………67…………3……………84.99………162
16. Melbourne………………………109………27………80…………2……………76.08………112
17. Gold Coast………………………36…………3………33…………0……………55.97…………12
18. GWS Giants………………………14…………1………13…………0……………44.03……………4
PAST 10 YEARS
No changes
Club…………………………………P………W………L………D…………%………Pts
1. Geelong………………………………239……162………75…………2…………125.92………652
2. Collingwood……………………241……146………93…………2…………113.04………588
3. St Kilda……………………………236……142………90…………4…………114.82………576
4. Sydney Swans…………………237……139………95…………3…………112.76………562
5. Adelaide……………………………233……131……102…………0…………110.81………524
6. West Coast………………………234……126……106…………2…………103.32………508
7. Hawthorn……………………………228……117……110…………1…………104.92………470
8. Port Adelaide………………233……116……116…………1……………96.76………466
9. Brisbane Lions……………231……111……116…………4…………102.03………452
10. North Melbourne………225……108……114…………3……………94.63………438
11. Western Bulldogs……230……106……121…………3……………97.69………430
12. Fremantle………………………225……106……119…………0……………96.03………424
13. Essendon…………………………227………99……125…………3……………94.17………402
14. Carlton……………………………223………82……138…………3……………88.67………334
15. Melbourne………………………225………79……143…………3……………85.59………322
16. Richmond…………………………219………75……140…………4……………84.22………308
17. Gold Coast………………………36…………3………33…………0……………55.97…………12
18. GWS Giants………………………14…………1………13…………0……………44.03……………4
- Feb 9, 2011
- 5,996
- 6,486
- AFL Club
- North Melbourne
- Other Teams
- Boston CelticsRedSoxBruins
Interesting stuff guys!!!!!
A ladder from 1993 to 2000 would be a good one
A ladder from 1993 to 2000 would be a good one
johncitizen
Cancelled
So the Pies have played off in 41 of the 114 Grand Finals played. That's more then one third ! Huge stat there.
syl
FAIR and BALANCED
So the Pies have played off in 41 of the 114 Grand Finals played. That's more then one third ! Huge stat there.
And lost the most grand finals too!!
johncitizen
Cancelled
And lost the most grand finals too!!
And won less spoons then all the other older clubs..
syl
FAIR and BALANCED
And won less spoons then all the other older clubs..
Definitely the most successful club, hence the most popular, there's no disputing that.
Collingwood V Melbourne head to head in GF's is like 8 to 1 Melbourne's favour btw
johncitizen
Cancelled
Definitely the most successful club, hence the most popular, there's no disputing that.
Collingwood V Melbourne head to head in GF's is like 8 to 1 Melbourne's favour btw
I hope Melbourne starts to play Finals again soon
 My mum loves the D's
Sidebottom2Beams
Premiership Player
Wow Hawthorn have lost more games than Collingwood and Carlton and joined almost 30 years after both clubs.
Pea Barrel
All Australian
So the Pies have played off in 41 of the 114 Grand Finals played. That's more then one third ! Huge stat there.
Geelong have played in 8 of the last 24 GFs. 3 wins, 5 losses. Under Blight I think they were the best team not to win a premiership.
Interesting stat there was St Kilda only just passed Fitzroy for total number of wins.
Doss
Ass
- Aug 1, 2011
- 75,214
- 112,305
- AFL Club
- Essendon
Geelong have played in 8 of the last 24 GFs. 3 wins, 5 losses. Under Blight I think they were the best team not to win a premiership.
A better way to put it is that they have made the Grand Final in eight of the last 23 completed seasons. The replay in 2010 skews the numbers.
my calculations say they will take 552 years to catch FitzroyInteresting stat there was St Kilda only just passed Fitzroy for total number of wins.
SM
Bigfooty Legend
Isn't this the long-term ladder?
Gotta love Richmond
Very nice! I'd say give it ten-fifteen years and the Swans will have a positive W/L ratio! Given where we're coming from I'd say that'd be massive.
It didn't help St Kilda when they won the first 6 wooden spoons. Interestingly enough, their first win ever happened this way.
"The Round 1 match between St Kilda and Melbourne ended in a draw, but the result was changed to a St Kilda victory on protest, after was noted that the umpire did not signal the end of the third quarter in the correct fashion after hearing the bell. This was St Kilda's first ever VFL win (after 48 losses), and was the first of only two occasions that the score of a game was changed on protest (the second, the 2006 AFL siren controversy, also involved St Kilda)."
"The Round 1 match between St Kilda and Melbourne ended in a draw, but the result was changed to a St Kilda victory on protest, after was noted that the umpire did not signal the end of the third quarter in the correct fashion after hearing the bell. This was St Kilda's first ever VFL win (after 48 losses), and was the first of only two occasions that the score of a game was changed on protest (the second, the 2006 AFL siren controversy, also involved St Kilda)."
Magic Mike
All Australian
- Nov 9, 2011
- 730
- 296
- AFL Club
- Gold Coast
- Banned
- #70
This one will please Hawks supporters
Magic Mike
All Australian
- Nov 9, 2011
- 730
- 296
- AFL Club
- Gold Coast
- Banned
- #72
Since Fremantle entered the league
At least they aren't Melbourne
At least they aren't Melbourne
- Thread starter
- #73
HEAD TO HEAD
Club………………………………P………W…………L………D……………%…………Pts………Change
Collingwood……………………32………29…………3…………0…………147.08………116………=
Hawthorn……………………………33………25…………8…………0…………145.92………100………=
Geelong………………………………33………24…………9…………0…………133.19……… 96………=
Sydney Swans…………………33………23…………9…………1…………127.14…………94………=
West Coast………………………32………22………10…………0…………128.54…………88………=
Adelaide……………………………34………19………15…………0……………99.42…………76………up 1
St Kilda……………………………32………18………14…………0…………118.75…………72………down 1
Essendon……………………………33………18………15…………0…………107.42…………68………up 1
Fremantle…………………………32………17………15…………0……………94.56…………68………up 1
Carlton………………………………32………16………16…………0…………109.39…………64………down 2
North Melbourne…………33………15………18…………0……………97.40…………60………up 1
Western Bulldogs………33………15………18…………0……………92.14…………60………down 1
Richmond……………………………32………12………20…………0……………93.12…………48………=
Brisbane Lions……………33………12………21…………0……………89.70…………48………=
Melbourne…………………………33…………7………25…………1……………79.11…………30………=
Port Adelaide………………32…………6………26…………0……………69.87…………24………=
Gold Coast………………………29…………3………26…………0……………56.09…………12………=
GWS Giants………………………15…………1………14…………0……………43.01……………4………=
PAST YEAR
Club………………………………P………W…………L………D……………%…………Pts………Change
Collingwood……………………26………21…………5…………0…………126.57…………84………=
Hawthorn……………………………25………19…………6…………0…………153.99…………76………up 1
West Coast………………………26………19…………7…………0…………126.97…………76………down 1
Geelong………………………………25………18…………7…………0…………138.23…………72………=
Sydney Swans…………………24………17…………7…………0…………130.61…………68………=
Adelaide……………………………23………15…………8…………0…………112.06…………60………up 2
Essendon……………………………23………15…………8…………0…………107.46…………60………down 1
St Kilda……………………………24………14………10…………0…………125.22…………56………down 1
North Melbourne…………22………13…………9…………0…………109.82…………52………up 1
Carlton………………………………24………12………12…………0…………112.44…………48………down 1
Richmond……………………………22………10………12…………0…………100.88…………40………=
Fremantle…………………………23…………9………14…………0……………82.61…………36………up 1
Brisbane Lions……………22…………7………15…………0……………90.57…………28………up 1
Western Bulldogs………22…………7………15…………0……………80.63…………28………down 2
Port Adelaide………………22…………5………17…………0……………70.67…………20………=
Melbourne…………………………23…………4………19…………0……………65.44…………16………=
Gold Coast………………………23…………2………21…………0……………58.58……………8………=
GWS Giants………………………15…………1………14…………0……………43.01……………4………=
PAST 5 YEARS
Club………………………………P………W………L…………D……………%…………Pts………Change
Geelong……………………………124……101………23…………0…………142.86………404………=
Collingwood…………………124………88………34…………2…………126.30………356………=
St Kilda…………………………120………76………40…………4…………118.54………312………=
Hawthorn…………………………118………75………42…………1…………121.41………302………=
Sydney Swans………………116………64………49…………3…………110.81………262………=
Western Bulldogs……118………61………55…………2…………103.79………248………=
Adelaide…………………………113………60………53…………0…………104.35………240………=
Carlton……………………………113………56………56…………1…………106.42………226………=
North Melbourne………113………53………58…………2……………94.35………216………=
West Coast……………………114………50………64…………0……………94.51………200………=
Essendon…………………………111………49………60…………2……………91.98………200………=
Fremantle………………………111………45………66…………0……………90.87………180………up 1
Brisbane Lions…………111………43………66…………2……………92.10………176………down 1
Richmond…………………………109………39………67…………3……………85.37………162………up 1
Port Adelaide……………112………40………72…………0……………83.99………160………down 1
Melbourne………………………109………27………80…………2……………76.33………112………=
Gold Coast………………………37…………4………33…………0……………56.88…………16………=
GWS Giants………………………15…………1………14…………0……………43.01……………4………=
PAST 10 YEARS
Club…………………………………P…………W…………L…………D……………%……………Pts……Change
Geelong………………………………239………161…………76……………2…………125.41………648………=
Collingwood……………………241………146…………93……………2…………113.14………588………=
St Kilda……………………………236………142…………90……………4…………114.82………576………=
Sydney Swans…………………237………140…………94……………3…………113.26………566………=
Adelaide……………………………233………131………102……………0…………111.39………524………=
West Coast………………………234………126………106……………2…………103.05………508………=
Hawthorn……………………………228………117………110……………1…………103.72………470………=
Port Adelaide………………233………116………116……………1……………96.55………466………=
Brisbane Lions……………231………110………117……………4…………101.96………448………=
North Melbourne…………225………108………114……………3……………94.89………438………=
Western Bulldogs………230………106………121……………3……………97.39………430………=
Fremantle…………………………225………106………119……………0……………96.21………424………=
Essendon……………………………227………100………124……………3……………94.40………406………=
Carlton………………………………223…………82………138……………3……………88.52………334………=
Melbourne…………………………225…………79………143……………3……………85.52………322………=
Richmond……………………………219…………75………140……………4……………84.28………308………=
Gold Coast…………………………37……………4…………33……………0……………56.88…………16………=
GWS Giants…………………………15……………1…………14……………0……………43.01……………4………=
Club………………………………P………W…………L………D……………%…………Pts………Change
Collingwood……………………32………29…………3…………0…………147.08………116………=
Hawthorn……………………………33………25…………8…………0…………145.92………100………=
Geelong………………………………33………24…………9…………0…………133.19……… 96………=
Sydney Swans…………………33………23…………9…………1…………127.14…………94………=
West Coast………………………32………22………10…………0…………128.54…………88………=
Adelaide……………………………34………19………15…………0……………99.42…………76………up 1
St Kilda……………………………32………18………14…………0…………118.75…………72………down 1
Essendon……………………………33………18………15…………0…………107.42…………68………up 1
Fremantle…………………………32………17………15…………0……………94.56…………68………up 1
Carlton………………………………32………16………16…………0…………109.39…………64………down 2
North Melbourne…………33………15………18…………0……………97.40…………60………up 1
Western Bulldogs………33………15………18…………0……………92.14…………60………down 1
Richmond……………………………32………12………20…………0……………93.12…………48………=
Brisbane Lions……………33………12………21…………0……………89.70…………48………=
Melbourne…………………………33…………7………25…………1……………79.11…………30………=
Port Adelaide………………32…………6………26…………0……………69.87…………24………=
Gold Coast………………………29…………3………26…………0……………56.09…………12………=
GWS Giants………………………15…………1………14…………0……………43.01……………4………=
PAST YEAR
Club………………………………P………W…………L………D……………%…………Pts………Change
Collingwood……………………26………21…………5…………0…………126.57…………84………=
Hawthorn……………………………25………19…………6…………0…………153.99…………76………up 1
West Coast………………………26………19…………7…………0…………126.97…………76………down 1
Geelong………………………………25………18…………7…………0…………138.23…………72………=
Sydney Swans…………………24………17…………7…………0…………130.61…………68………=
Adelaide……………………………23………15…………8…………0…………112.06…………60………up 2
Essendon……………………………23………15…………8…………0…………107.46…………60………down 1
St Kilda……………………………24………14………10…………0…………125.22…………56………down 1
North Melbourne…………22………13…………9…………0…………109.82…………52………up 1
Carlton………………………………24………12………12…………0…………112.44…………48………down 1
Richmond……………………………22………10………12…………0…………100.88…………40………=
Fremantle…………………………23…………9………14…………0……………82.61…………36………up 1
Brisbane Lions……………22…………7………15…………0……………90.57…………28………up 1
Western Bulldogs………22…………7………15…………0……………80.63…………28………down 2
Port Adelaide………………22…………5………17…………0……………70.67…………20………=
Melbourne…………………………23…………4………19…………0……………65.44…………16………=
Gold Coast………………………23…………2………21…………0……………58.58……………8………=
GWS Giants………………………15…………1………14…………0……………43.01……………4………=
PAST 5 YEARS
Club………………………………P………W………L…………D……………%…………Pts………Change
Geelong……………………………124……101………23…………0…………142.86………404………=
Collingwood…………………124………88………34…………2…………126.30………356………=
St Kilda…………………………120………76………40…………4…………118.54………312………=
Hawthorn…………………………118………75………42…………1…………121.41………302………=
Sydney Swans………………116………64………49…………3…………110.81………262………=
Western Bulldogs……118………61………55…………2…………103.79………248………=
Adelaide…………………………113………60………53…………0…………104.35………240………=
Carlton……………………………113………56………56…………1…………106.42………226………=
North Melbourne………113………53………58…………2……………94.35………216………=
West Coast……………………114………50………64…………0……………94.51………200………=
Essendon…………………………111………49………60…………2……………91.98………200………=
Fremantle………………………111………45………66…………0……………90.87………180………up 1
Brisbane Lions…………111………43………66…………2……………92.10………176………down 1
Richmond…………………………109………39………67…………3……………85.37………162………up 1
Port Adelaide……………112………40………72…………0……………83.99………160………down 1
Melbourne………………………109………27………80…………2……………76.33………112………=
Gold Coast………………………37…………4………33…………0……………56.88…………16………=
GWS Giants………………………15…………1………14…………0……………43.01……………4………=
PAST 10 YEARS
Club…………………………………P…………W…………L…………D……………%……………Pts……Change
Geelong………………………………239………161…………76……………2…………125.41………648………=
Collingwood……………………241………146…………93……………2…………113.14………588………=
St Kilda……………………………236………142…………90……………4…………114.82………576………=
Sydney Swans…………………237………140…………94……………3…………113.26………566………=
Adelaide……………………………233………131………102……………0…………111.39………524………=
West Coast………………………234………126………106……………2…………103.05………508………=
Hawthorn……………………………228………117………110……………1…………103.72………470………=
Port Adelaide………………233………116………116……………1……………96.55………466………=
Brisbane Lions……………231………110………117……………4…………101.96………448………=
North Melbourne…………225………108………114……………3……………94.89………438………=
Western Bulldogs………230………106………121……………3……………97.39………430………=
Fremantle…………………………225………106………119……………0……………96.21………424………=
Essendon……………………………227………100………124……………3……………94.40………406………=
Carlton………………………………223…………82………138……………3……………88.52………334………=
Melbourne…………………………225…………79………143……………3……………85.52………322………=
Richmond……………………………219…………75………140……………4……………84.28………308………=
Gold Coast…………………………37……………4…………33……………0……………56.88…………16………=
GWS Giants…………………………15……………1…………14……………0……………43.01……………4………=
tacopavlich
Premiership Player
How about 1966 to 1966 please?
Similar threads
- Replies
- 60
- Views
- 3K
